
- Contact Us:
-

-

-

-


Daily Market Updates
27 Apr 2024
EURUSD
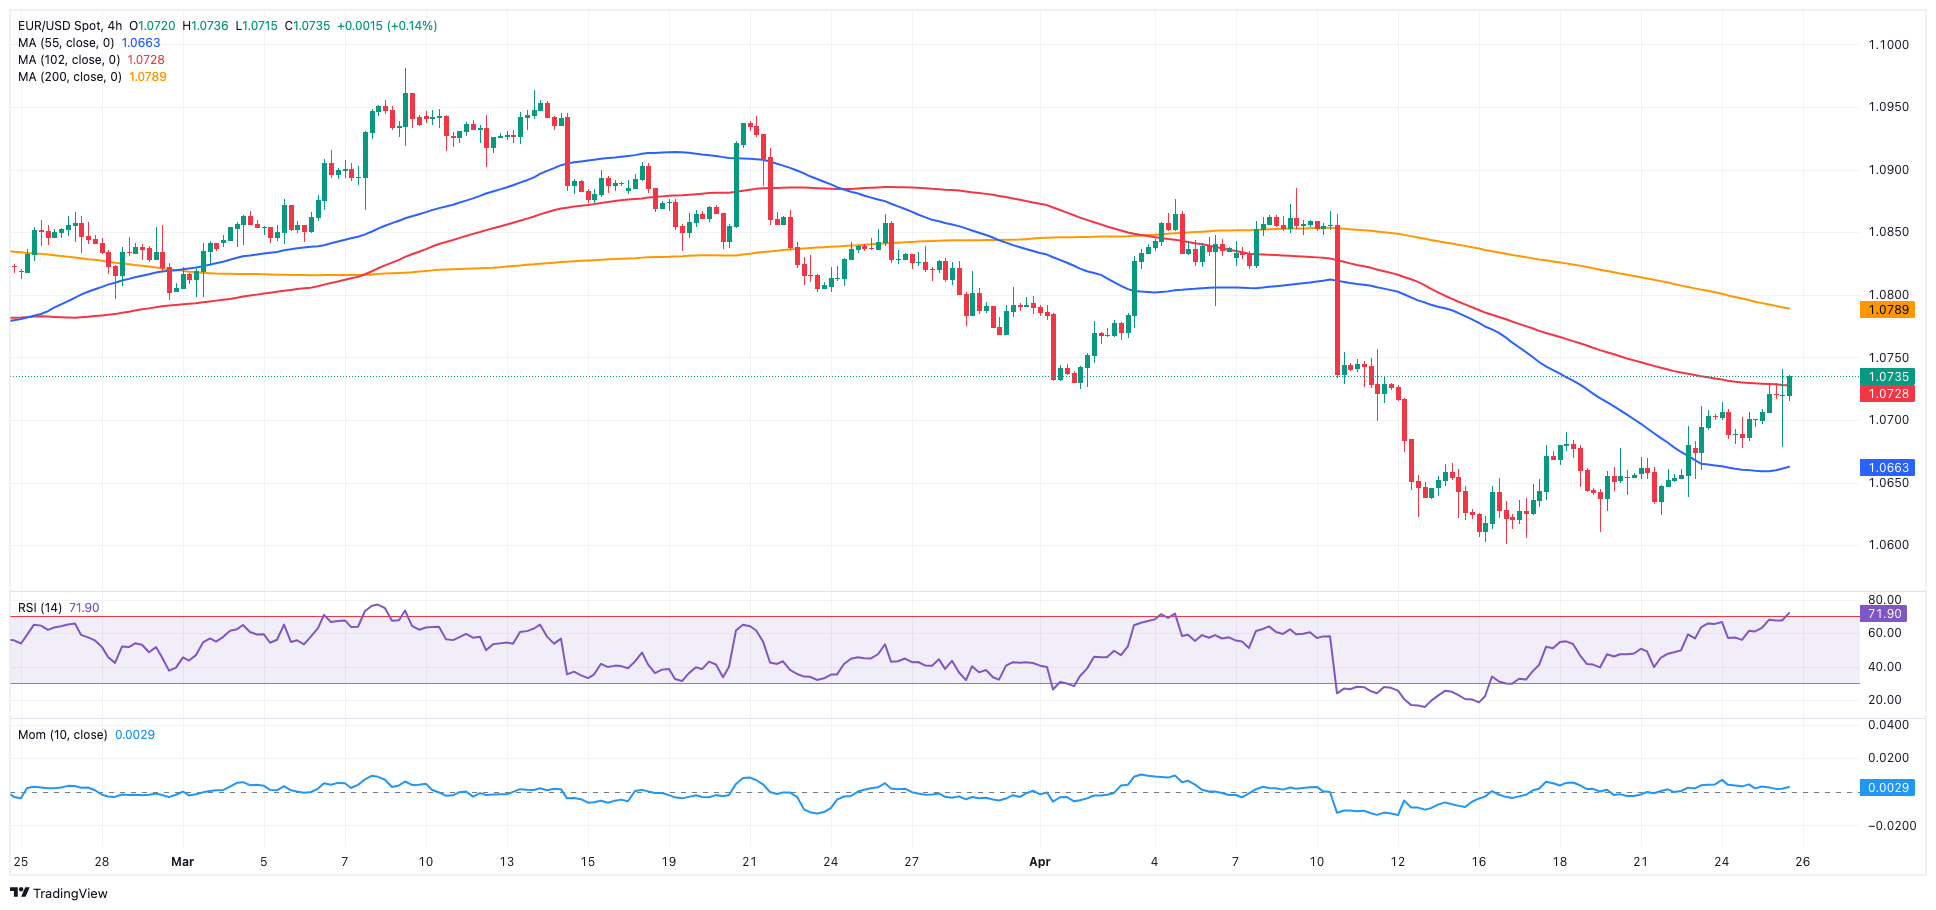
Quite a volatile session saw EUR/USD advance to multi-day highs around 1.0740 just to recede near 1.0680 soon after US results showed a pick-up in inflation during the January-March period. Towards the end of the day, the pair ended with decent gains past 1.0700 the figure.
By the same token, the greenback gathered rapid upside traction after the first estimate of the US GDP Growth Rate expanded at an annualized 1.6% in the first quarter, markedly below consensus. However, the GDP Price Index (deflator) rose more than estimated by 3.1% in Q1, which reignited speculation of an even later (than September) interest rate cut by the Fed. However, the index faded that initial uptick and close the session in the negative territory.
The move lower in the dollar also contrasted with fresh multi-month highs in US yields across various timeframes.
Back to the domestic calendar, Consumer Confidence in Germany improved to -24.2 in May, according to GfK. In the US, and other than the GDP prints, usual weekly Initial Claims increased by 207K in the week to April 20, and Pending Home Sales expanded by 0.1% in the year to March.
The surpass of the weekly high of 1.0740 (April 25) could prompt EUR/USD to revisit the crucial 200-day SMA of 1.0807, before reaching the weekly top of 1.0885 (April 9) and the March peak of 1.0981 (March 8). Up from here comes a weekly high of 1.0998 (January 5, 2011), just ahead of the important 1.1000 yardstick. The breakout of this zone may put pressure on the December 2023 top of 1.1139 (December 27), which is still supported by the 200-week SMA of 1.1138 and occurs before the 2023 high of 1.1275 (July 18). The other way around, additional weakness might lead to a return to the 2024 low of 1.0601 (April 16) prior to the weekly low of 1.0495 (October 13, 2023), the 2023 bottom of 1.0448 (October 3) and the round level of 1.0400. The RSI increased beyond 47 on the daily chart.
Resistance levels: 1.0740 1.0756 1.0788 (4H chart)
Support levels: 1.0659 1.0601 1.0516 (4H chart)
USDJPY
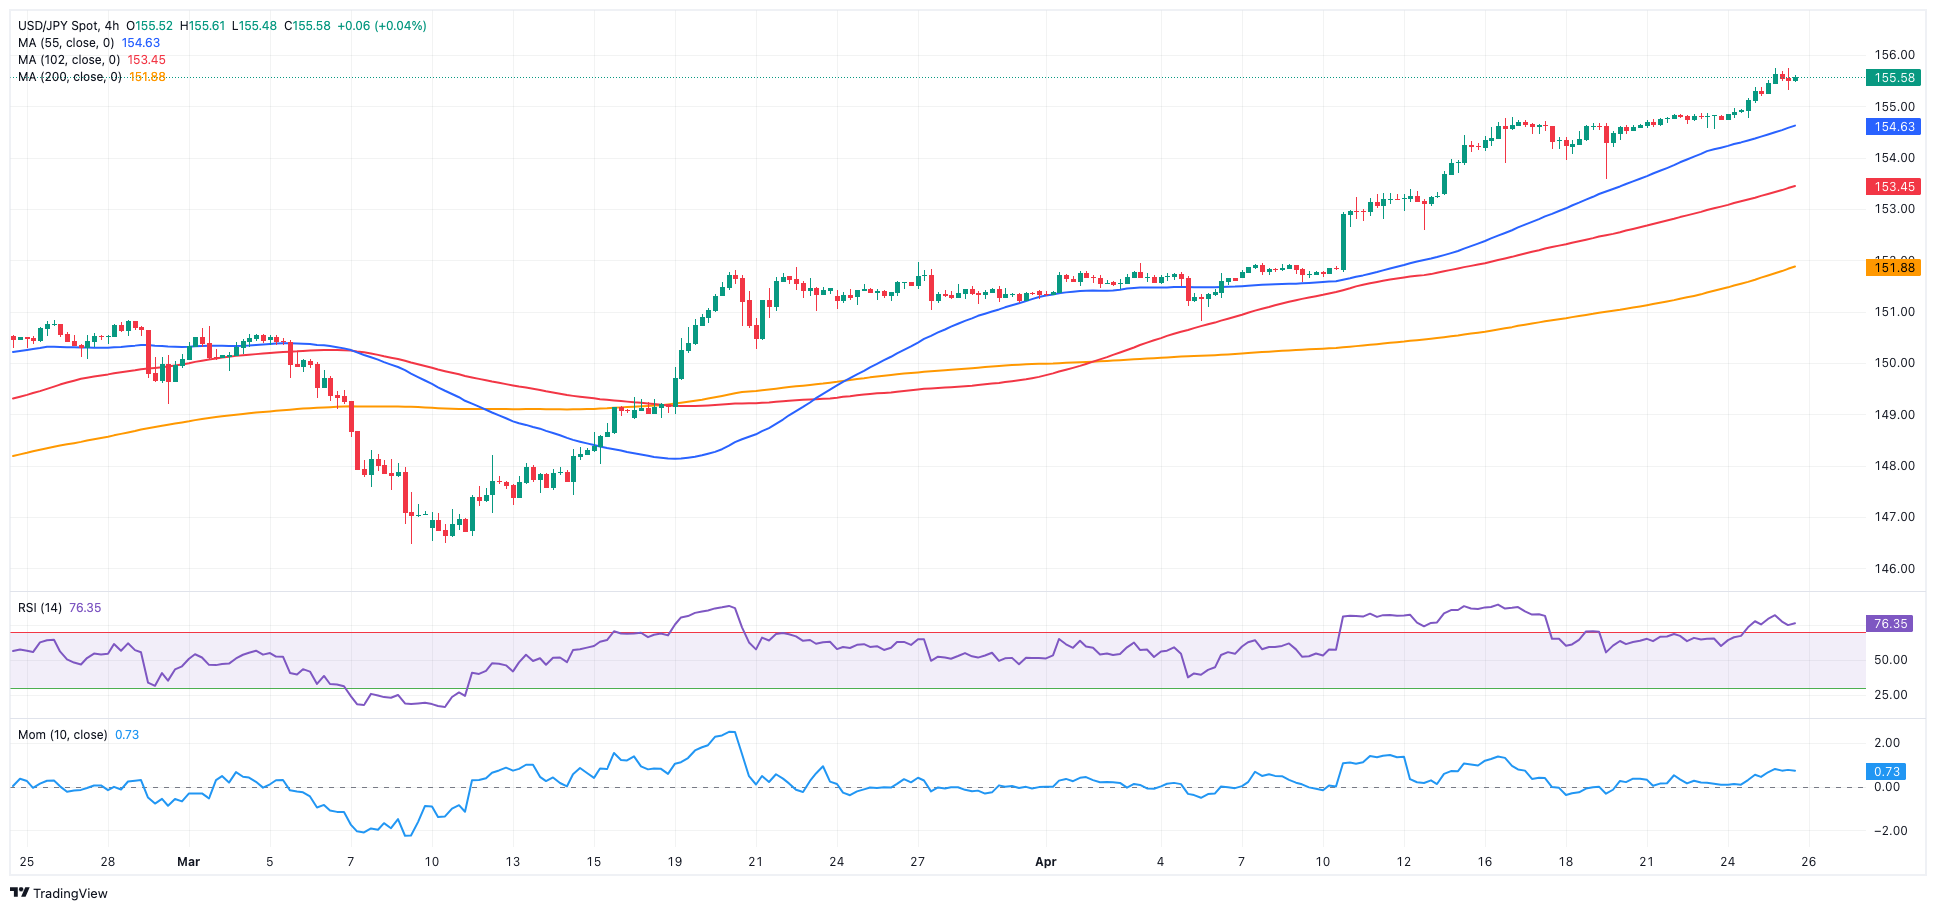
Another day, another high in USD/JPY. This time, the pair reached the 155.75 level, recording a new 34-year top on the back of the unstoppable depreciation of the Japanese currency.
Price action around spot came on the back of a small knee-jerk in the greenback associated with US yields in fresh tops, while JGB 10-year yields also advanced to levels last seen in early November beyond 0.90%.
Looking ahead, market participants predominantly anticipate that the Bank of Japan (BoJ) will abstain from lowering its rate during Friday's event. Recent remarks from the BoJ's Ueda indicated that maintaining accommodative monetary conditions is deemed suitable as long as underlying inflation stays below 2%. However, he cautioned that if price trends align with forecasts and approach the 2% threshold, it would necessitate an increase in short-term interest rates.
In the domestic docket, Foreign Bond Investment increased by ¥648.1B in the week to April 20, while the final Coincident Index and Leading Economic Index came in at 111.6 and 111.8, respectively, in February.
The next upward barrier for USD/JPY is the 2024 high of 155.74 (April 25), which is ahead of the June 1990 high of 155.80. On the contrary, the pair is expected to find first support around the preliminary 55-day SMA at 151.14, prior to the April low of 150.80 (April 5). The loss of this area reveals the intermediate 100-day SMA at 148.50, ahead of the key 200-day SMA at 147.96, all prior to the March low of 146.47 (March 8). A collapse in this zone might result in a return to the February low of 145.89 (February 1), which comes before the December 2023 low of 140.24 (December 28), the round number 140.00, and the July 2023 bottom of 137.23 (July 14). The daily RSI advanced further into the overbought zone to around 80.
Resistance levels: 155.74 155.80 155.88 (4H chart)
Support levels: 153.58 152.58 151.56 (4H chart)
GBPUSD
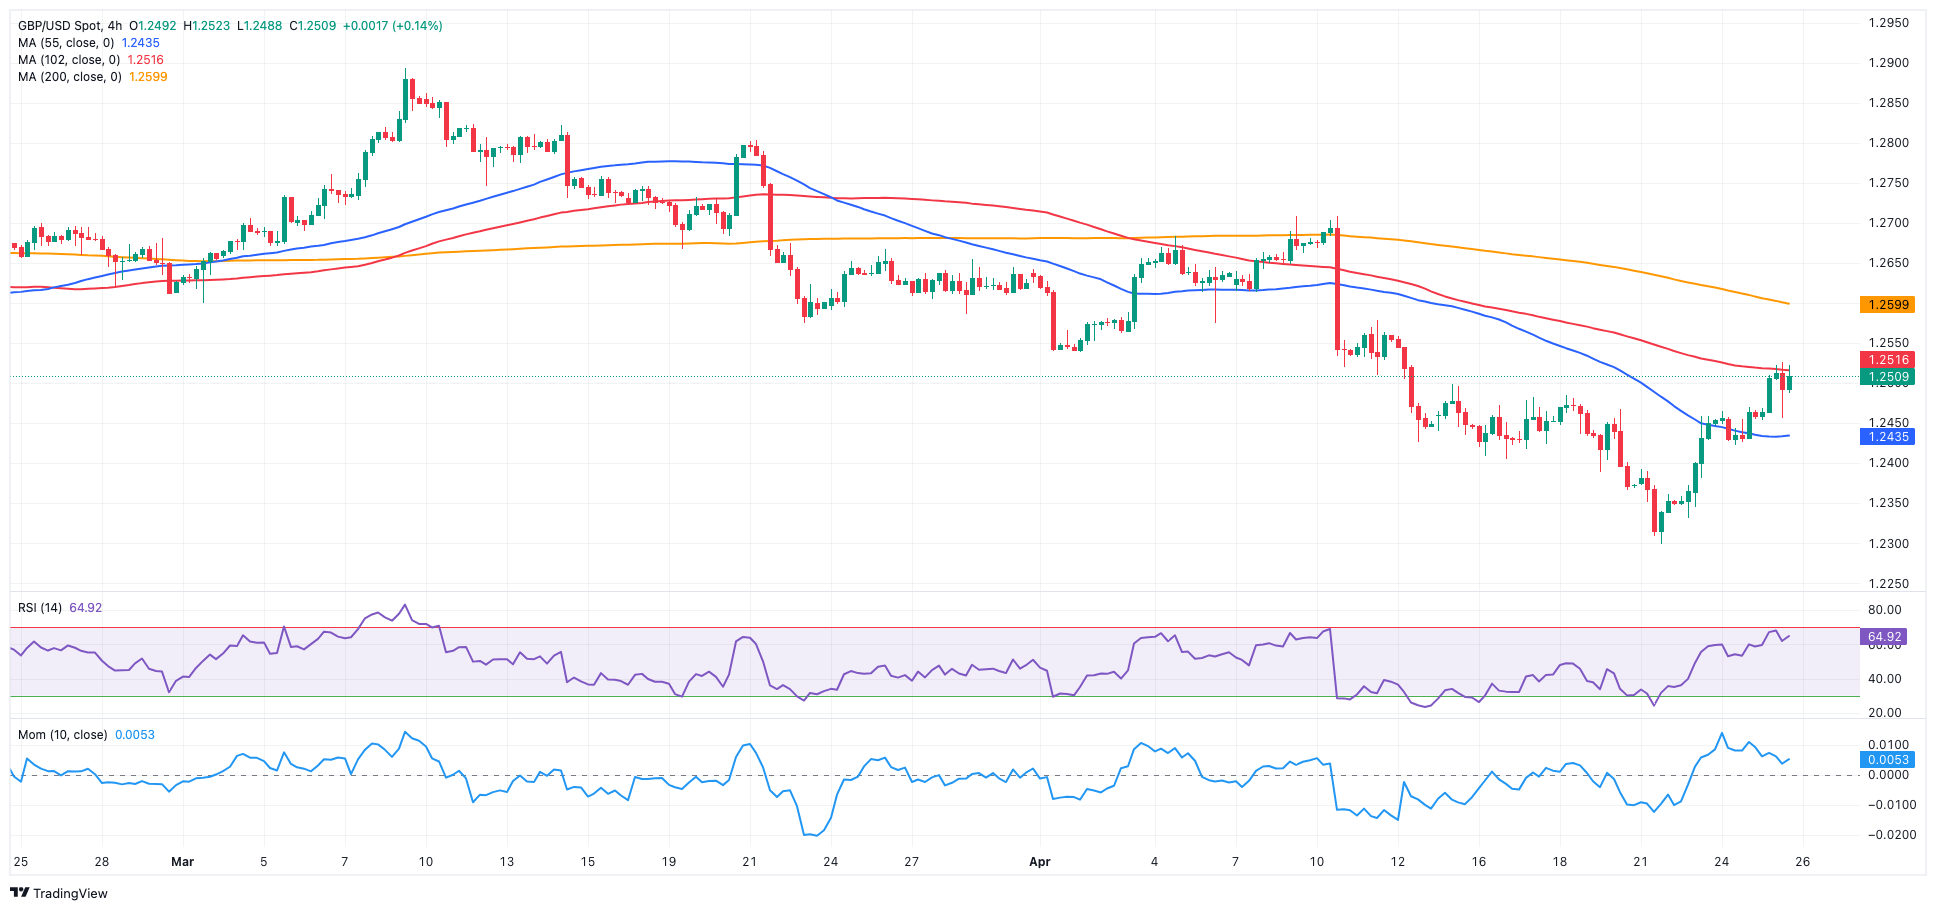
The resumption of the bearish bias in the greenback helped the quid maintain its weekly bullish stance, propelling GBP/USD to new two-week highs north of 1.2500 the figure on Thursday.
In fact, Cable kept its ongoing recovery well in place against the backdrop of the persistent weakness in the dollar, despite quarterly inflation figures recorded in the Q1 GDP deflator rising above estimates.
A glimpse at the BoE noted that UK interest rate swaps suggested that the initial 25 bps rate reduction is fully anticipated for August 2024, with expectations also forecasting two additional rate cuts by the end of the year.
The extra gains for the pair were also propped up by the rise in UK 10-year gilt yields to fresh five-month tops around 4.40%.
Across the Channel, the CBI Distributive Trades worsened to -44 in April.
The crucial 200-day SMA of 1.2561 is GBP/USD's initial upward barrier, followed by the April high of 1.2709 (April 9), the weekly top of 1.2803 (March 21), and the 2024 peak of 1.2893 (March 8). North of here, the weekly high of 1.2995 (July 27, 2023) is just ahead of the psychological 1.3000 level. On the flip side, the 2024 bottom of 1.2299 (April 22) comes first, followed by the weekly low of 1.2187 (November 10, 2023), which precedes the October 2023 low of 1.2037 and the significant 1.2000 conflict zone. On the daily chart, the RSI rose past the 45 level.
Resistance levels: 1.2525 1.2578 1.2600 (4H chart)
Support levels: 1.2299 1.2187 1.2069 (4H chart)
GOLD
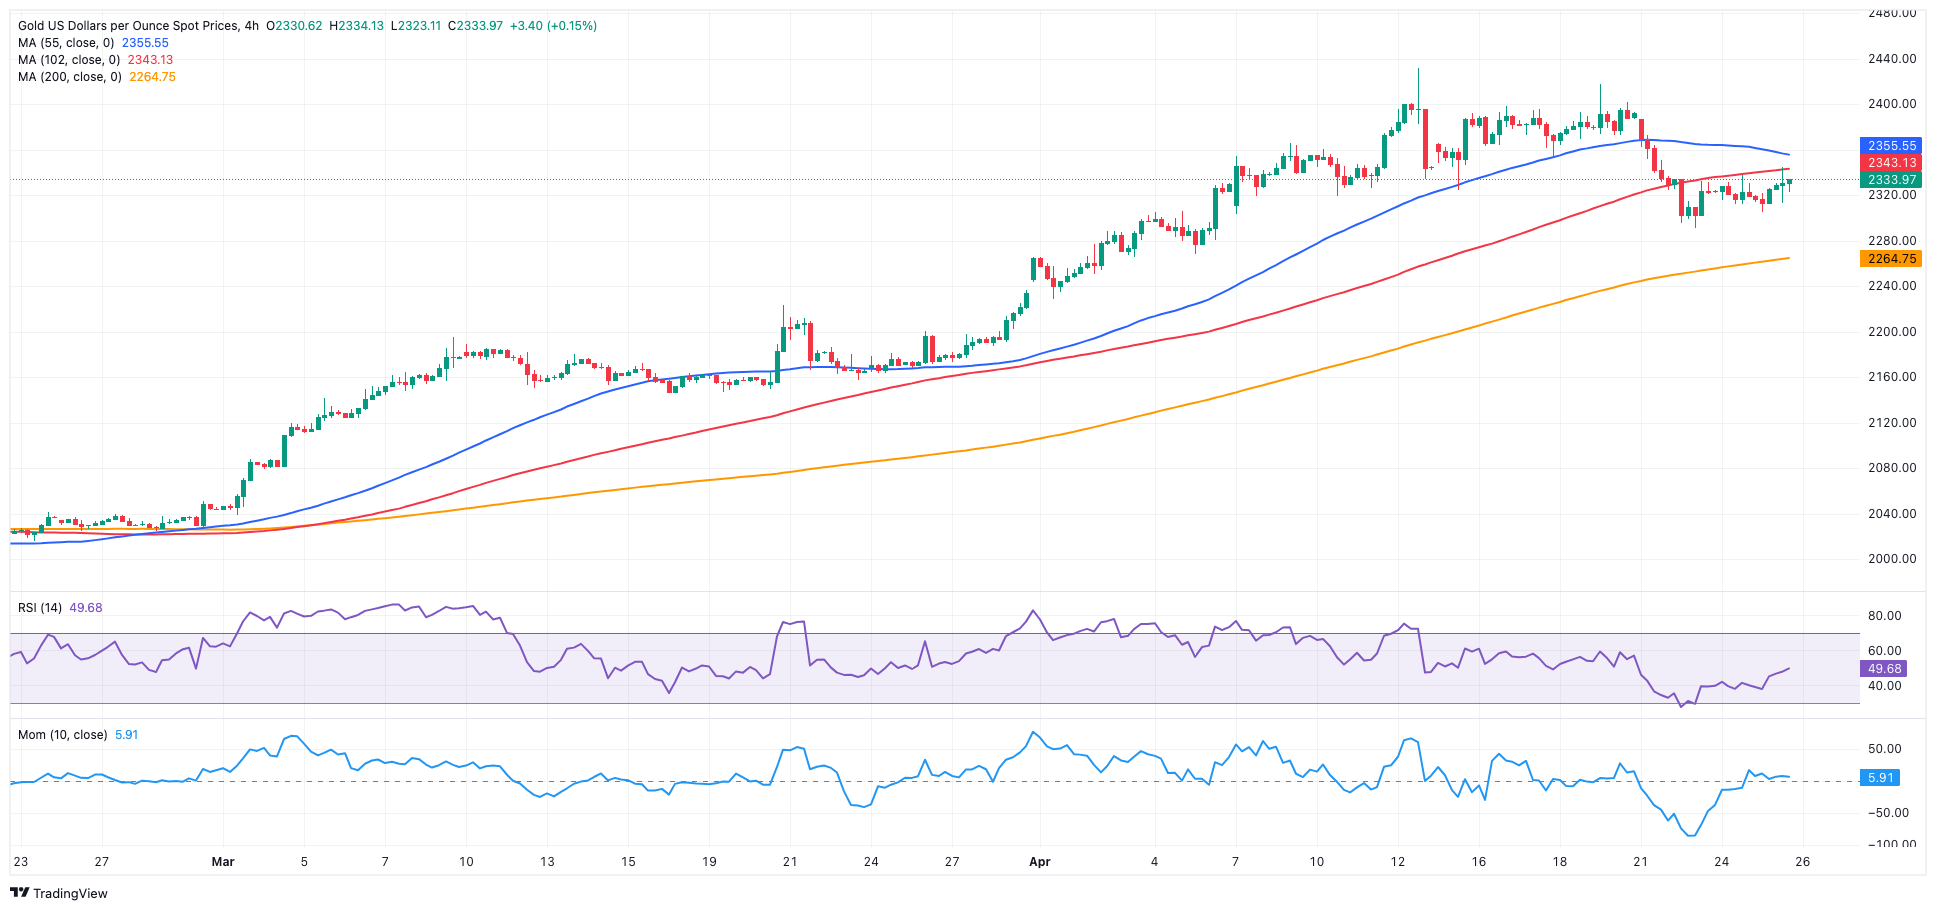
Gold prices set aside three consecutive daily pullbacks on Thursday, retesting the $2,340 region per troy ounce.
The daily uptick in bullion came pari passu with the resurgence of the bearish tone in the greenback and a decent rebound in US yields across various maturities, particularly after higher inflation readings from the Q1 GDP deflator.
On the latter, the pace of US economic growth decelerated beyond initial expectations in the first quarter, yet a rise in inflation indicators indicated that the Fed would likely refrain from lowering interest rates until September.
Meanwhile, two pivotal aspects of gold demand—central bank acquisitions and physical demand in China—persisted in showing strength, offering ongoing support to the precious metal.
Gold continues to face immediate resistance at its all-time high of $2,431 (April 12). Instead, there is initial support at the weekly low of $2,291 (April 24) ahead of the transitory 55-day SMA of $2,182, which is followed by the weekly low of $2,146 (March 18). The breach of the latter indicates a possible decline to the intermediate 100-day SMA of $2,115, prior to the more important 200-day SMA of $2,027. The low in 2024 is $1,984 (February 14), seconded by the December 2023 low of $1,973 (December 13) and the November 2023 bottom of $1,931 (November 10). Failure in this position may send the metal to its October 2023 bottom of $1,810 (October 6), followed by the 2023 low of $1,804 (February 28) and the critical $1,800 conflict zone.
Resistance levels: $2,356 $2,417 $2,431 (4H chart)
Support levels: $2,291 $2,264 $2,228 (4H chart)
CRUDE WTI
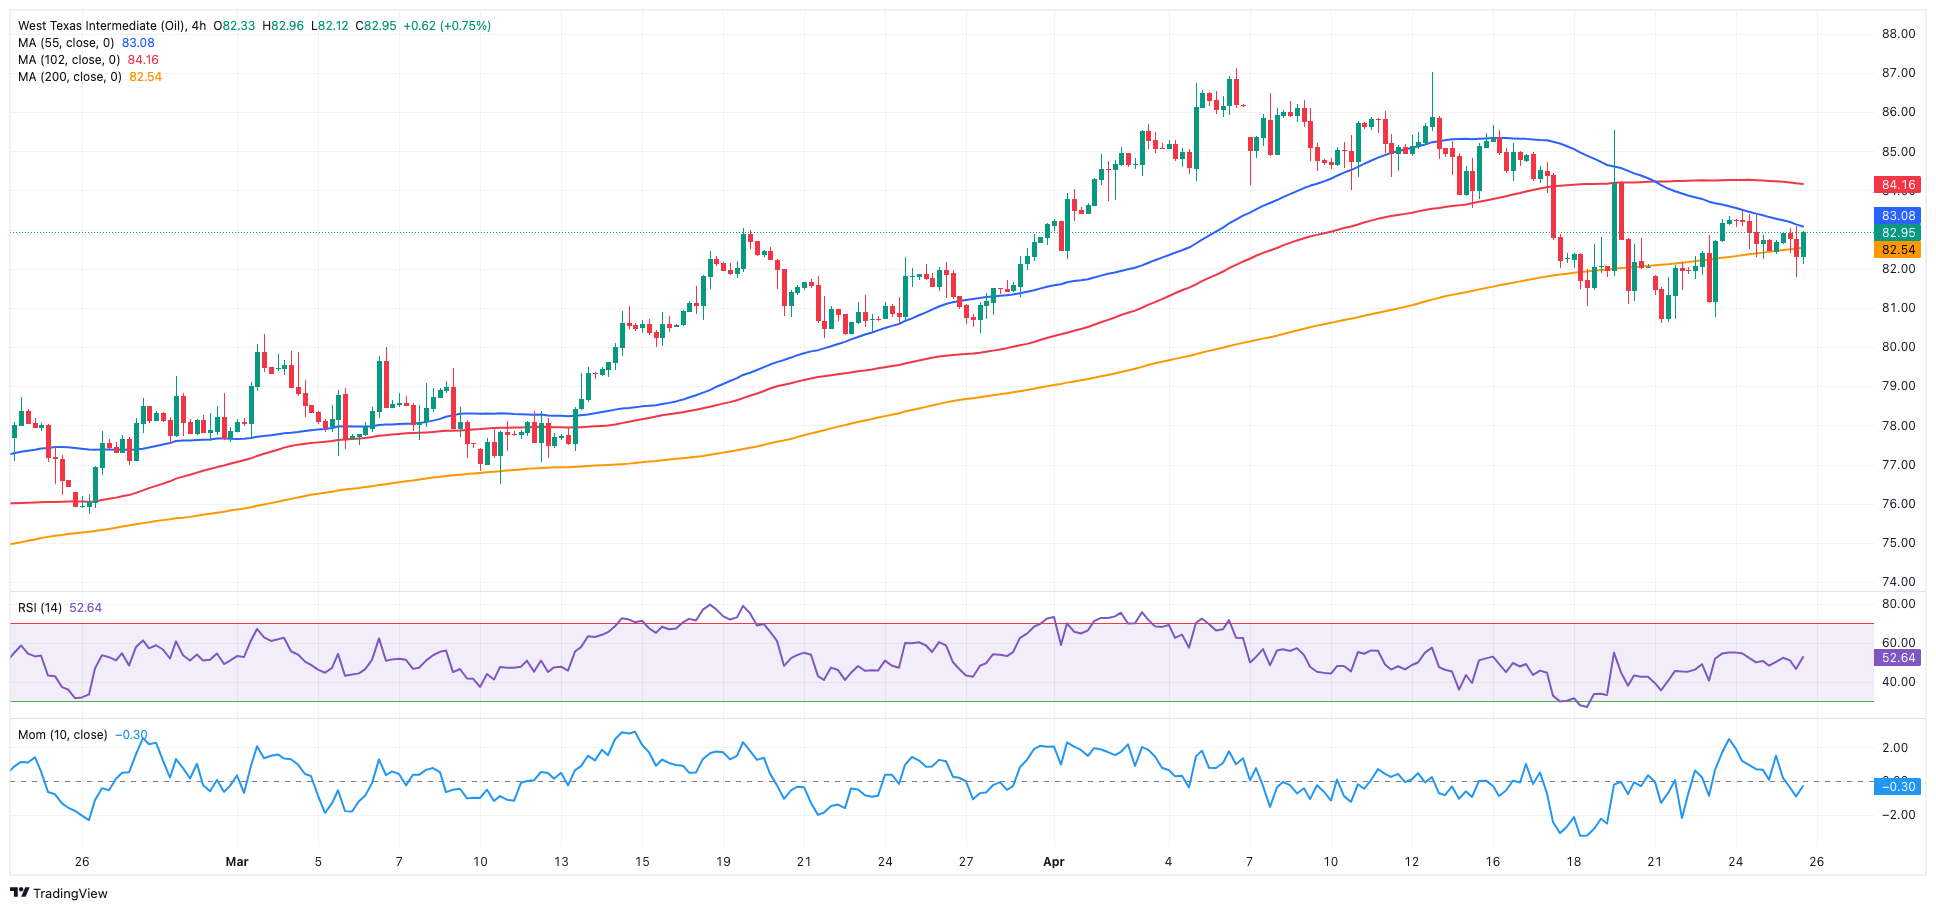
Prices of WTI reversed Wednesday’s pullback and reclaimed the area beyond the $83.00 mark per barrel against the backdrop of a narrow trading range.
In the meantime, price action around crude oil prices reflected demand concerns after the EIA reported a drop in US gasoline inventories, while distillate stockpiles increased, contrary to expectations of a decline in the week ending April 19.
Reinforcing the above, the US economy expanded less than estimated in the January–March period amidst higher inflation, according to advanced Q1 GDP figures.
On the supportive side for prices, the intensification of the Israel-Hamas conflict threatens to spread further, potentially reigniting speculation over supply disruptions.
If bears gain control, the next target for WTI is the April low of $80.74 (April 22), followed by the weekly low of $80.33 (March 21) and the key 200-day SMA at $79.96. A breach of the latter might result in a test of the February low of $71.43 (February 5), ahead of the important $70.00 barrier and the 2024 low of $69.31 (January 3). Extra losses from here could put a test of the December 2023 low of $67.74 (December 13) back on the radar. In contrast, the immediate upward barrier is the 2024 top of $87.60 (April 12), which comes before the weekly peak of $89.83 (October 18, 2023) and the 2023 high of $94.99 (September 28, 2023). Once the commodity clears this region, it could dispute the weekly top of $97.65 (August 30 2023) prior to the psychological $100.00 barrier.
Resistance levels: $83.67 $85.58 $86.14 (4H chart)
Support levels: $80.68 $80.51 $76.76 (4H chart)
GER40
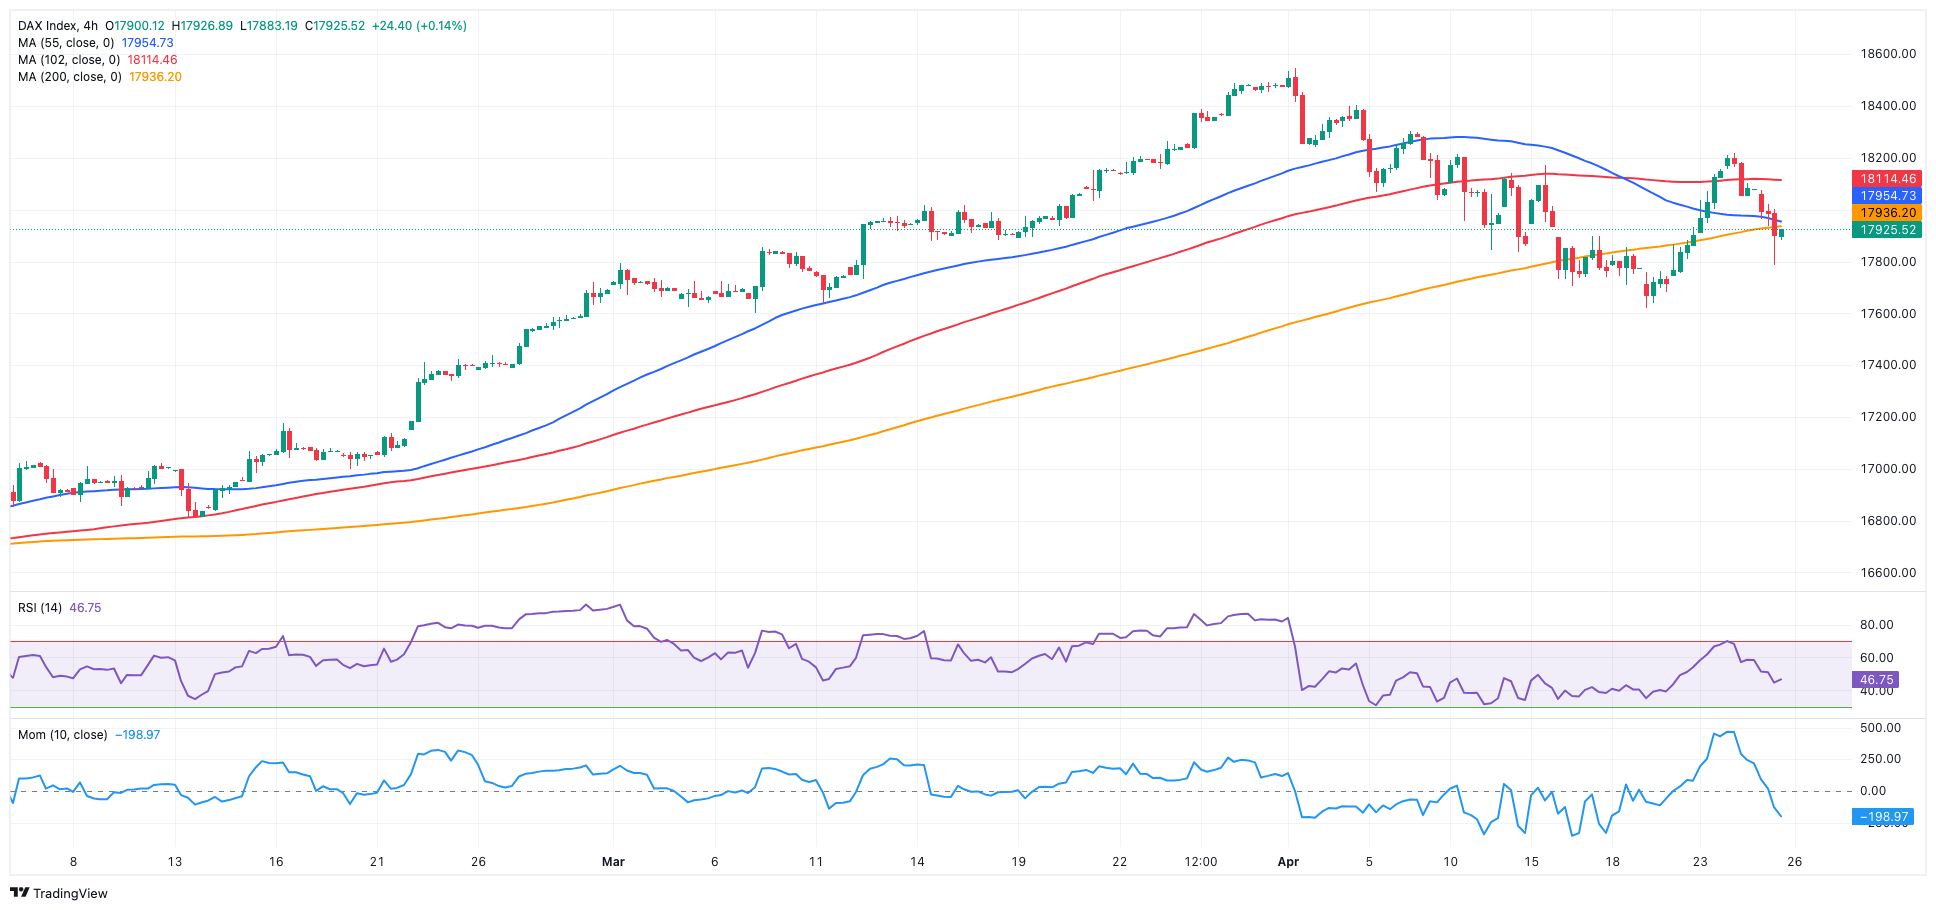
German equities added to Wednesday’s losses and dragged the reference DAX40 to three-day lows before rebounding a tad and closing below the 18,000 yardstick on Thursday.
Indeed, the daily pullback in the index came in line with the disheartening performance of its European peers on Thursday, which were impacted by disappointing earnings reports. Additionally, sentiment was dampened by lacklustre economic growth data from the US.
The daily losses in the index coincided with a rise in 10-year bund yields to levels last seen in late November of approximately 2.65%.
The continuation of the DAX40's rebound should retarget the record high of 18,567 (April 2). Having said that, there is immediate support at the April low of 17,626 (April 19), which comes before the March low of 17,619 (March 7). Once sellers have cleared the latter, a challenge to the February low of 16,821 (February 1) is likely, followed by the crucial 200-day SMA of 16,457 and the 2024 bottom of 16,345 (January 17). After falling below this level, the weekly low of 15,915 (November 28) might be revisited, followed by the October low of 14,630 (October 23) and the 2023 bottom of 14,458 (March 20). On the daily chart, the RSI dropped below 49.
Best Performers: Deutsche Bank AG, Infineon, Commerzbank
Worst Performers: Symrise AG, Sartorius AG VZO, SAP
Resistance levels: 18,226 18,427 18,567 (4H chart)
Support levels: 17,705 17,626 16,831 (4H chart)
GBPJPY
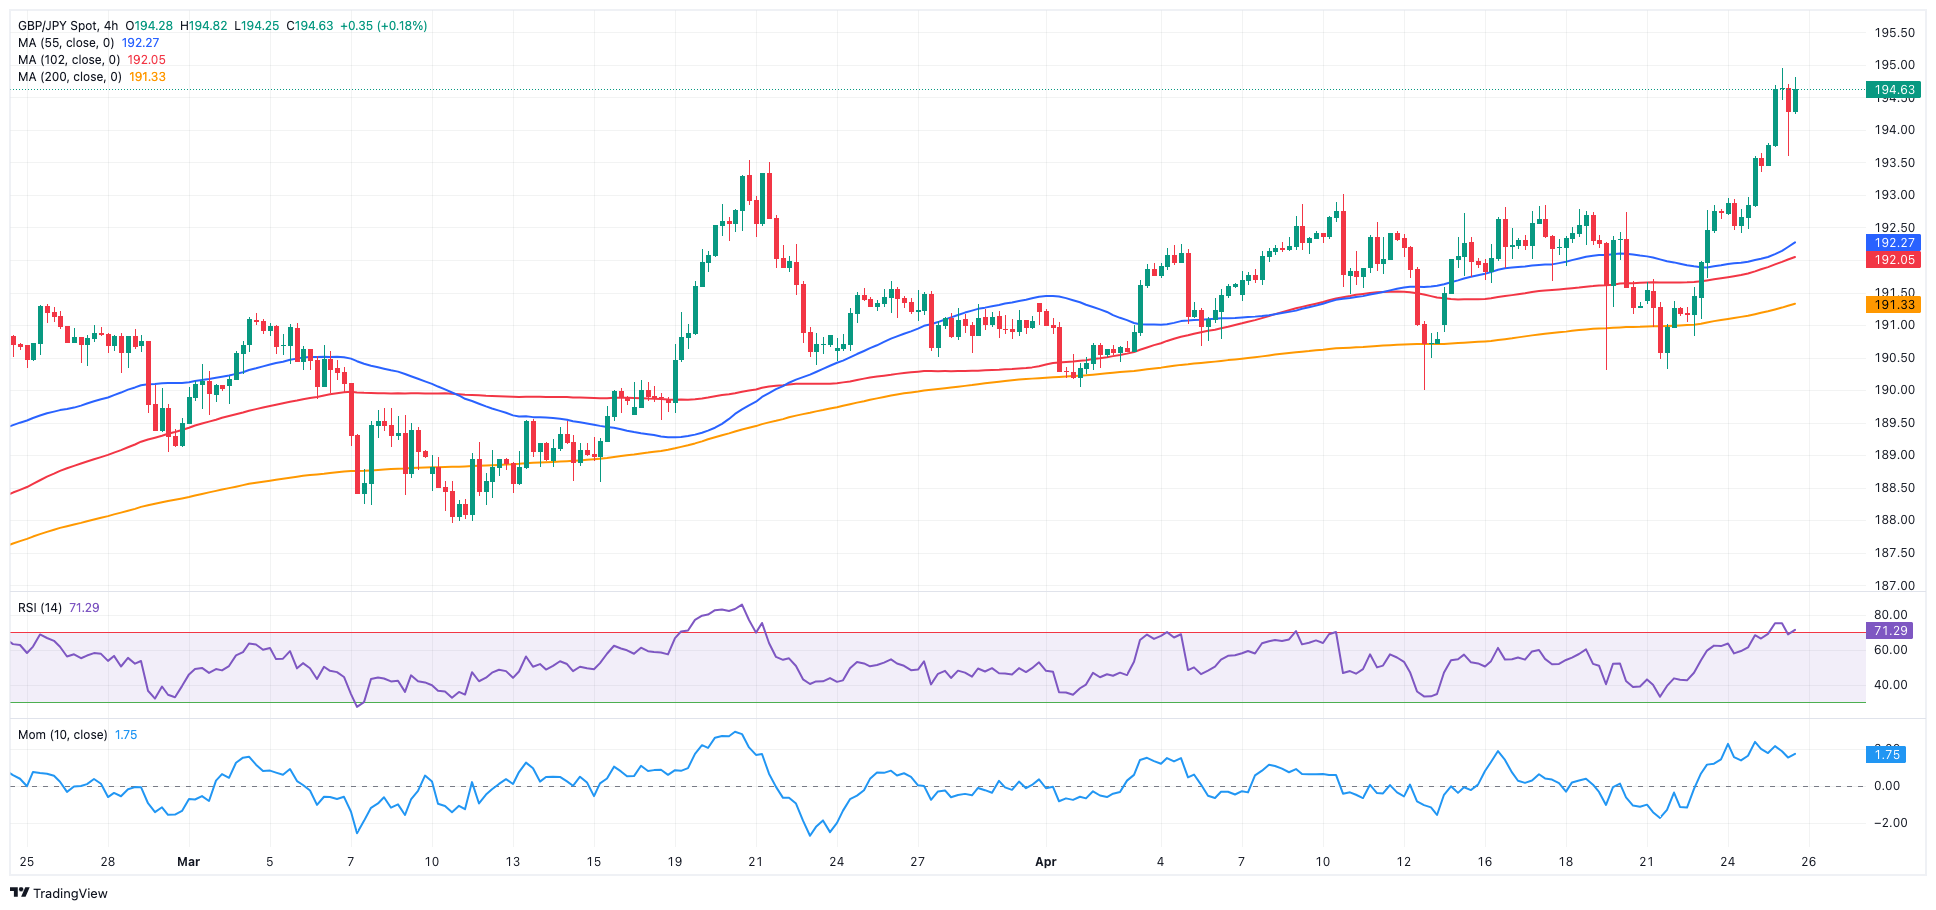
The intense selling pressure hitting the Japanese yen in combination with extra gains in the British pound propelled GBP/JPY to levels just shy of the 195.00 barrier for the first time since August 2015.
In fact, the prevailing risk-on mood favoured the extra advance in the cross amidst another negative session in the US dollar. However, the ongoing optimism in GBP/JPY could be put to the test in case the BoJ meeting unveils any measures to support the beleaguered currency or delivers some form of hawkish message.
The immediate upward target for GBP/JPY is the 2024 top of 194.95 (April 25). The breakout of this level might provide a challenge to the August 2015 peak of 195.28 (August 18), ahead of the record high of 195.88 (June 24, 2015). On the other side, if the cross falls below the April low of 189.99 (April 12), it may test the March low of 187.96 (March 11), which appears reinforced by the intermediate 100-day SMA at 187.90. The crucial 200-day SMA of 185.81 appears down from here, ahead of the February low of 185.22 (February 1) and the December 2023 bottom of 178.33 (December 14). The RSI approached 65 on the daily chart.
Resistance levels: 194.95 195.28 195.88 (4H chart)
Support levels: 192.41 191.31 190.32 (4H chart)
NASDAQ
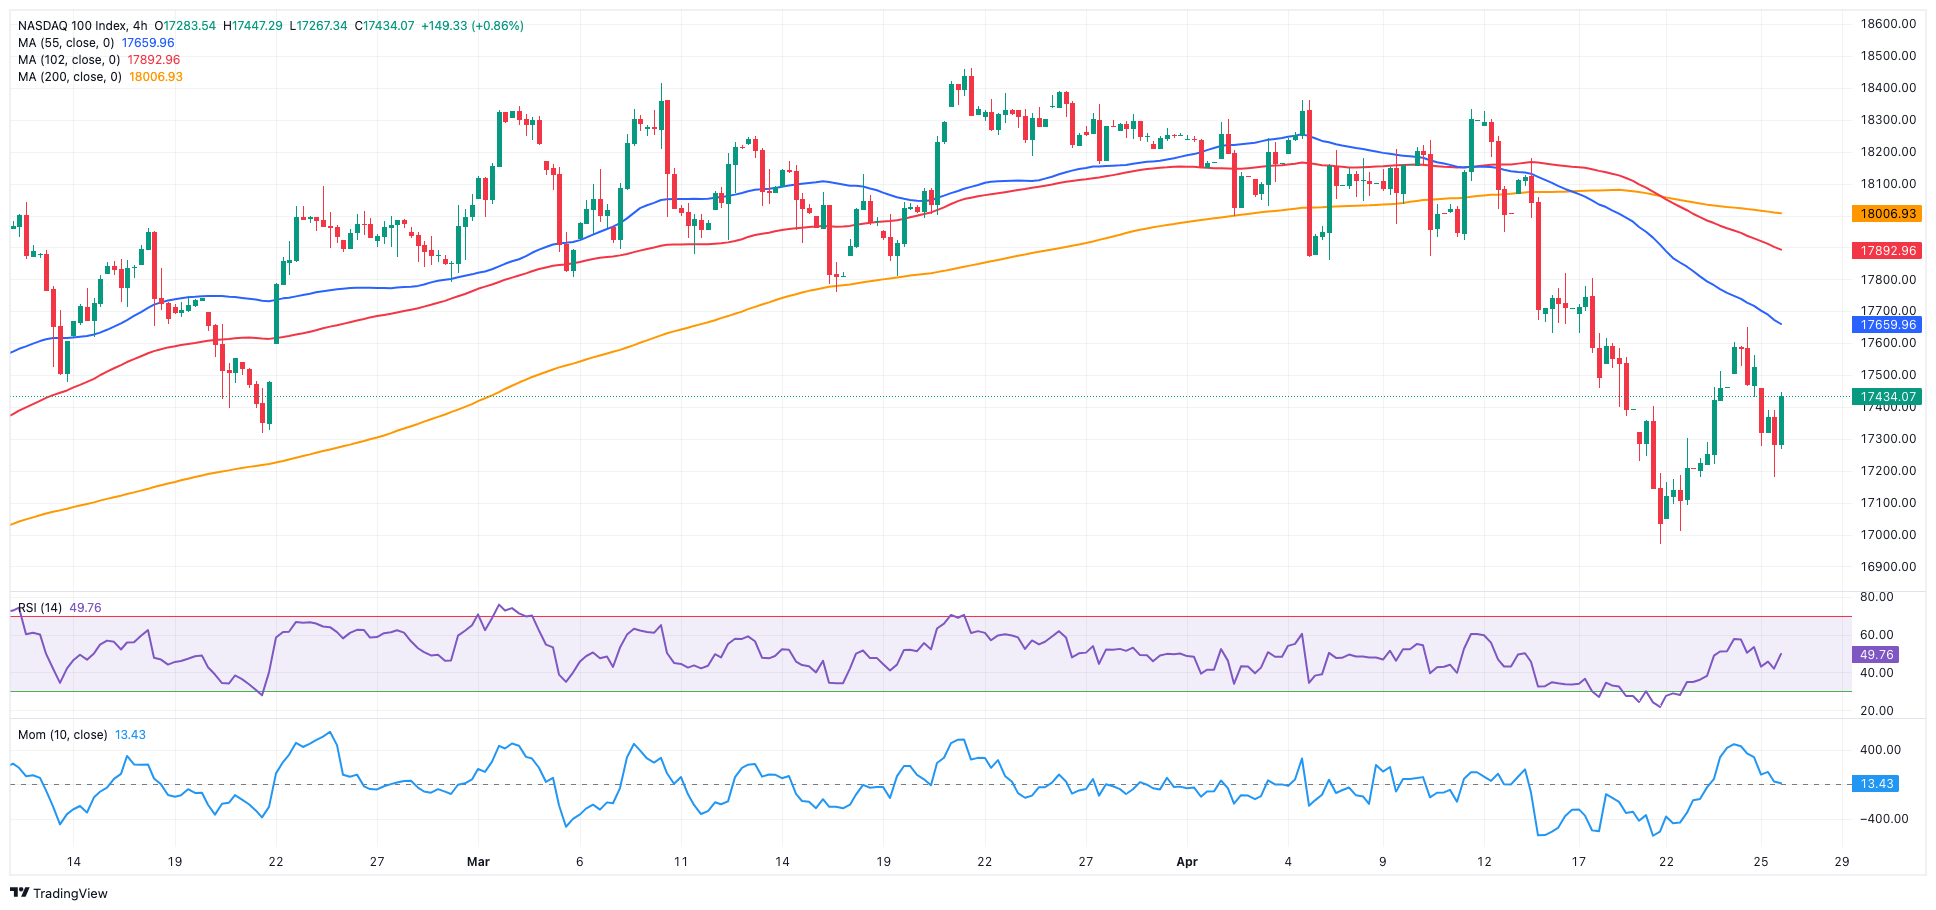
On Thursday, the US tech sector came under renewed downside pressure and motivated the Nasdaq 100 to give away part of the recent three-day advance.
In fact, stocks experienced a decline, primarily driven by a drop in most megacap companies following Meta Platforms' disappointing quarterly earnings report, while traders’ mood was also negatively affected by ongoing signs of inflation and diminishing expectations of the Fed implementing monetary policy easing in the near future.
Extra downside pressure also stemmed from negative price action in Alphabet, Amazon.com, and Microsoft, along with higher US yields across the curve.
Extra gains in the Nasdaq need to clear the weekly high of 17,653 (April 24) ahead of the interim 55-day SMA of 17,927. Further up aligns the all-time high of 18,464 (March 21. Just the opposite, the April low of 16,973 (April 19) is expected to provide initial contention prior to the key 200-day SMA of 16,313 and the 2024 bottom of 16,249 (January 5). Additional losses may put the December 2023 low of 15,695 (December 4) to the test, followed by the October 2023 bottom of 14,058 (October 26) and the April 2023 low of 12,724 (April 25), all before the March 2023 low of 11,695 (March 13). The everyday RSI retreated below 42.
Top Gainers: AstraZeneca ADR, Keurig Dr Pepper, NVIDIA
Top Losers: Meta Platforms, Comcast, Sirius XM
Resistance levels: 17,653 18,337 18,464 (4H chart)
Support levels: 16,973 16,249 15,695 (4H chart)
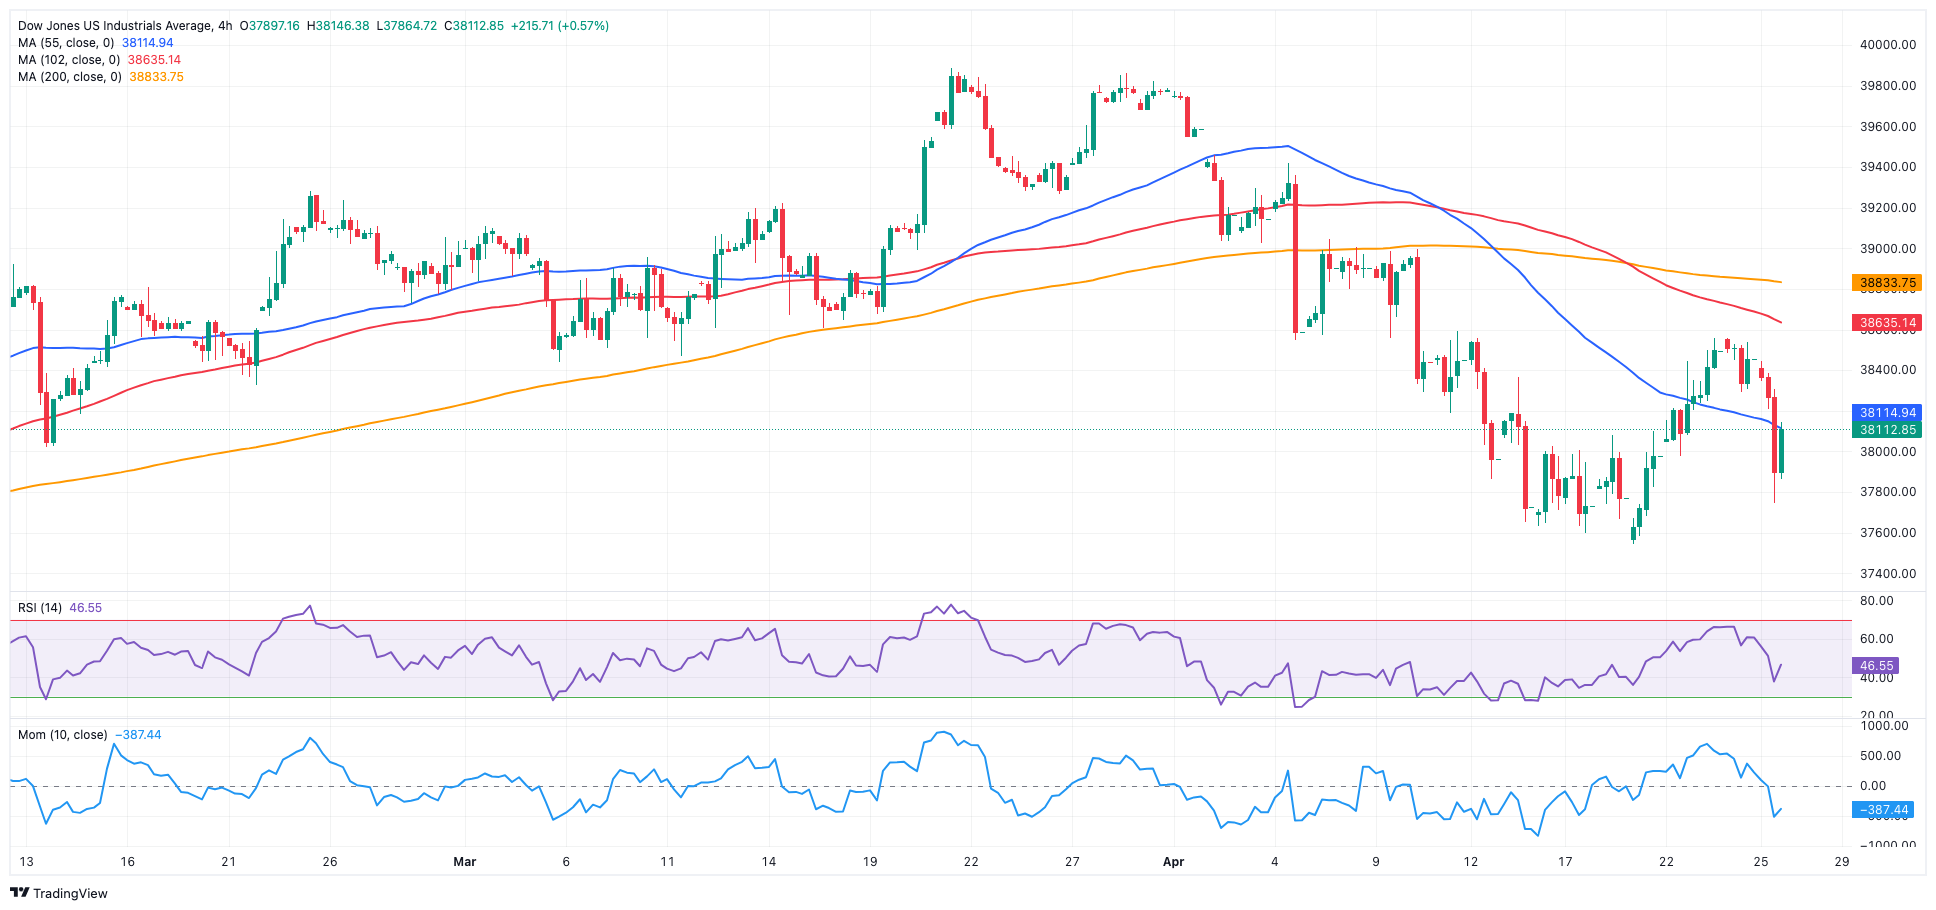
DOW JONES
US equities remained on the defensive and forced the Dow Jones to add to Wednesday’s pullback and recede to five-day lows around 37,750 on Thursday.
The convergence of disappointing earnings and unfavourable economic data, particularly concerning inflation, weighed further on investors’ sentiment. That said, the pace of US economic expansion decelerated beyond initial projections in the first quarter, while a surge in inflation indicated that the Fed would likely refrain from lowering interest rates until September (or later).
On Thursday, the Dow Jones dropped 0.93% to 38,100, the S&P 500 retreated 0.54% to 5,044, and the tech-benchmark Nasdaq Composite deflated 1.21% to 15,524.
Additional losses in the Dow Jones should test the April low of 37,611 (April 17), which precedes the 2024 bottom of 37,122 (January 18) and the important 200-day SMA of 36,301. South from here emerges the weekly low of 33,859 (November 7, 2023) ahead of the October 2023 low of 32,327 (October 27) and the 2023 bottom of 31,429 (March 15). On the upside, initial resistance comes at the provisional 55-day SMA of 38,779 before the record top of 39,889 (March 21). The daily RSI dropped to the sub-43 region.
Top Performers: Merck&Co, UnitedHealth, Intel
Worst Performers: IBM, Caterpillar, Microsoft
Resistance levels: 38,561 39,421 39,889 (4H chart)
Support levels: 37,611 37,122 36,010 (4H chart)
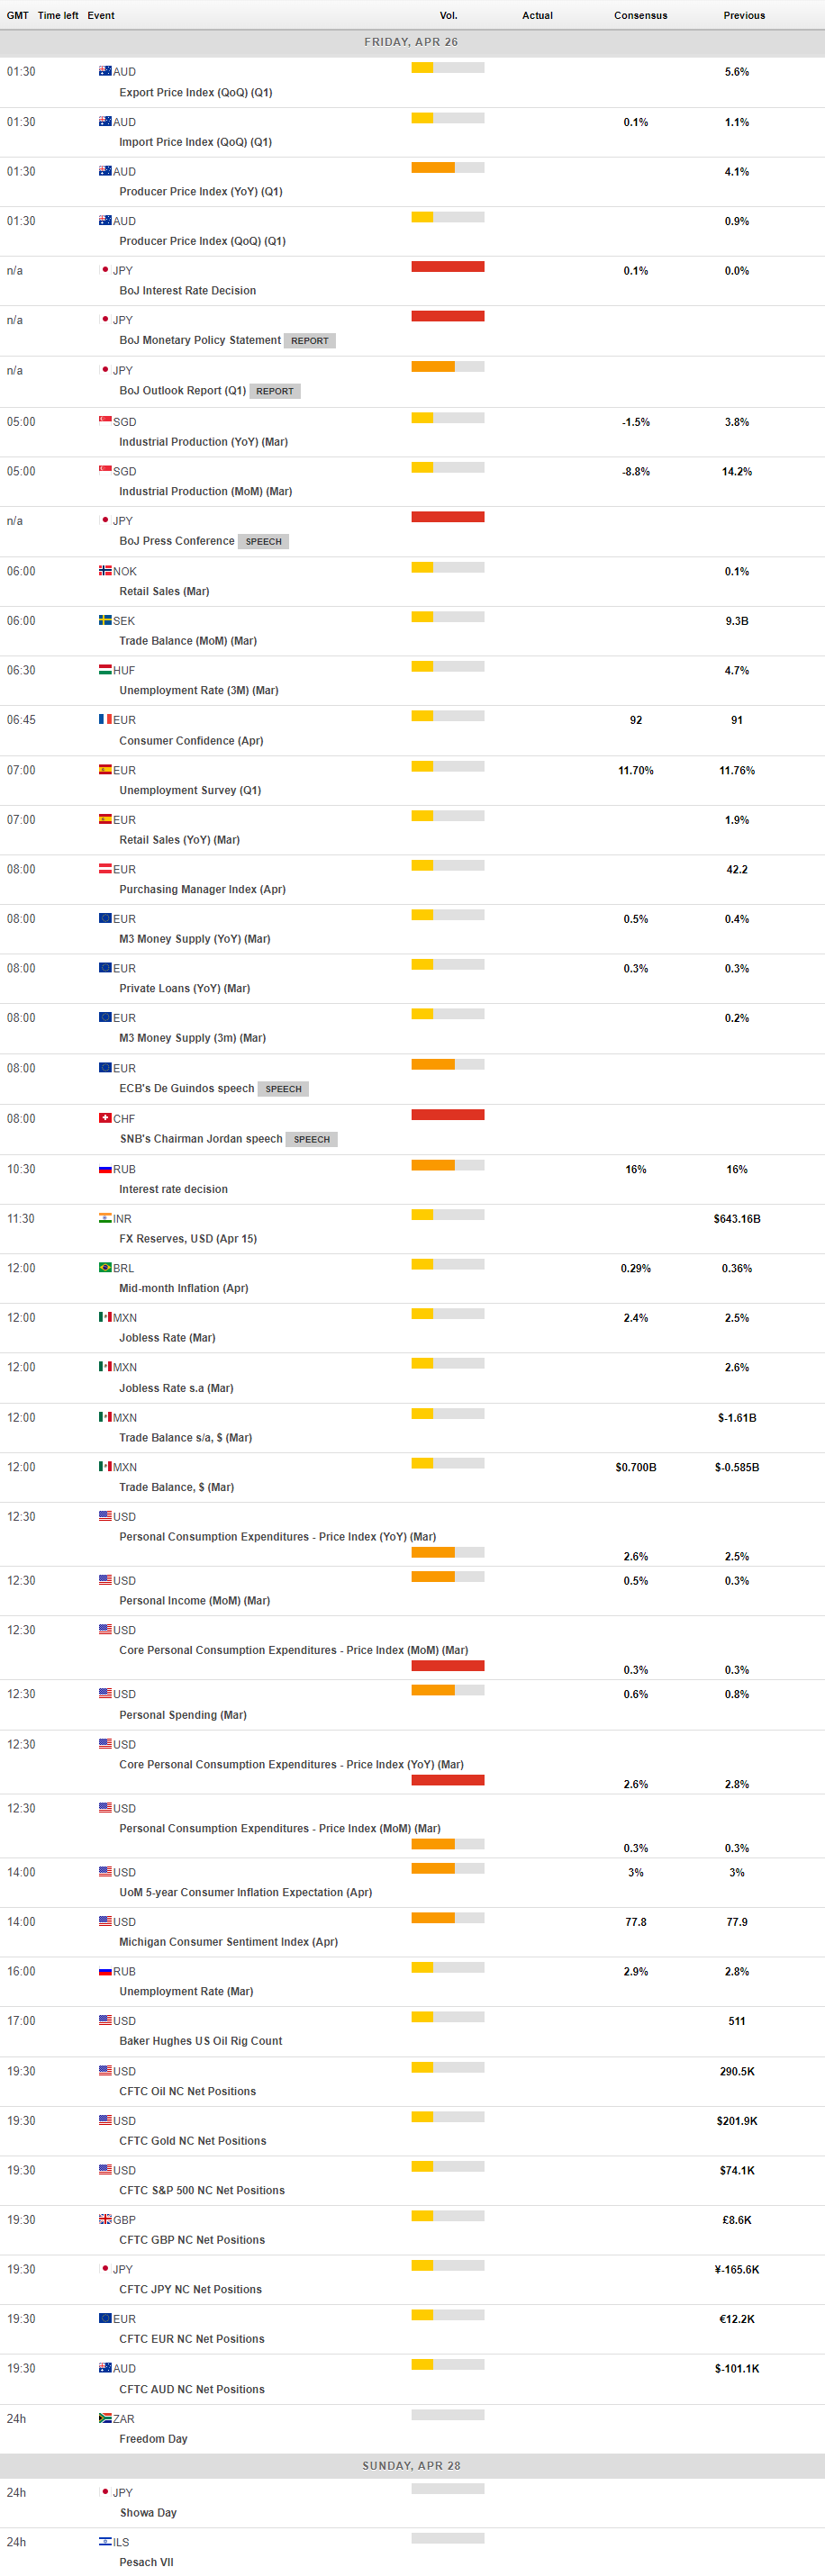
MACROECONOMIC EVENTS
All Information & Updates provided by:

All information relating to the financial markets available on this page has been prepared and issued by FXStreet (Forexstreet SL, Spain, Reg: B62498233) on the basis of publicly available information and all information believed to be reliable and does not conflict with Kuwaiti local laws, and all necessary care has been taken to before the company to ensure that the facts mentioned are correct from the source.
NCM Investment nor any of its directors or employees shall in any way be held responsible for the contents of this news, and the information contained on this page is intended only to provide clients with publicly available information and should not be construed as investment advice, report or analysis and/or constitute an offer or invitation to buy or sell financial instruments of any kind.
RISK WARNING: Forex and CFDs are highly risky leveraged products, as losses can exceed deposits. Please ensure you understand all the risks and take independent advice if necessary. NCM will segregate the clients based on the criteria of the regulator and its bylaws. NCM does not provide any advisory service; the material published does not constitute advice or a recommendation for a transaction in any financial instrument. NCM accepts no responsibility for any use of the content presented and any consequences of that use. Anyone acting on the information provided does so at their own risk.