
- Contact Us:
-

-

-

-


Daily Market Updates
18 Jul 2022
EURUSD
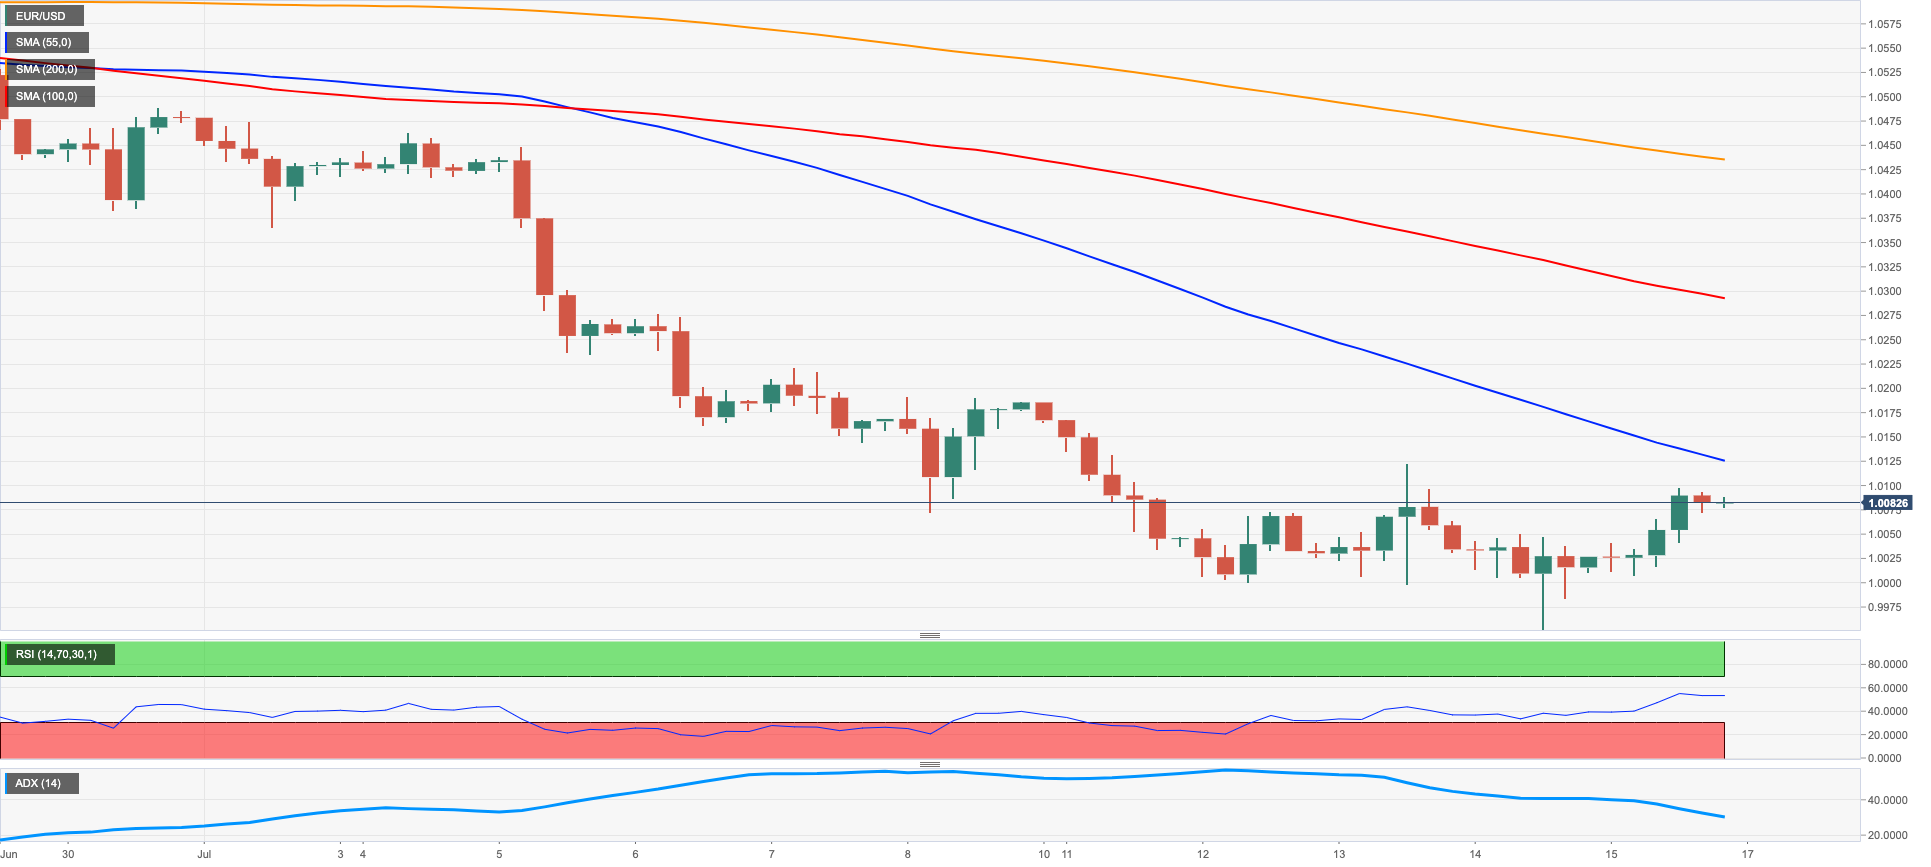
Following Thursday’s pullback to new cycle lows in the 0.9950 region, EUR/USD charted strong gains amidst a technical rebound and the offered bias in the greenback at the end of the week.
It is worth noting that the US Dollar Index (DXY) also recorded fresh peaks north of the 109.00 yardstick for the first time since September 2002 on Thursday and ended Friday’s session just below 108.00 the figure.
The move higher in the pair came amidst the continuation of the downside bias in yields on both sides of the Atlantic, all against the backdrop of a moderate improvement in the appetite for riskier assets.
From the Fed’s backyard, San Francisco Fed M.Daly suggested rates could climb to the 3% area, while she noted some evidence that inflation is decreasing and talked down the possibility of a recession.
In the domestic calendar, EMU’s Balance of Trade showed a €26.3B deficit in May. Across the pond, headline Retail Sales expanded 1.0% MoM in June, while Industrial Production contracted 0.2% MoM in the same period. In addition, the NY Empire State Manufacturing Index leapt to 11.1 in July and the advanced Consumer Sentiment is seen at 51.1 in July (from 50.0). Finally, Business Inventories expanded at a monthly 1.4% in May.
EUR/USD remains under pressure and further decline keeps targeting the 2022 low at 0.9952 (July 14). The loss of this level should open the door to the December 2002 low at 0.9859 before the October 2002 low at 0.9685. In the opposite direction, there are no hurdles of note until the 55-day SMA at 1.0490, which also precedes the 5-month resistance line around 1.0545. Beyond this zone, the pair could see its selling pressure alleviated and attempt a move to the weekly high at 1.0615 (June 27) ahead of the June top at 1.0773 (June 9) and the May peak at 1.0786 (May 30). The daily RSI approaches 33 and leaves behind the oversold territory.
Resistance levels: 1.0097 1.0121 1.0221 (4H chart)
Support levels: 0.9952 0.9859 0.9685 (4H chart)
USDJPY
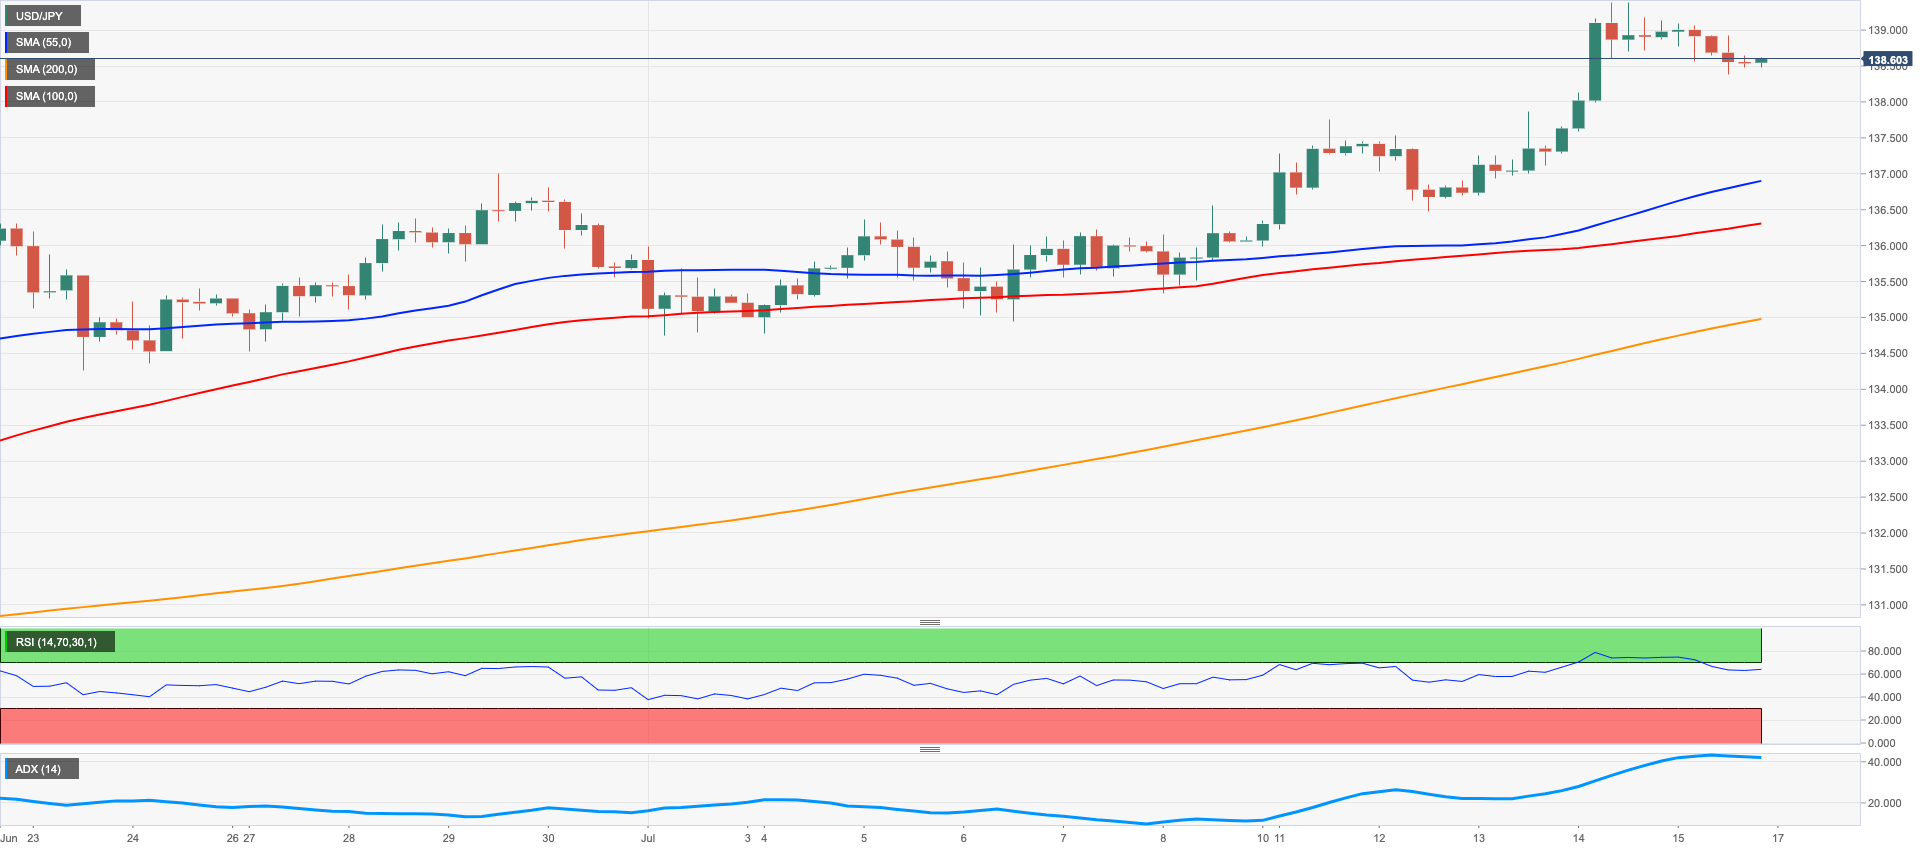
USD/JPY traded on the defensive after two consecutive daily pullbacks, coming under some selling pressure after hitting new cycle tops past the 139.00 mark on Thursday for the first time since September 1998.
The renewed offered stance in the dollar – deemed as a technical correction following overbought levels – coupled with the lack of traction in US yields, collaborated with the bearish performance of the pair at the end of the week.
Despite Friday’s correction, the pair clinched its seventh week in a row with gains, always sustained by the Fed’s aggressive plans to normalize its monetary conditions in the current environment of (very) elevated inflation.
In Japan, the Tertiary Industry Index expanded at a monthly 0.8% in May.
The bullish bias in USD/JPY remains well in place. That said, the 2022 peak at 139.38 (July 13) emerges as the immediate hurdle seconded by the round level at 140.00. The breakout of this level exposes the weekly top at 145.41 (August 21 1998) before the all-time high at 147.67 (August 11 1998). Immediately to the downside appears the July low at 134.74 (July 1) ahead of the 134.26 level (June 23 low). If the pair breaks below the latter it could prompt losses to accelerate further and revisit the 55-day SMA at 132.49 ahead of the weekly low at 131.49 (June 16) and the psychological 130.00 mark. The daily RSI confirmed the recent top and breaches the 68 level.
Resistance levels: 139.38 144.26 145.24 (4H chart)
Support levels: 138.38 136.47 135.32 4H chart)
GBPUSD
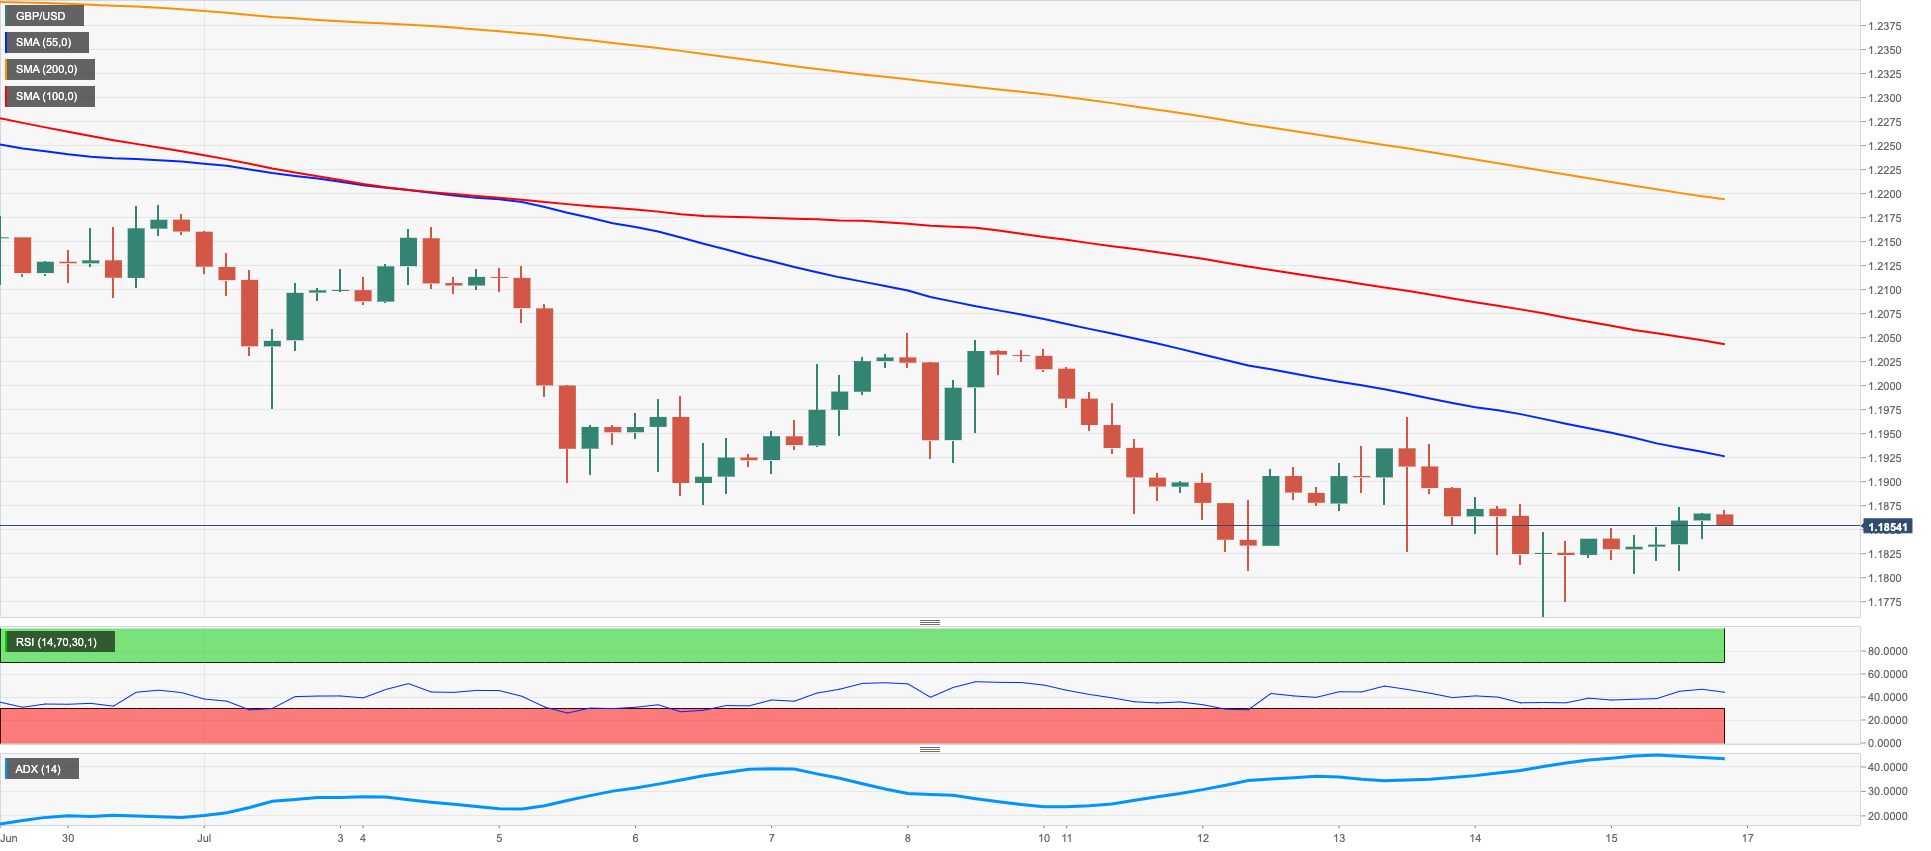
Following the rest of the risk complex, GBP/USD recorded decent gains and closed the session in daily highs near 1.1870 on Friday.
The corrective downside in the greenback lent much-needed oxygen to the quid and its risky peers, leaving behind, albeit partially, recent yearly lows in the 1.1760 zone (July 14), an area last visited back in the onset of the coronavirus pandemic in late March 2020.
In the UK money markets, the 10y Gilt yields ended with marginal gains and added to Thursday’s pullback, contrasting with cash markets in the US and Euroland.
Nothing scheduled in the UK calendar on Friday left all the attention to the publication of the UK labour market report on July 19.
Further downside in cable is expected to initially meet the 2022 low at 1.1759 (July 14). The loss of this level should see the next support of relevance at the 2020 low at 1.1409 (March 20). On the upside, the immediate up barrier comes at the 1.2056 level (July 8 high) ahead of the weekly peak at 1.2332 (June 27). Further north aligns another weekly top at 1.2405 (June 16) prior to the May high at 1.2666 (May 27). In case the recovery gets more serious, then bulls should look at a visit to the psychological 1.3000 mark next. The daily RSI regains composure and flirts with the 35 level.
Resistance levels: 1.1874 1.1966 1.2056 (4H chart)
Support levels: 1.1759 1.1638 1.1445 (4H chart)
AUDUSD
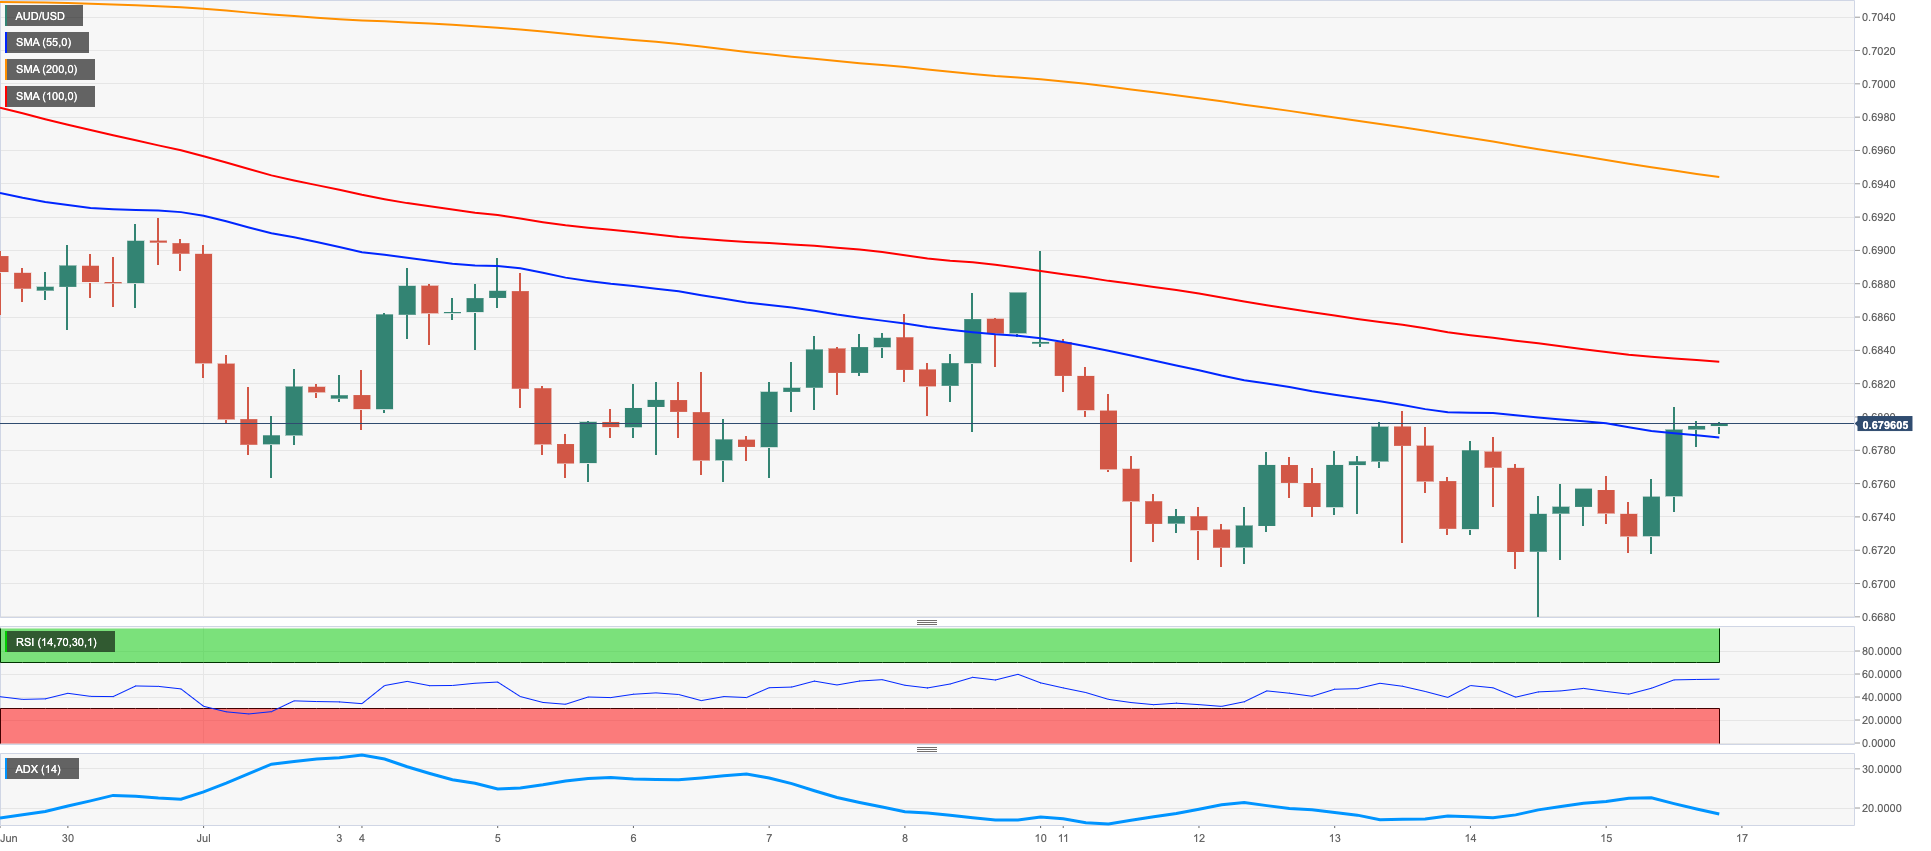
AUD/USD rose to multi-day highs just above the key 0.6800 mark on Friday, although bulls failed to consolidate that move and gave away some of those gains eventually.
Renewed weakness around the greenback allowed the risk-linked galaxy to regain the smile and also motivated the Aussie dollar to leave behind the poor results from the Chinese docket published during the Asian trading hours.
Small gains in the commodity space also lent wings to AUD, with prices of iron ore managing to reverse two daily retracements in a row and chart decent gains near $105.00 per tonne.
There were no data releases in Oz on Friday, while RBA Governor P.Lowe is expected to speak at the beginning of the week ahead of the RBA Minutes on July 19.
In case sellers regain the initiative around AUD/USD, the next area of contention comes at the 2022 low at 0.6681 (July 14). The breach of this level should meet the next support not before the May 2020 low at 0.6372 (May 4) ahead of the weekly low at 0.6253 (April 21 2020). On the flip side, bulls should target the 0.6874 level (July 8 top) prior to the weekly high at 0.6903 (June 28). Further upside could see the interim 55-day SMA at 0.6987 revisited just before the psychological mark at 0.7000. Extra gains are predicted to test another weekly peak at 0.7069 prior to the 100-day SMA at 0.7157 and the key 200-day SMA at 0.7197. The daily RSI bounces to the boundaries of 42.
Resistance levels: 0.6803 0.6874 0.6894 (4H chart)
Support levels: 0.6682 0.6618 0.6567 (4H chart)\
GOLD
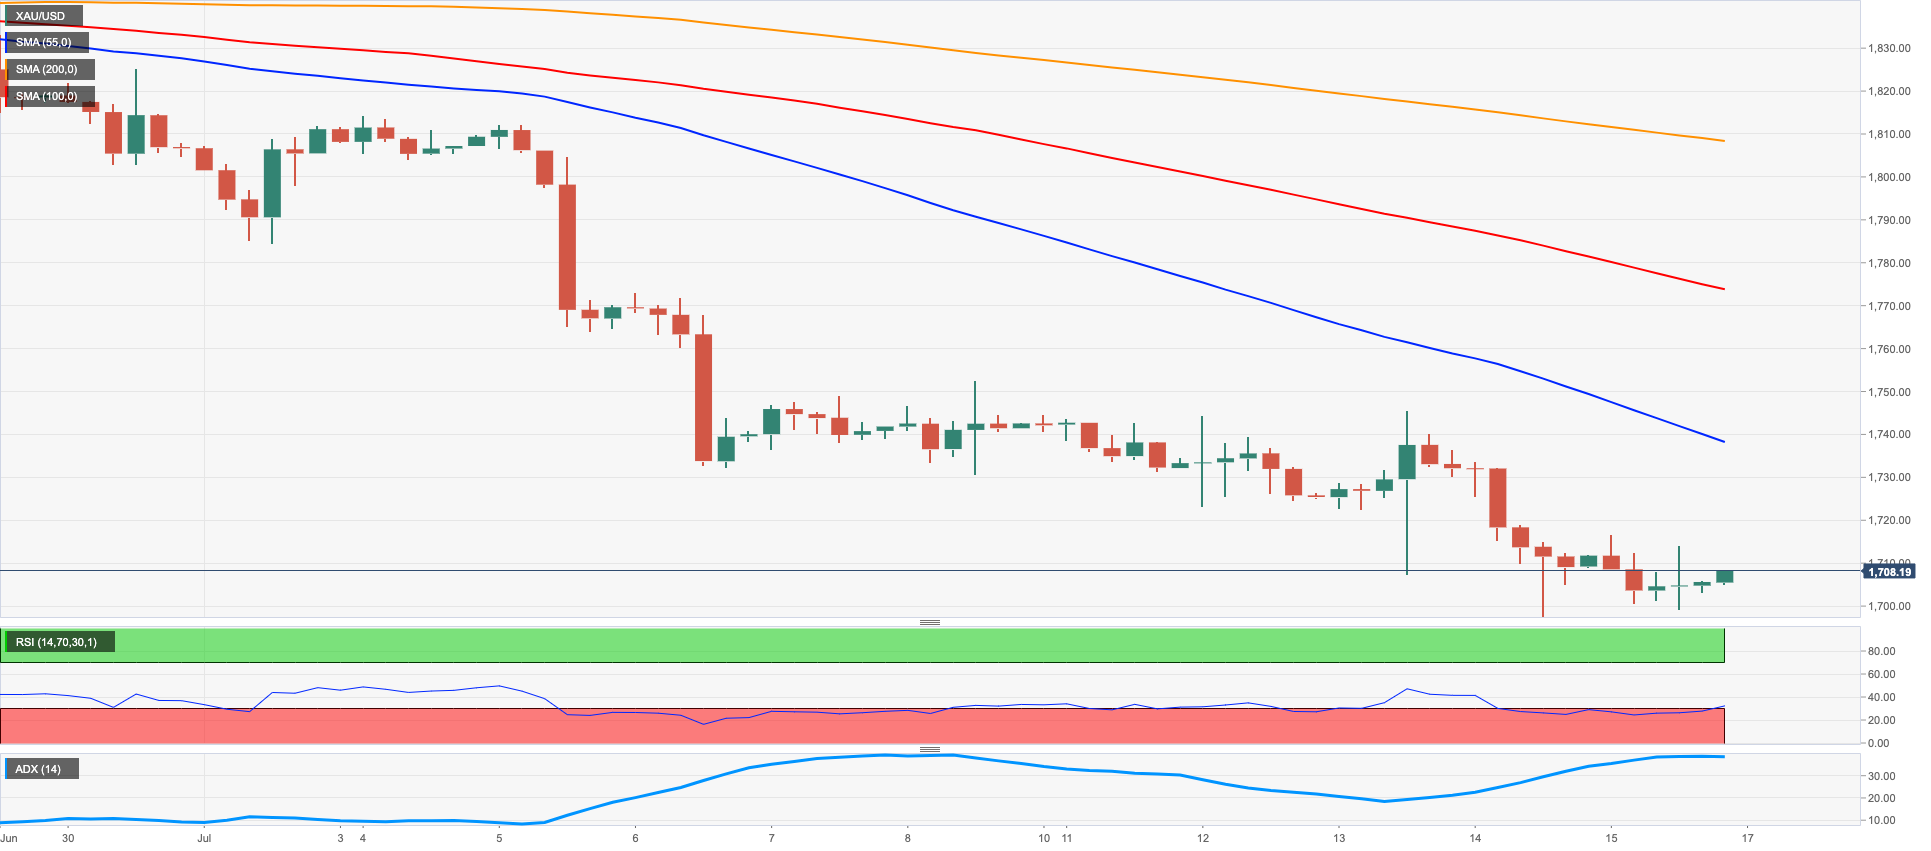
Gold prices added to the pessimism seen at the beginning of the week and ended Friday’s session with modest losses just above the key $1,700 mark per ounce troy. Furthermore, bullion closed with gains only on Wednesday and in the wake of the publication of US inflation figures for the month of June.
The precious metal remained on the defensive despite the offered stance in the greenback and the poor performance of US yields across the curve. Additionally, gold prices closed the fifth consecutive week in the negative territory, as the demand for the non-yielding metal remained depressed amidst rising speculation of a tighter Fed’s rate path in its battle against inflation.
A sustained breach of the $1,700 mark is predicted to open the door to a visit to the 2021 low at $1,1676 (March 8) prior to the June 2020 low at $1,670 (June 5). On the other hand, bulls should meet the initial hurdle at the $1,752 level (July 8 high), which precedes the key $1,800 mark as well as the 55-day SMA at $1,823. The breakout of the latter could lead up to a test of the 200-day SMA at $1,844 before $1,857 (June 16 top) and the June high at $1,879 (June 13).
Resistance levels: $1,745 $1,752 1,772 (4H chart)
Support levels: $1,697 $1,677 $1,661 (4H chart)
CRUDE WTI
Prices of the American reference for the sweet light crude oil edged higher for the third session in a row on Friday, although they failed to revisit the key $100.00 mark per barrel and charted the second consecutive week with losses.
Daily gains in crude oil came on the back of somewhat easing concerns over a probable US recession after Fed’s rate setters defended a 75 bps rate hike instead of a full point raise, which was largely supported soon after the release of US inflation figures for the month of June.
Supporting prices also emerged the view that there won’t be any immediate increase in the oil output following President Biden’s meeting with Saudi Arabia’s Mohammed bin Salman. On the other hand, Libya reopened all its oil fields, leaving behind the recent turmoil and force majeure measures.
In the meantime, and looking at the more macro scenario, traders continued to gauge the unabated tight supply conditions against recession fears and demand concerns.
In the docket, driller Baker Hughes said US oil rig count rose by 2 in the week to July 15, taking the total US active oil rigs to 599.
Further recovery in WTI continues to target the $105.21 level (July 8 high) prior to the weekly top at $111.51 (July 5) and another weekly peak at $114.00 (June 29). Further north aligns the June high at $123.66 (June 14) ahead of the 2022 top at $129.42 (March 8) and the all-time peak at $147.27 (July 11 2008). The resumption of the bearish sentiment could force prices to revisit the 200-day SMA at $94.17 ahead of the July low at $90.58 (July 14). If prices clear this level, then a test of 81.94 (low January 24) could return to the radar before the 2022 low at $74.30 (January 3).
Resistance levels: $99.01 $104.54 $105.21 (4H chart)
Support levels: $90.54 $90.05 $89.00 (4H chart)

DOW JONES
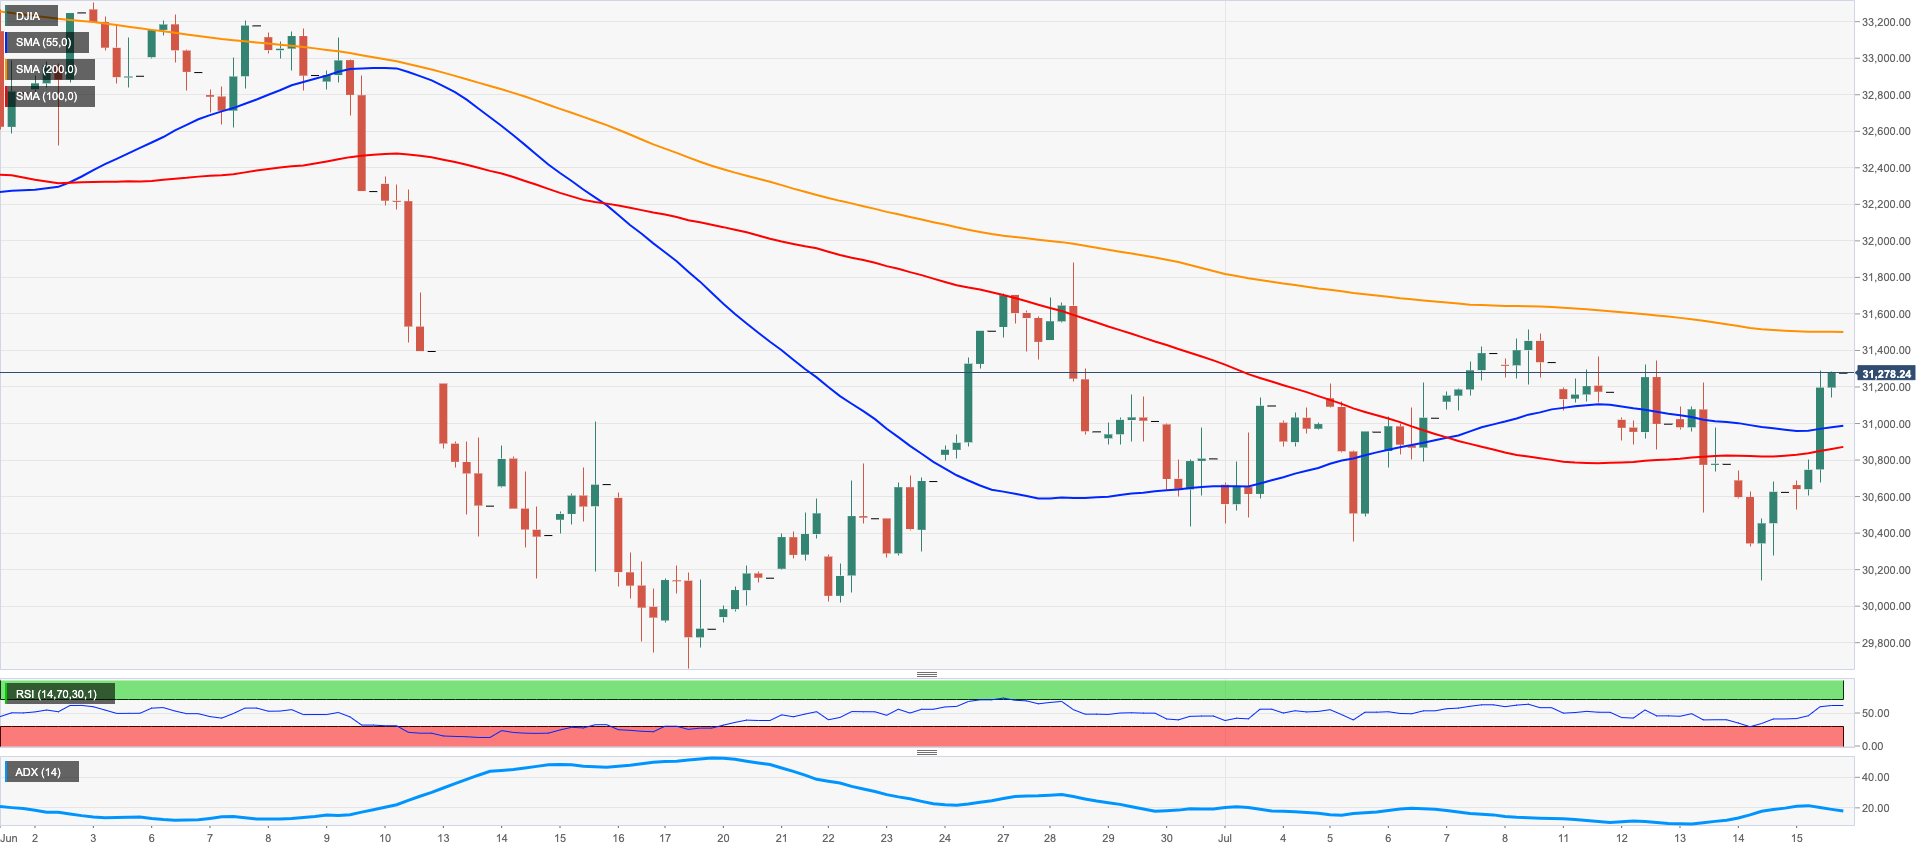
Finally, some much-needed relief for US equities came on Friday, as renewed optimism lifted spirits among traders and motivated all three major stock indices to end the week on a positive note.
Indeed, the Dow Jones advanced 2.15% at 31,288, the S&P500 gained 1.92% at 3,863 and the tech-heavy Nasdaq Composite rose 1.79% at 11,452.
The banking sector led the way up on Friday following better-than-expected results from Citigroup, while diminishing bets for a full-point rate hike by the Federal Reserve also underpinned the recovery in stocks following five consecutive daily retracements.
Also on the positive side of the sentiment, inflation expectations retreated in June according to the U-Mich index, reinforcing the perception that inflation is not becoming entrenched.
The continuation of the ongoing rebound should meet the next hurdle of note at the July high at $31,511 (July 8) prior to the weekly top at 31,885 (June 28). The proximity of the 55-day SMA at 31,840 reinforces the latter. Up from here appears the 100-day SMA at 32,879 before the June peak at 33,272 (June 1) and the May high at 34,117 (May 4). On the flip side, bears expect to retest the July low at 30,143 (July 14), which precedes the 2022 low at 29,653 (June 17) and the 28,902 level (low November 12 2020). Below the latter emerges the October 2020 low at 26,143 (October 30). The RSI bounces to 50 in response to the healthy rebound in the index.
Top Performers: UnitedHealth, JPMorgan, American Express
Worst Performers: Procter&Gamble, Travelers, Boeing
Resistance levels: 31,511 31,885 33,272 (4H chart)
Support levels: 30,143 29,653 29,228 (4H chart)
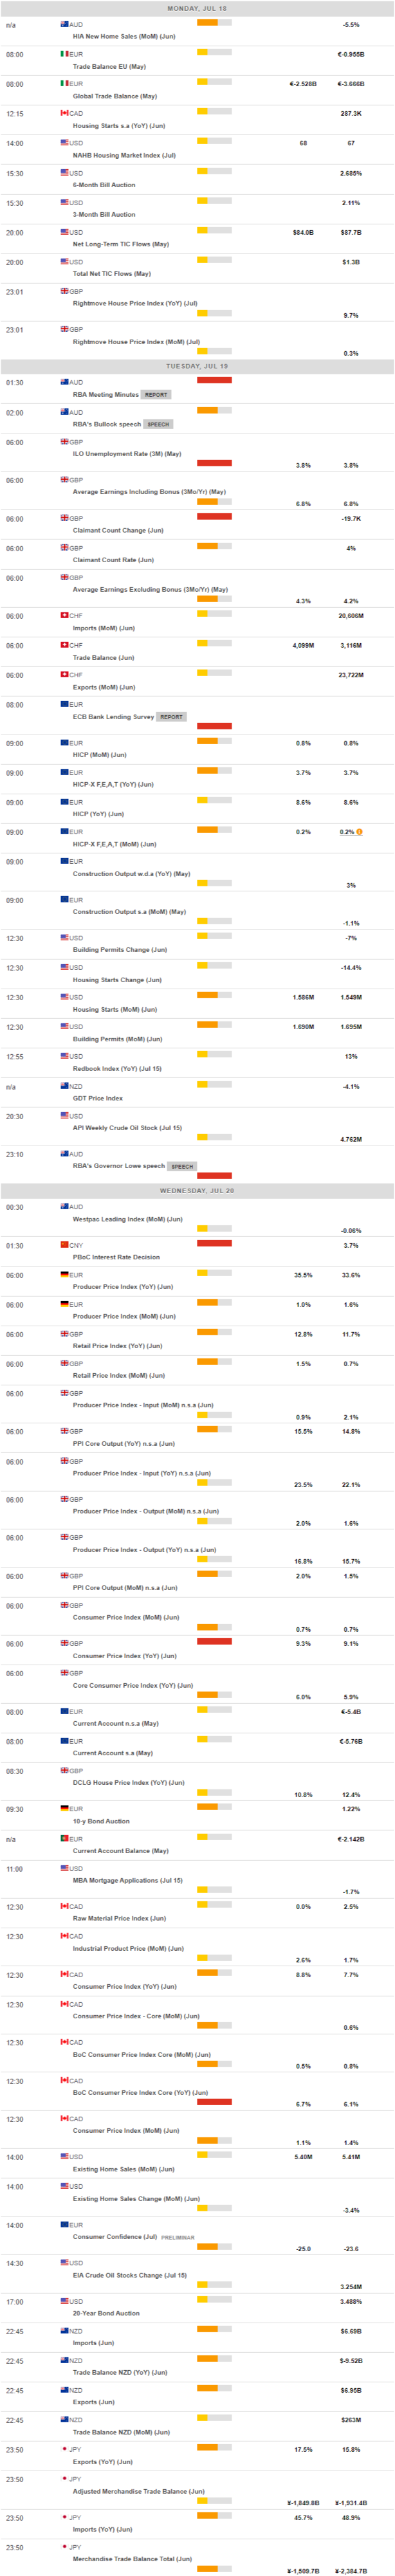
MACROECONOMIC EVENTS
All Information & Updates provided by:

All information relating to the financial markets available on this page has been prepared and issued by FXStreet (Forexstreet SL, Spain, Reg: B62498233) on the basis of publicly available information and all information believed to be reliable and does not conflict with Kuwaiti local laws, and all necessary care has been taken to before the company to ensure that the facts mentioned are correct from the source.
NCM Investment nor any of its directors or employees shall in any way be held responsible for the contents of this news, and the information contained on this page is intended only to provide clients with publicly available information and should not be construed as investment advice, report or analysis and/or constitute an offer or invitation to buy or sell financial instruments of any kind.
RISK WARNING: Forex and CFDs are highly risky leveraged products, as losses can exceed deposits. Please ensure you understand all the risks and take independent advice if necessary. NCM will segregate the clients based on the criteria of the regulator and its bylaws. NCM does not provide any advisory service; the material published does not constitute advice or a recommendation for a transaction in any financial instrument. NCM accepts no responsibility for any use of the content presented and any consequences of that use. Anyone acting on the information provided does so at their own risk.