
- Contact Us:
-

-

-

-


Daily Market Updates
19 Jul 2022
EURUSD
In quite an uneventful session, EUR/USD continued to gather upside traction and extended the rebound for the second session in a row at the beginning of the week, this time briefly reclaiming the area above the 1.0200 mark on the back of the renewed downside pressure in the greenback.
Indeed, the buck started the week on the negative foot and extended further the drop from last week’s cycle peaks past the 109.00 mark (July 14), as investors have practically priced in a 75 bps rate hike at the next FOMC event on July 27 (instead of a full point increase), while the perception that US inflation might start to lose traction in the medium term added to the generalized upbeat tone among traders.
Nothing to write home about in the domestic calendar, whereas the US calendar saw the NAHB Index tumble to 55 in July (from 67).
Still a long way to go, but extra recovery in EUR/USD is predicted to meet the next hurdle at the 55-day SMA at 1.0483, just ahead of the 5-month resistance line near 1.0530. Above the latter, the downside pressure is forecast to mitigate and allow the pair to attempt a move to the weekly peak at 1.0615 (June 27) prior to the June high at 1.0773 (June 9) and the May top at 1.0786 (May 30). On the downside, the immediate contention appears at the parity level ahead of the 2022 low at 0.9952 (July 14). South from here turns up the December 2002 low at 0.9859 seconded by the October 2002 low at 0.9685. The daily RSI rebounds further to 37, accompanying the moderate bounce in spot.
Resistance levels: 1.0201 1.0221 1.0276 (4H chart)
Support levels: 1.0081 1.0006 0.9952 (4H chart)
-637937666781184500.png)
USDJPY
The renewed offered stance in the US dollar motivated USD/JPY to shed ground for the second session in a row and probe the area below the 138.00 mark at the beginning of the week.
The move lower in the pair came despite the persevering appetite for the riskier assets and the rebound in US yields across the curve.
Nothing scheduled in the Japanese calendar on Monday. The next event of note will be the BoJ interest rate decision, due on Thursday.
Immediately to the upside in USD/JPY appears the 2022 high at 139.38 (July 13) ahead of the round level at 140.00. The surpass of the latter should open the door to the weekly peak at 145.41 (August 21 1998) ahead of the all-time top at 147.67 (August 11 1998). Bears, in the meantime, target the July low at 134.74 (July 1) just before the 134.26 level (June 23 low). Once cleared, the focus of attention should shift to the 55-day SMA at 132.63 prior to the weekly low at 131.49 (June 16) and the psychological 130.00 level. The daily RSI eases to 64 in tandem with the ongoing correction.
Resistance levels: 139.38 144.26 145.24 (4H chart)
Support levels: 138.38 136.47 135.32 4H chart)
-637937667735487476.png)
GBPUSD
In line with the broad-based upbeat mood surrounding the risk-linked galaxy, GBP/USD added to Friday’s advance and surpassed the key barrier at 1.2000 the figure on Monday.
Indeed, sellers continued to hurt the greenback and forced the US Dollar Index (DXY) to give away further ground following last week’s new tops past the 109.00 yardstick, an area last traded back in October 2002.
From the BoE, MPC member Saunders hinted at the likelihood that further rate hikes remain in store, while he added that the neutral rate is above 1.0%. Saunders also suggested that large tax reductions could mean higher rates.
There were no data releases in the UK docket, leaving all the attention to Tuesday’s publication of the labour market figures.
If bulls push harder, then GBP/USD is seen testing the interim hurdle at the 55-day SMA at 1.2287 followed by the weekly high at 1.2332 (June 27) and another weekly peak at 1.2405 (June 16). Further gains could see the May top at 1.2666 (May 27) revisited prior to the psychological 1.3000 level. On the downside, the 2022 low at 1.1759 (July 14) should offer interim contention ahead of the 2020 low at 1.1409 (March 20). The daily RSI picks up pace and approaches 43.
Resistance levels: 1.2033 1.2056 1.2165 (4H chart)
Support levels: 1.1759 1.1638 1.1445 (4H chart)
-637937667339036647.png)
AUDUSD
AUD/USD advanced further and clinched new multi-day peaks in the 0.6850/55 band on Monday, putting further distance from last week’s yearly lows in the 0.6680 region (July 14).
Indeed, the high-beta currencies, commodities and the risk complex in general extended the rebound pari passu with the deeper correction in the greenback, which prompted the second daily pullback in the US Dollar Index (DXY).
Further legs to the Aussie dollar came from another uptick in prices of the iron ore, which briefly tested the $107.00 mark per tonne, up for the second consecutive session on Monday.
The Australian docket was empty at the beginning of the week, although Tuesday’s calendar will see the release of the RBA Minutes of the July meeting.
Next on the upside for AUD/USD comes the 0.6874 level (July 8 high) ahead of the weekly peak at 0.6903 (June 28). The breakout of this level could lead up to a test of the temporary 55-day SMA at 0.6983 prior to the psychological mark at 0.7000. Further up is seen another weekly top at 0.7069 before the 100-day SMA at 0.7153 and the key 200-day SMA at 0.7195. The immediate down barrier aligns at the 2022 low at 0.6681 (July 14) prior to the May 2020 low at 0.6372 (May 4) and the weekly low at 0.6253 (April 21 2020). The daily RSI extends the rebound to the 46 area.
Resistance levels: 0.6854 0.6874 0.6894 (4H chart)
Support levels: 0.6718 0.6681 0.6618 (4H chart)
-637937668107294131.png)
GOLD
Prices of the ounce troy of the yellow metal charted modest gains in the $1,710 region at the beginning of the week.
Bullion found the weakness in the greenback a reason to leave behind the two previous negative sessions and advance modestly in a context favourable to the riskier assets and with US yields edging up and partially eroding the recent decline.
The generalized upbeat mood in the precious metals seems to have also underpinned the daily gains in gold.
Gold remains under pressure and the next level to watch remains the $1,700 yardstick. A convincing breach of this level could prompt the precious metal to accelerate losses to the 2021 low at $1,1676 (March 8) ahead of the June 2020 low at $1,670 (June 5). On the flip side, there is a minor up barrier at the $1,752 level (July 8 high) ahead of the key $1,800 mark. Further north turns up the 55-day SMA at $1,820 before the 200-day SMA at $1,844. The breakout of this key area could pave the way for a visit to $1,857 (June 16 top) closely followed by the June peak at $1,879 (June 13).
Resistance levels: $1,711 $1,745 $1,752 (4H chart)
Support levels: $1,708 $1,697 $1,677 (4H chart)
-637937668503811692.png)
CRUDE WTI
The combination of the selling bias in the US dollar and fresh jitters hitting the gas market seem to have been enough for crude oil prices to clinch the fourth consecutive daily advance, this time returning to the area above the $102.00 mark per barrel.
Prices of the WTI gained around $12 from lows near the $90.00 mark on July 14 to Monday’s peaks past $102.00.
Indeed, Russian gas giant Gazprom announced it could not guarantee its supply to, for now, one European customer, although speculation kept running high regarding the complete shutdown of Russian gas to Europe sooner rather than later.
The move by Gazprom fanned the flames of the energy crunch currently hurting the old continent and exacerbated fears of potential restrictions in the region in the next winter.
In case of the continuation of the current rebound, prices of the WTI face the next barrier at the $105.21 level (July 8 top) ahead of the weekly high at $111.51 (July 5) and another weekly peak at $114.00 (June 29). The breakout of the latter exposes a potential climb to the June top at $123.66 (June 14) prior to the 2022 peak at $129.42 (March 8) and the all-time high at $147.27 (July 11 2008). Occasional bearish attempts could retest the 200-day SMA at $94.28 just before the July low at $90.58 (July 14). The loss of this level could lead up to a probable drop to the 81.94 level (low January 24) ahead of the 2022 low at $74.30 (January 3).
Resistance levels: $102.40 $104.54 $105.21 (4H chart)
Support levels: $94.55 $90.54 $90.05 (4H chart)
-637937669284570069.png)
DOW JONES
US equities started the week in an inconclusive mood, as all three major stock indices alternated gains with losses around Friday’s closing levels.
That said, the Dow Jones dropped 0.15% at 31,250, the S&P500 shed 0.14% at 3,858 and the tech benchmark Nasdaq Composite retreated 0.05% at 11,445.
In the meantime, diminishing bets for a full point interest rate hike by the Federal Reserve later in the month remained in the centre of the debate among investors along with speculation that inflation pressures could finally lose traction in the next months.
If the Dow breaks above the July high at 31,644 (July 18) it could then pave the way for a move to the weekly peak at 31,885 (June 28). The 55-day SMA at 31,802 also underpins this level. Further up, the next target comes at the interim 100-day SMA at 32,855 ahead of the June top at 33,272 (June 1) and the May high at 34,117 (May 4). On the other hand, the July low at 30,143 (July 14) is expected to hold the initial test prior to the 2022 low at 29,653 (June 17) and the 28,902 level (low November 12 2020). The breakdown of this level could open the door to a deeper decline to the October 2020 low at 26,143 (October 30). The RSI hovers around the 50 region.
Top Performers: Dow, Salesforce.com, Chevron
Worst Performers: Merck&Co, J&J, Apple
Resistance levels: 31,644 31,885 33,272 (4H chart)
Support levels: 30,143 29,653 29,228 (4H chart)
-637937669659649649.png)
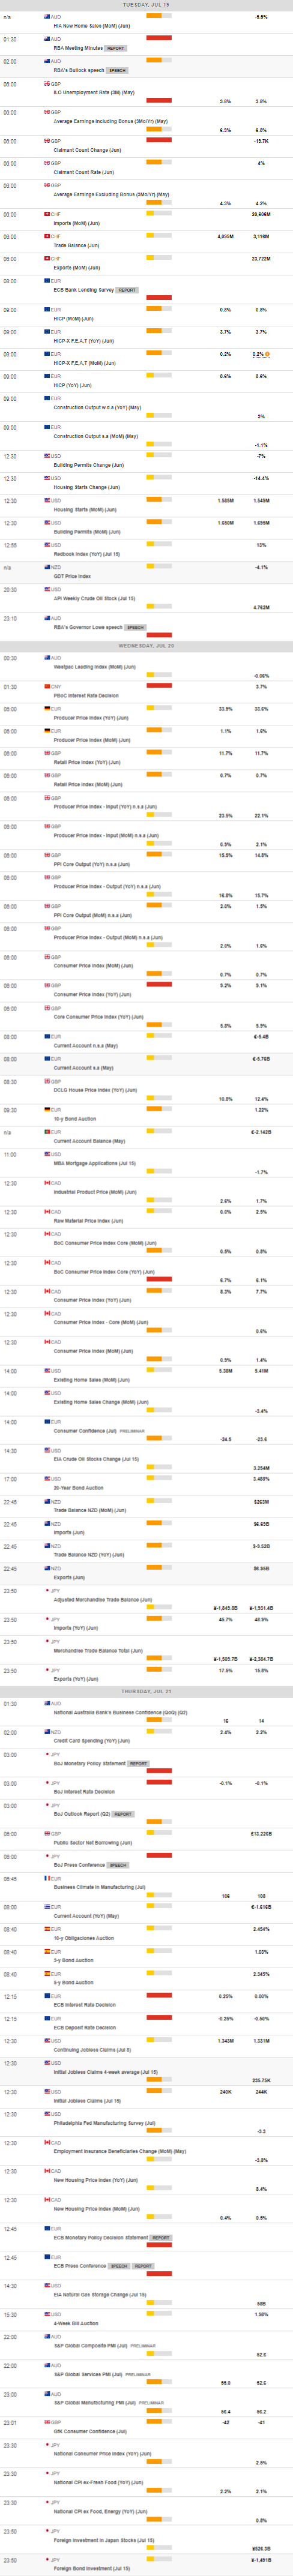
MACROECONOMIC EVENTS
All Information & Updates provided by:

All information relating to the financial markets available on this page has been prepared and issued by FXStreet (Forexstreet SL, Spain, Reg: B62498233) on the basis of publicly available information and all information believed to be reliable and does not conflict with Kuwaiti local laws, and all necessary care has been taken to before the company to ensure that the facts mentioned are correct from the source.
NCM Investment nor any of its directors or employees shall in any way be held responsible for the contents of this news, and the information contained on this page is intended only to provide clients with publicly available information and should not be construed as investment advice, report or analysis and/or constitute an offer or invitation to buy or sell financial instruments of any kind.
RISK WARNING: Forex and CFDs are highly risky leveraged products, as losses can exceed deposits. Please ensure you understand all the risks and take independent advice if necessary. NCM will segregate the clients based on the criteria of the regulator and its bylaws. NCM does not provide any advisory service; the material published does not constitute advice or a recommendation for a transaction in any financial instrument. NCM accepts no responsibility for any use of the content presented and any consequences of that use. Anyone acting on the information provided does so at their own risk.