
- Contact Us:
-

-

-

-


Daily Market Updates
20 Jul 2022
EURUSD
EUR/USD gathered bullish momentum in the early European session on Tuesday and surged beyond 1.2000. With the dollar selloff picking up steam, the pair extended its rally to a fresh 13-day high above at around 1.0270 before settling below 1.0250.
Citing sources familiar with the matter, Reuters reported that European Central Bank (ECB) policymakers were set to discuss a 50 basis points rate hike at the upcoming meeting. This headline helped the shared currency continue to outperform its major rivals. Meanwhile, latest headlines surrounding the Nord Stream 1 gas pipeline suggested that gas flows are expected to resume as planned after the maintenance is completed on Thursday. Major European equity indexes registered impressive daily gains and risk flows provided an additional boost to the euro.
In the second half of the day, the data published by the US Census Bureau revealed that housing starts declined by 2% to a seasonally adjusted annual rate of 1,685,000. Throughout the day, the dollar remained under heavy selling pressure and the US Dollar Index ended up losing nearly 1% on a daily basis.
The near-term technical outlook shows that the pair has turned overbought with the RSI on the four-hour chart rising above 70. The 100-period SMA on the same chart seems to have formed interim resistance at 1.0250 and the fact that buyers failed to flip that level into support points to their hesitancy. Hence, a technical correction could be witnessed before the continuation of the uptrend.
On a broader view, extra recovery in EUR/USD is predicted to meet the next hurdle at the 55-day SMA at 1.0483, just ahead of the 5-month resistance line near 1.0530. Above the latter, the downside pressure is forecast to mitigate and allow the pair to attempt a move to the weekly peak at 1.0615 (June 27) prior to the June high at 1.0773 (June 9) and the May top at 1.0786 (May 30). On the downside, the immediate contention appears at the parity level ahead of the 2022 low at 0.9952 (July 14). South from here turns up the December 2002 low at 0.9859 seconded by the October 2002 low at 0.9685. The daily RSI extended its rebound toward 50.
Resistance levels: 1.0250 1.0300 1.0400 (4H chart)
Support levels: 1.0081 1.0006 0.9952 (4H chart)
-637938531278882892.jpg)
USDJPY
Despite the persistent selling pressure surrounding the dollar, USD/JPY stayed relatively resilient on Tuesday. The risk-positive market environment didn’t allow the JPY to find demand as a safe haven and rising US Treasury bond yields helped the pair limit its losses. Ahead of Thursday’s Bank of Japan (BOJ) policy meeting, investors remain reluctant to bet on JPY gains.
Nevertheless, the pair ended up closing the day with modest losses slightly below 138.00.
Following Tuesday’s subdued action, the near-term technical outlook stays unchanged. Immediately to the upside in USD/JPY appears the 2022 high at 139.38 (July 13) ahead of the round level at 140.00. The surpass of the latter should open the door to the weekly peak at 145.41 (August 21 1998) ahead of the all-time top at 147.67 (August 11 1998). Bears, in the meantime, target the July low at 134.74 (July 1) just before the 134.26 level (June 23 low). Once cleared, the focus of attention should shift to the 55-day SMA at 132.63 prior to the weekly low at 131.49 (June 16) and the psychological 130.00 level. The daily RSI continues to move sideways above 60, showing that the pair remains in a consolidation phase despite remaining bullish.
Resistance levels: 139.38 144.26 145.24 (4H chart)
Support levels: 138.38 136.47 135.32 4H chart)
-637938532088420717.jpg)
GBPUSD
Fueled by hawkish comments from Bank of England Governor (BOE) Bailey and upbeat employment data, GBP/USD broke above 1.2000 and closed the second straight day in positive territory.
The UK’s Office for National Statistics announced that the ILO Unemployent Rate remained unchanged at 3.8% in three months to May. Additionally, the claimant count fell by 20,000 in June.
BOE Governor Bailey acknowledged that a 50 basis points (bps) rate hike will be on the table at the August policy meeting. "If we see signs of greater persistence of inflation, and price and wage setting would be such signs, we will have to act forcefully,” Bailey added. Following these remarks, markets are pricing in a more-than-90% probability of a 50 bps BOE hike next month.
GBP/USD failed to hold above the 100-period SMA on the four-hour chart and the RSI started to edge lower toward 60, suggesting that the pair has gone into a consolidation phase. The 55-day SMA at 1.2287 aligns as a reachable target followed by the weekly high at 1.2332 (June 27) and another weekly peak at 1.2405 (June 16) in case the dollar selloff continue. Further gains could see the May top at 1.2666 (May 27) revisited prior to the psychological 1.3000 level. On the downside, the 2022 low at 1.1759 (July 14) should offer interim contention ahead of the 2020 low at 1.1409 (March 20). The daily RSI continues to rise toward 50, confirming the bullish bias.
Resistance levels: 1.2056 1.2165 1.2200 (4H chart)
Support levels: 1.1759 1.1638 1.1445 (4H chart)
-637938531620867173.jpg)
AUDUSD
AUD/USD gained more than 1% on Tuesday and touched its highest level in nearly three weeks above 0.6900. The pair capitalized on improving market mood and the dollar weakness allowed it to stretch higher in the second half of the day.
The Reserve Bank of Australia’s (RBA) July meeting minutes showed policymakers agreed that further increases in interest rate will be needed to return inflation to the target over time. On the same note, RBA Deputy Governor Michele Bullock reiterated that additional rate hikes will be needed in coming months. Westpac Leading Index will be featured in the Australian economic docket on Wednesday and RBA Governor Philip Lowe will be delivering a speech.
In the meantime, rising iron ore prices on renewed optimism about Chinese government taking further steps to ease the pressure on the real estate market helped the commodity-sensitive AUD to find additional demand.
The 200-period SMA on the four-hour chart forms immediate resistance for AUD/USD at 0.6920. The breakout of this level could lead up to a test of the temporary 55-day SMA at 0.6983 prior to the psychological mark at 0.7000. Further up is seen another weekly top at 0.7069 before the 100-day SMA at 0.7153 and the key 200-day SMA at 0.7195. On the downside, the 100-period SMA aligns as first support at 0.6820 ahead of the static support at 0.6730 and the 2022 low at 0.6681 (July 14). Meanwhile, the daily RSI rose above 50, confirming the bullish tilt.
Resistance levels: 0.6920 0.6983 0.7000 (4H chart)
Support levels: 0.6820 0.6730 0.6681 (4H chart)
-637938532419472027.jpg)
GOLD
Gold fluctuated in a narrow range near $1,710 for the second straight on Tuesday and failed to make a decisive move in either direction. Although the dollar selloff helped XAU/USD find support, surging US Treasury bond yields didn’t allow the pair to gain traction.
On the back of risk flows, the benchmark 10-year US Treasury bond yield reclaimed the critical 3% mark on Tuesday.
Meanwhile, market participants are yet to be convinced about gold’s demand outlook improving. After having confirmed over 1,000 new cases over the weekend, China reported 699 coronavirus cases late Monday, the highest daily tally since May 22. Moreover, The city of Lanzhou ordered a city-wide lockdown from Wednesday and Shanghai widened the mass testing to 12 of the city's 16 districts.
Gold stays within a touching distance of the significant support that aligns at $1,700. A convincing breach of this level could prompt the precious metal to accelerate losses to the 2021 low at $1,1676 (March 8) ahead of the June 2020 low at $1,670 (June 5). On the flip side, there is a minor up barrier at the $1,752 level (July 8 high) ahead of the key $1,800 mark. Further north turns up the 55-day SMA at $1,820 before the 200-day SMA at $1,844. The breakout of this key area could pave the way for a visit to $1,857 (June 16 top) closely followed by the June peak at $1,879 (June 13).
Resistance levels: $1,711 $1,745 $1,752 (4H chart)
Support levels: $1,708 $1,697 $1,677 (4H chart)
-637938532765053727.jpg)
CRUDE WTI
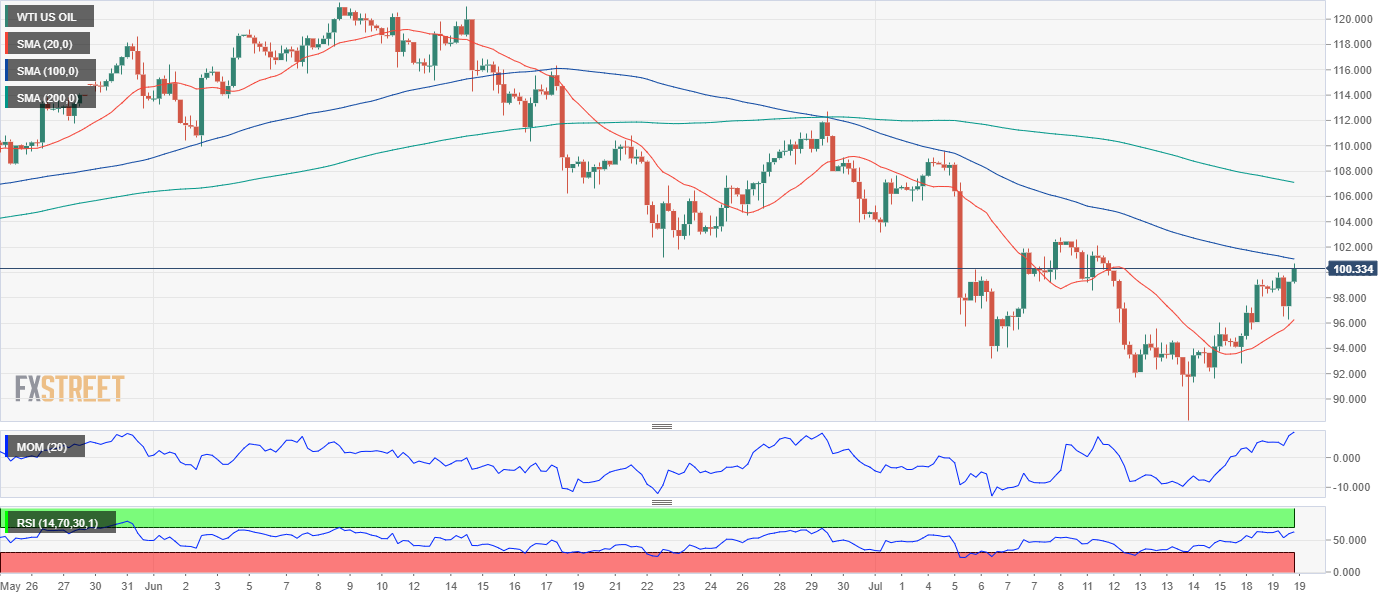
Oil prices declined during the first half of the day amid growing concerns over the global economic slowdown weighing on energy demand. The IMF warned on Tuesday that the economies of the Czech Republic, Hungary, Slovakia and Italy could contract by more than 5% in 2023 in case Russia were to stop supplying gas to Europe.
Despite the gloomy demand outlook, the uncertainty surrounding the supply side dynamics and the sharp decline in the dollar allowed crude oil prices to close the day in positive territory. Officials from Saudi Arabia refrained from committing to ramping up the oil supply despite US President Joe Biden’s visit last week, during which he tried to reach an agreement with Saudi officials on a production boost.
The barrel of West Texas Intermediate (WTI) rose nearly 2% and settled near $104.00.
WTI continues to push higher toward the next barrier at the $105.21 level (July 8 top) ahead of the weekly high at $111.51 (July 5) and another weekly peak at $114.00 (June 29). The breakout of the latter exposes a potential climb to the June top at $123.66 (June 14) prior to the 2022 peak at $129.42 (March 8) and the all-time high at $147.27 (July 11 2008). On the downside, $100 (psychological level) forms first support before the static level that seems to have formed at $97.80 and the 200-day SMA at $94.55. A violation of this last support level could open the door for additional losses toward $90.58 (July 14), $81.94 (low January 24) and finally 2022 low at $74.30 (January 3).
Resistance levels: $104.54 $105.21 $107.60 (4H chart)
Support levels: $100 $97.80 $94.55 (4H chart)
DOW JONES
As hinted by the impressive gains witnessed in major European equity indices, Wall Street’s main indexes opened decisively higher on Tuesday and gained more than 2%.
Investors remain hopeful that the Fed will opt for a 75 bps rate hike at the upcoming meeting following the disappointing data releases and cautious comments from policymkakers late last week. The CME Group’s FedWatch Tool shows that markets are currently pricing a 33% probability of a 100 basis points rate hike in July.
All 11 major sector of the S&P 500 Index advanced sharply with the Consumer Discretionary Index leading the rally with a 3% jump. Ahead of the closing bell, the Dow Jones Industrial Average was up more than 2%, the S&P 500 and the Nasdaq Index were both adding around 2.5% on the day.
With the Dow rising above the July high at 31,644 (July 18), bulls could target the weekly peak at 31,885 (June 28) next ahead of the 100-day SMA at 32,800, the June top at 33,272 (June 1) and the May high at 34,117 (May 4). On the other hand, the 55-day SMA forms immediate support at 31,650 before the July low at 30,143 (July 14). In case the latter support fails, the 2022 low at 29,653 (June 17) comes as next bearish target above the 28,902 level (low November 12 2020). The RSI hovers above the 50 region.
Top Performers: Goldman Sachs, Boeing Co, Intel Corp
Worst Performers: IBM, Johnson and Johnson, Merck&Co
Resistance levels: 31,885 32,800 33,272 (4H chart)
Support levels: 31,650 30,143 29,653 (4H chart)
-637938536918255161.png)
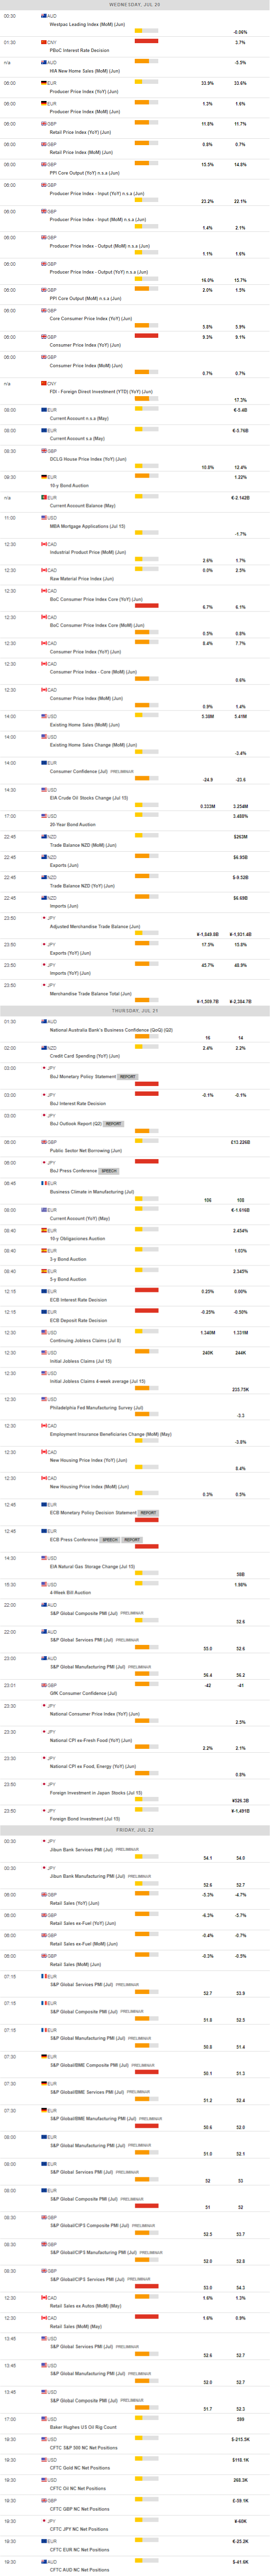
MACROECONOMIC EVENTS
All Information & Updates provided by:

All information relating to the financial markets available on this page has been prepared and issued by FXStreet (Forexstreet SL, Spain, Reg: B62498233) on the basis of publicly available information and all information believed to be reliable and does not conflict with Kuwaiti local laws, and all necessary care has been taken to before the company to ensure that the facts mentioned are correct from the source.
NCM Investment nor any of its directors or employees shall in any way be held responsible for the contents of this news, and the information contained on this page is intended only to provide clients with publicly available information and should not be construed as investment advice, report or analysis and/or constitute an offer or invitation to buy or sell financial instruments of any kind.
RISK WARNING: Forex and CFDs are highly risky leveraged products, as losses can exceed deposits. Please ensure you understand all the risks and take independent advice if necessary. NCM will segregate the clients based on the criteria of the regulator and its bylaws. NCM does not provide any advisory service; the material published does not constitute advice or a recommendation for a transaction in any financial instrument. NCM accepts no responsibility for any use of the content presented and any consequences of that use. Anyone acting on the information provided does so at their own risk.