
- Contact Us:
-

-

-

-


Daily Market Updates
21 Jul 2022
EURUSD
Ahead of the European Central Bank’s highly-anticipated policy announcements on Thursday, EUR/USD failed to build on its weekly gains and fluctuated in a tight channel near 1.0200 throughout the day on Wednesday.
The uncertainty surrounding the Nord Stream 1 gas pipeline caused investors to adopt a cautious stance. Russian President Vladimir Putin said on Wednesday that they don’t know in what condition the equipment would return from maintenance and added that there was a risk that gas flows could be switched off.
The data published by the European Commission showed that the Consumer Confidence Index for the euro area declined to -27 in July’s flash estimate from -23.8 in June. Moreover, the International Monetary Fund announced that it lowered its growth forecasts for Germany to 1.2% for 2022 and to 0.8% for 2023.
On the other hand, Existing Home Sales in the US declined for the fifth straight month in June to a seasonally adjusted annual rate of 5.12 million, the National Association of Realtors reported on Wednesday. The median price for existing homes increased by 13.4% from one year ago to $416,000, marking a new all-time high.
The near-term technical outlook shows that the pair lost its bullish momentum following Wednesday’s action. The RSI on the four-hour chart declined below 60 and the ADX started to edge lower after having risen steadily since the beginning of the week. Additionally, the 100-period SMA on the same chart seems stays intact at around 1.0250.
On a broader view, above 1.0400, where the 200-period SMA on the four-hour chart is located, EUR/USD is predicted to meet the next hurdle at the 55-day SMA at 1.0483, just ahead of the 5-month resistance line near 1.0530. Above the latter, the downside pressure is forecast to mitigate and allow the pair to attempt a move to the weekly peak at 1.0615 (June 27) prior to the June high at 1.0773 (June 9) and the May top at 1.0786 (May 30). On the flip side, 1.0000 (parity) alings as key support on the downside ahead of the 2022 low at 0.9952 (July 14). South from here turns up the December 2002 low at 0.9859 seconded by the October 2002 low at 0.9685.
Resistance levels: 1.0250 1.0300 1.0400 (4H chart)
Support levels: 1.0100 1.0000 0.9952 (4H chart)
-637939384439096435.jpg)
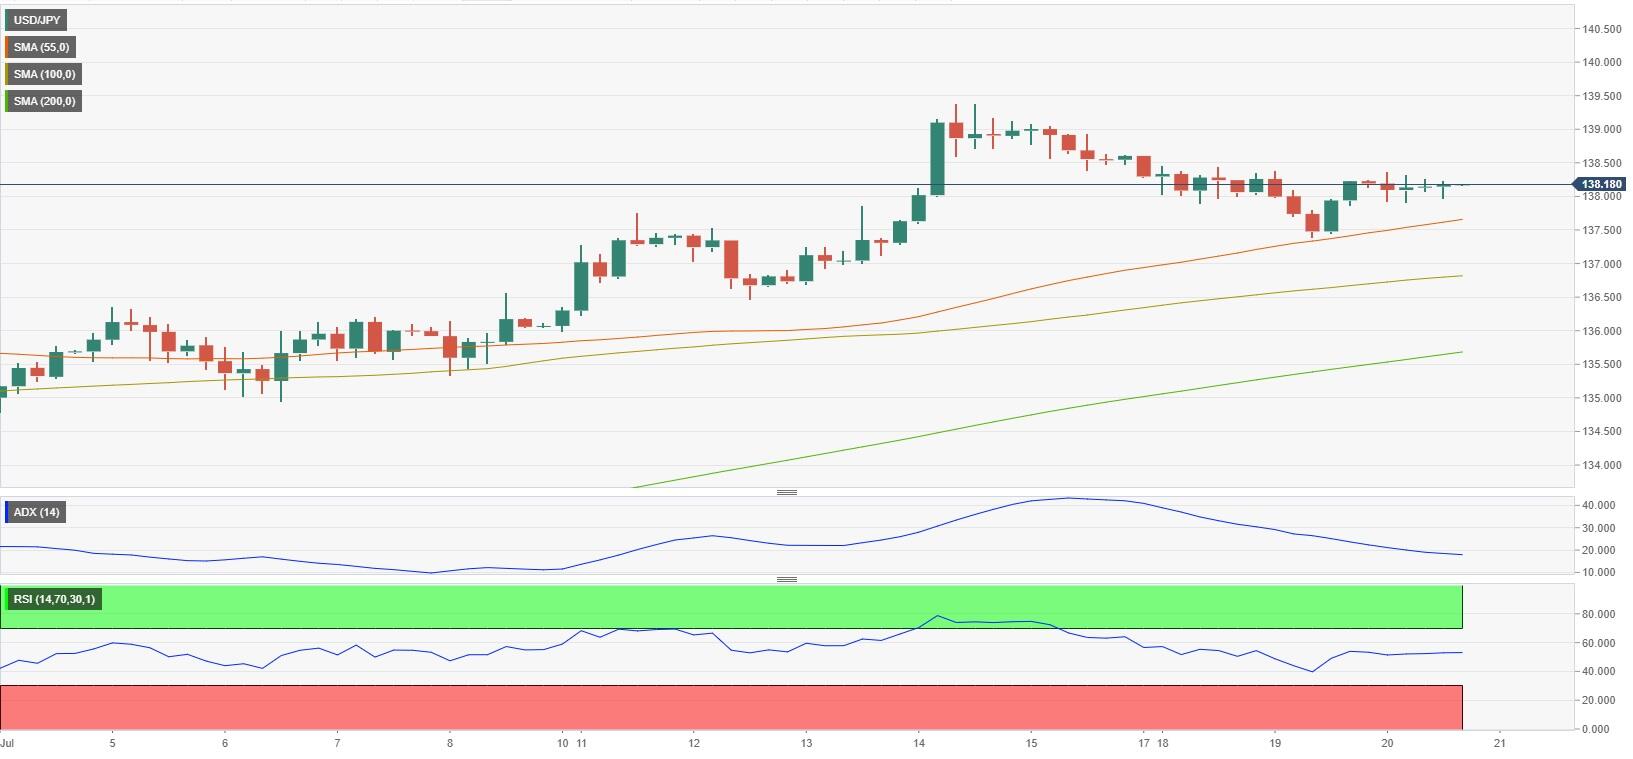
USDJPY
For the second straight day on Wednesday, USD/JPY moved sideways near 138.00 and closed flat.The Bank of Japan is widely expected to leave its policy settings unchanged and reiterate its commitment to loose policy.
During the American trading hours, the benchmark 10-year US Treasury bond yield stayed calm near 3% and Wall Street’s main indexes traded mixed after opening near Tuesday’s closing levels, making it even more difficult for the pair to find direction.
Following Wednesday’s choppy action, the near-term technical outlook stays unchanged. Immediately to the upside in USD/JPY appears the 2022 high at 139.38 (July 13) ahead of the round level at 140.00. The surpass of the latter should open the door to the weekly peak at 145.41 (August 21 1998) ahead of the all-time top at 147.67 (August 11 1998). Bears, in the meantime, target the July low at 134.74 (July 1) just before the 134.26 level (June 23 low). Once cleared, the focus of attention should shift to the 55-day SMA at 132.63 prior to the weekly low at 131.49 (June 16) and the psychological 130.00 level. The daily RSI continues to move sideways slightly above 60, showing that the pair remains in a consolidation phase despite remaining bullish.
Resistance levels: 139.38 144.26 145.24 (4H chart)
Support levels: 137.60 136.80 135.70 (4H chart)
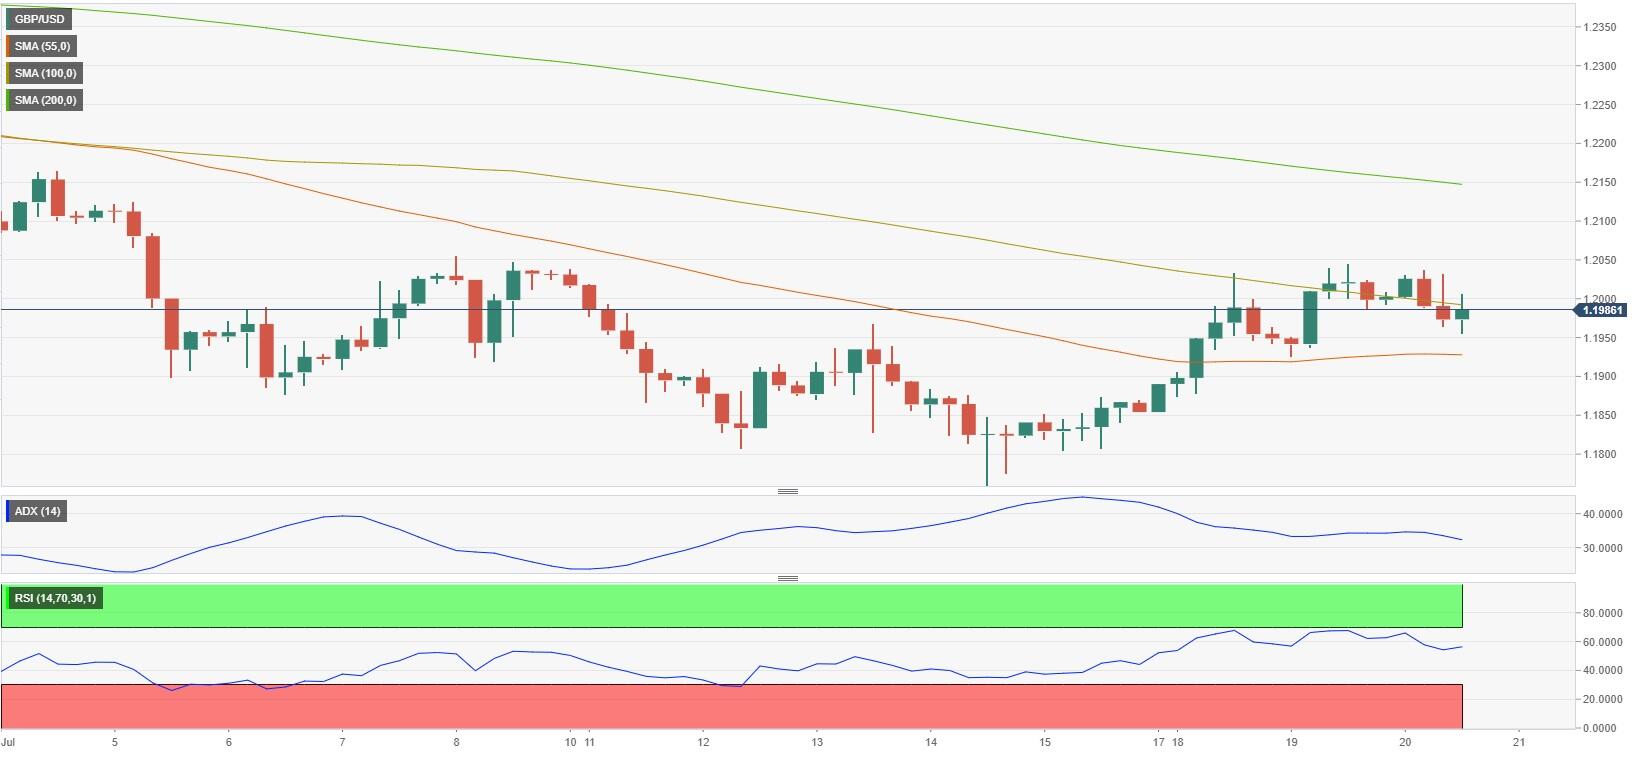
GBPUSD
The British pound failed to capitalize on hot inflation data on Wednesday and GBP/USD spent a large portion of the day below 1.2000.
The UK’s Office for National Statistics reported that inflation in the UK, as measured by the Consumer Price Index (CPI), climbed to 9.4% on a yearly basis in June from 9.1% in May. On a positive note, the Core CPI, which excludes volatile food and energy prices, edged lower to 5.8% from 5.9% in the same period. Other details of the report revealed that the Retail Price Index rose to 11.8% (YoY) and the Producer Price Index (Input) advanced to 24% (YoY) from 22.4%.
Meanwhile, following Wednesday's voting, Penny Mordaunt got knocked out of the Conservative leadership contest, leaving Rishi Sunak and Liz Truss to face each other in the run-off to replace Boris Johnson. The winner of the final round is expected to be announced on Monday, September 5.
The RSI on the four-hour chart declined below 50 on Wednesday, suggesting that buyers moved to the sidelines. Additionally, GBP/USD stays below the 100-period SMA on the four-hour chart, which is currently located around 1.2000. The 55-day SMA at 1.2287 still aligns as a reachable target in case the pair rises above 1.2000 and starts using it as support. The weekly high at 1.2332 (June 27) and another weekly peak at 1.2405 (June 16) could be seen as next bullish targets before the pair could stretch higher toward the May top at 1.2666 (May 27). On the downside, the 55-period SMA forms first support at 1.1920 before 1.1800 (psychological level) and 1.1760 (July 14 low).
Resistance levels: 1.2056 1.2150 1.2200 (4H chart)
Support levels: 1.1920 1.1800 1.1760 (4H chart)
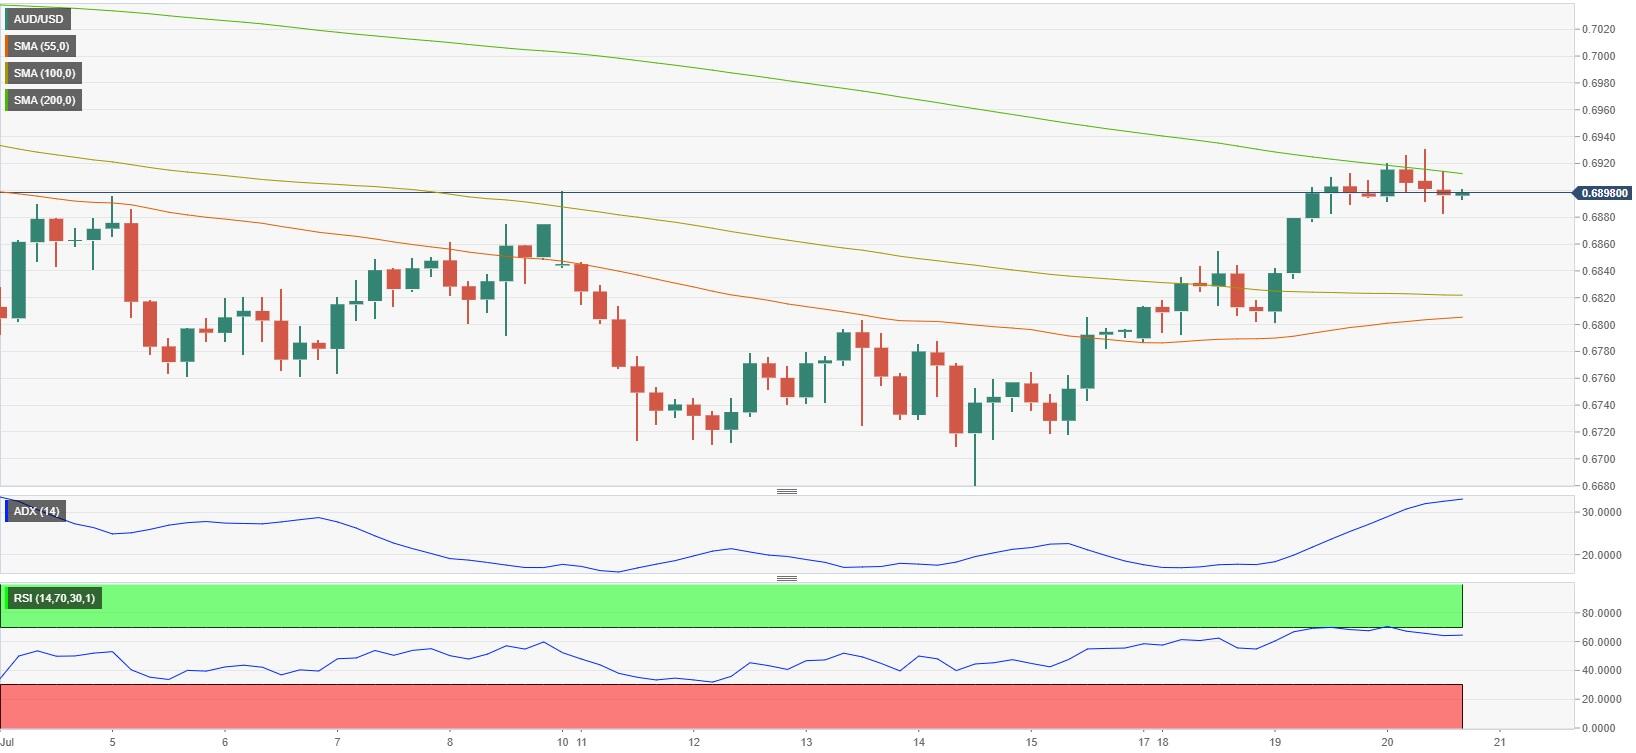
AUDUSD
Following Tuesday’s impressive rally, AUD/USD continued to push higher during the Asian trading hours on Wednesday and reached its strongest level since late June at 0.6931. The pair, however, lost its bullish momentum and erased its daily gains to close near 0.6900.
Reserve Bank of Australia (RBA) Governor Philip Lowe repeated that policymakers expect that further rate increases will be required over the months ahead. Meanwhile, the data from Australia revealed that the Westpac Leading Index declined to -0.2% in June from -0.1% in May. The National Australia Bank will release the Business Confidence Index for the second quarter on Thursday.
AUD/USD failed to make a four-hour close above the 200-period SMA, which currently sits at 0.6920, despite having tested that level twice earlier in the day. The breakout of this level could lead up to a test of the temporary 55-day SMA at 0.6983 prior to the psychological mark at 0.7000. Further up is seen another weekly top at 0.7069 before the 100-day SMA at 0.7153 and the key 200-day SMA at 0.7195. On the downside, the 100-period SMA aligns as first support at 0.6820 ahead of the static support at 0.6730 and the 2022 low at 0.6681 (July 14). Meanwhile, the daily RSI turned horizontal near 50, suggesting that the pair is struggling to gather bullish momentum.
Resistance levels: 0.6920 0.6983 0.7000 (4H chart)
Support levels: 0.6820 0.6730 0.6681 (4H chart)
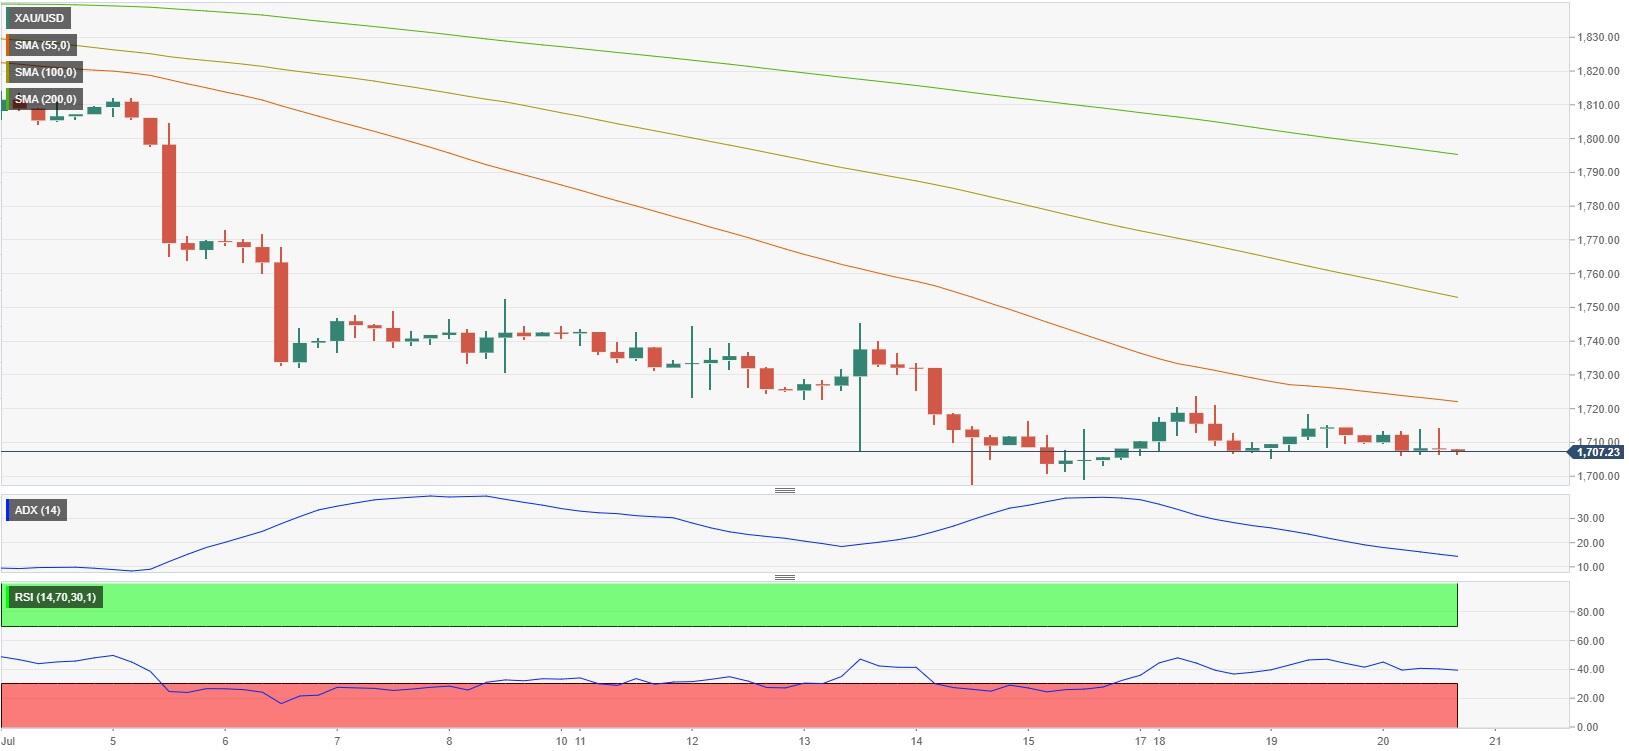
GOLD
Once again, gold failed to make a convincing move in either direction and spent the day moving up and down in a narrow band above $1,700.
The dollar’s uninspiring performance helps XAU/USD limit its losses but market participants remain concerned about the yellow metal’s demand outlook amid growing concerns over China imposing tighter restrictions. China confirmed 1,012 new coronavirus cases for July 19, of which 150 were symptomatic and 862 were asymptomatic, according to the National Health Commission (NHC).
Gold stays afloat above the key support that aligns at $1,700. A convincing breach of this level could prompt the precious metal to accelerate losses to the 2021 low at $1,1676 (March 8) ahead of the June 2020 low at $1,670 (June 5). On the flip side, the 55-period SMA on the four-hour chart forms first resistance at $1,720 ahead of $1,740 (static level) and $1,750 (100-period SMA). The RSI on the four-hour chart continues to move sideways near, confirming the precious metal’s indecisiveness.
Resistance levels: $1,720 $1,740 $1,750 (4H chart)
Support levels: $1,700 $1,676 $1,670 (4H chart)
CRUDE WTI
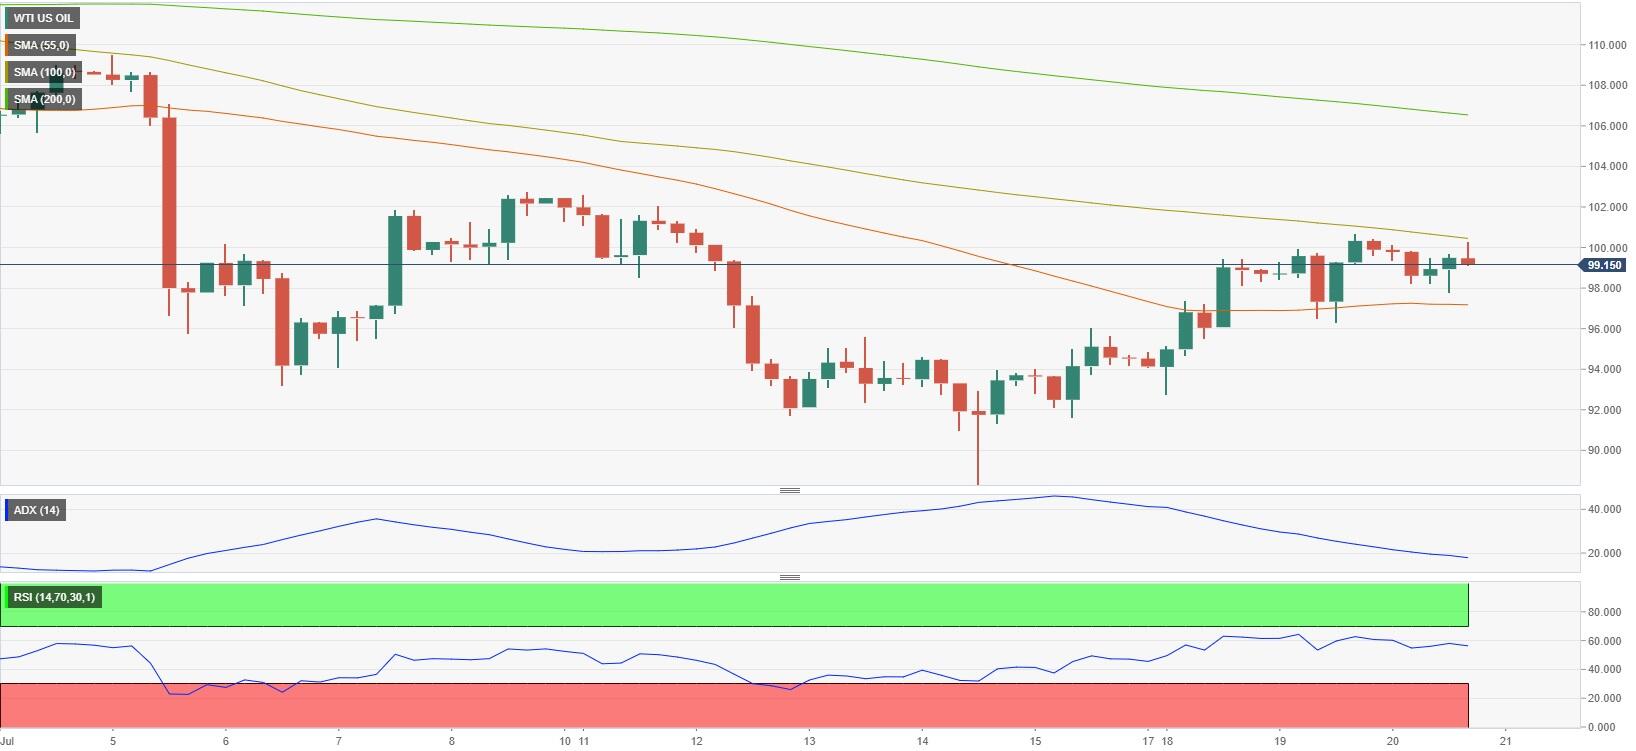
Crude oil prices fell on Wednesday and the barrel of West Texas Intermediate (WTI) registered daily losses for the first time in six days, settling below $100 in the late American session.
Investors remain concerned about the energy demand outlook with major economies facing tough times ahead. The data published by the US Energy Information Administration (EIA) revealed that total products supplied, a gauge of oil demand in the US, over the last four-week period averaged 20.1 million barrels per day, 2.6% lower than the same period last year. Other details of the weekly report showed that commercial crude oil inventories declined by 0.4 million barrels in the week ending July 15.
Although the RSI on the four-hour chart holds above 50, the ADX on the same chart continues to decline, pointing to a loss of bullish momentum. The static level that seems to have formed at $97.80 aligns as first support before the 200-day SMA at $94.55 and $94.00 (static level). On the upside, $100 (psychological level, 100-period SMA) aligns as immediate resistancebefore $102.50 (static level) and $106.00 (200-period SMA).
Resistance levels: $100.00 $102.50 $106.00 (4H chart)
Support levels: $97.80 $94.55 $94.00 (4H chart)
DOW JONES
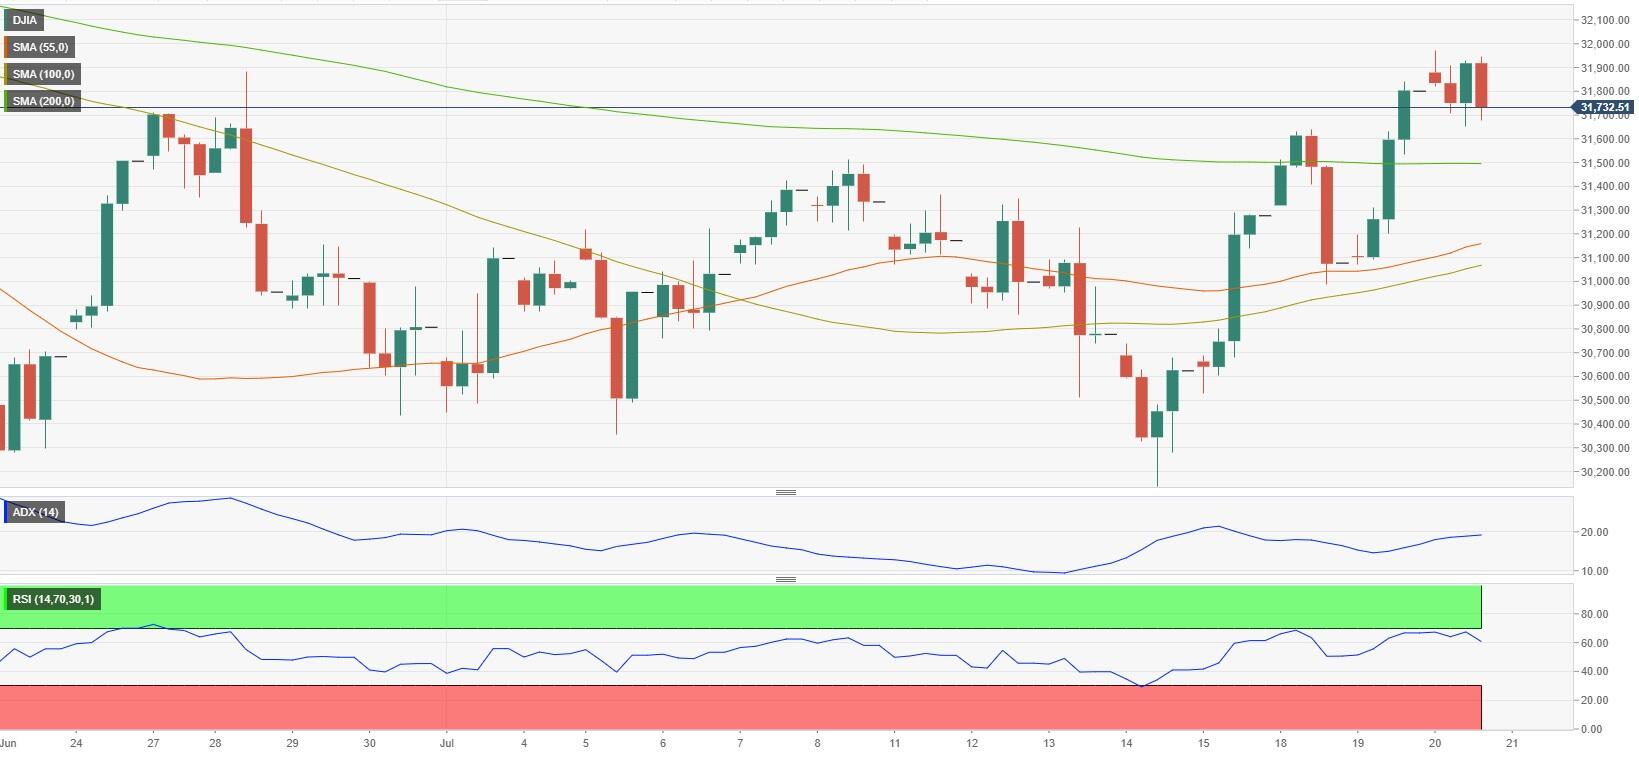
Major equity indexes in the US opened near Tuesday’s closing levels. The disappointing housing data from the US and Thursday’s key risk events caused investors to adopt a cautious stance.
Five of the 11 major S&P 500 sectors registered gains while six of them dropped on Wednesday. The Utilities Index lost more than 1% as the worst performing major sector while the Technology Index gained 1%.
Supported by rising tech shares, the Nasdaq Composite climbed to its highest level since early June. The S&P 500 Index couldn’t pull awat from the opening area and the Dow Jones Industrial average registered modest daily losses.
The Dow lost its traction after coming withing a touching distance of 32,000. In case the index manages to clear that hurdle, the100-day SMA forms the next bullish target at 32,800 before the June top at 33,272 (June 1) and the May high at 34,117 (May 4). On the other hand, the 55-day SMA forms immediate support at 31,650 before the July low at 30,143 (July 14). In case the latter support fails, the 2022 low at 29,653 (June 17) comes as the next line of defense ahead of the 28,902 level (low November 12 2020). The RSI on the daily chart continues to hover above the 50 region, suggesting that Wednesday’s action doesn’t yet point to a reversal of direction.
Top Performers: Ceridian HCM Holding Inc, Nasdaq Inc, Generac Holdings Inc
Worst Performers: Elevance Health Inc, Baker Hughes Co, Biogen Inc
Resistance levels: 32,000 32,800 33,272 (4H chart)
Support levels: 31,650 30,143 29,653 (4H chart)
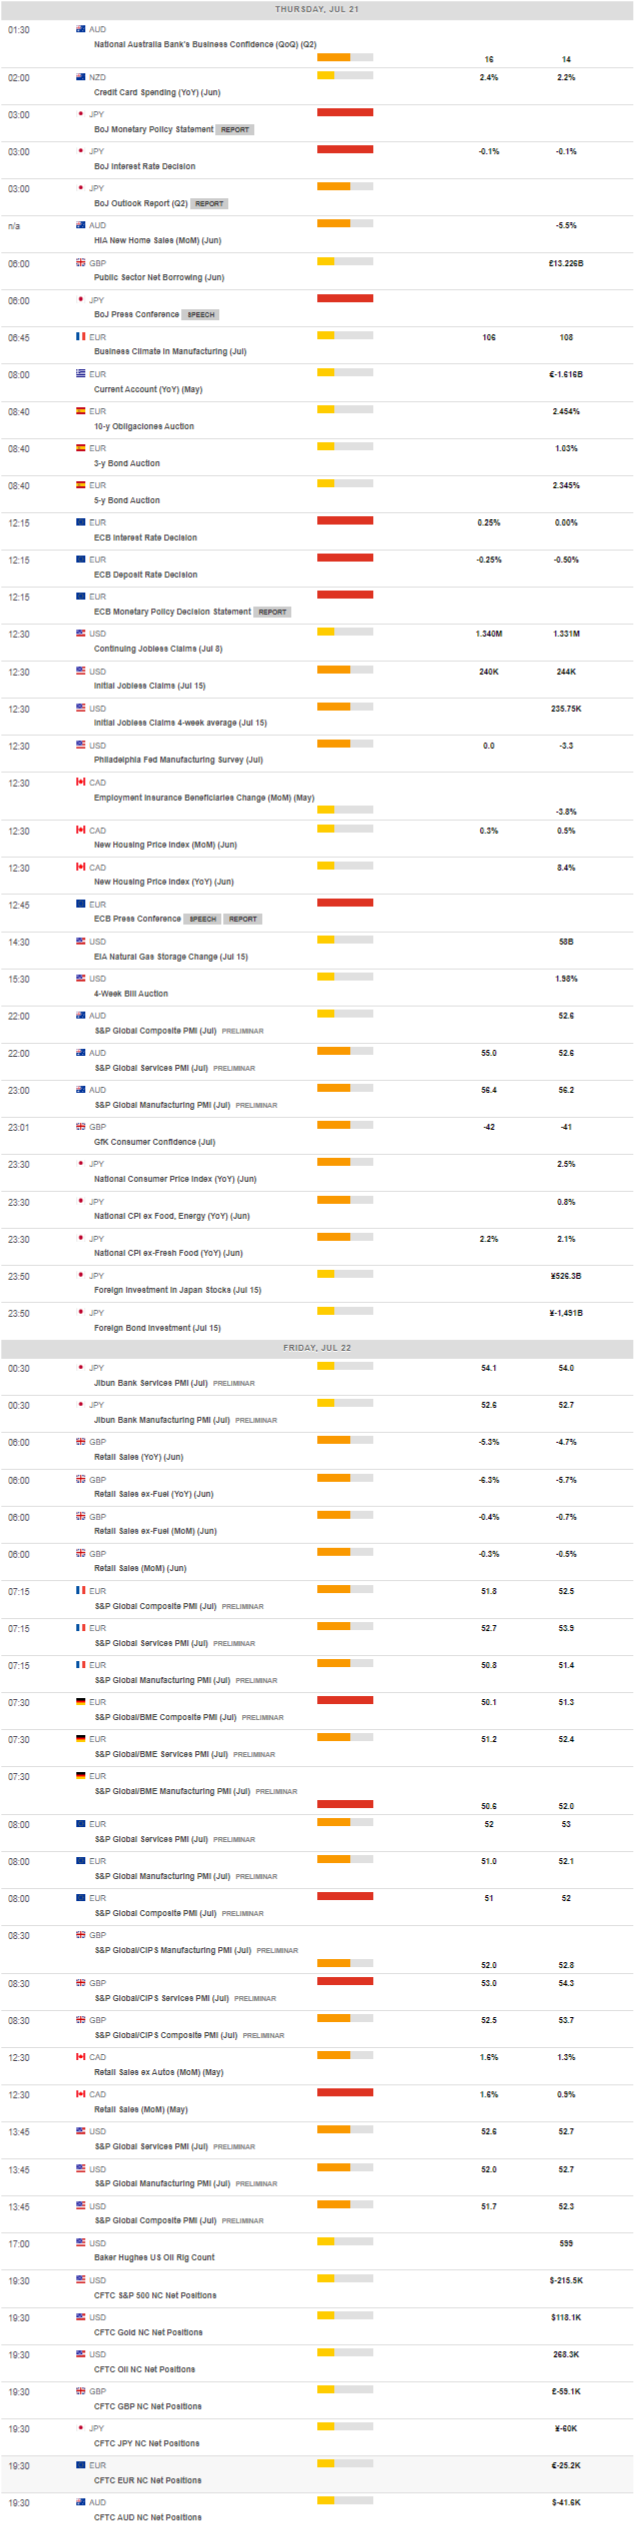
MACROECONOMIC EVENTS
All Information & Updates provided by:

All information relating to the financial markets available on this page has been prepared and issued by FXStreet (Forexstreet SL, Spain, Reg: B62498233) on the basis of publicly available information and all information believed to be reliable and does not conflict with Kuwaiti local laws, and all necessary care has been taken to before the company to ensure that the facts mentioned are correct from the source.
NCM Investment nor any of its directors or employees shall in any way be held responsible for the contents of this news, and the information contained on this page is intended only to provide clients with publicly available information and should not be construed as investment advice, report or analysis and/or constitute an offer or invitation to buy or sell financial instruments of any kind.
RISK WARNING: Forex and CFDs are highly risky leveraged products, as losses can exceed deposits. Please ensure you understand all the risks and take independent advice if necessary. NCM will segregate the clients based on the criteria of the regulator and its bylaws. NCM does not provide any advisory service; the material published does not constitute advice or a recommendation for a transaction in any financial instrument. NCM accepts no responsibility for any use of the content presented and any consequences of that use. Anyone acting on the information provided does so at their own risk.