
- Contact Us:
-

-

-

-


Daily Market Updates
22 Jul 2022
EURUSD
EUR/USD hit fresh 2-week highs in the 1.0280 region soon after the ECB surprised markets with a 50 bps interest rate hike vs. the largely anticipated 25 bps.
Indeed, the ECB lifted interest rates back to the positive region on Thursday, although the Governing Council refrained from unveiling further details regarding the moves in future meetings, leaving its stance to a meeting-by-meeting approach.
Following the hawkish message from the central bank, market participants now have started to pencil in a 50 bps hike in September – the door, however, appears open to a 75 bps as well – and probably in October.
Despite the initial leap to the vicinity of the 1.0300 area, the pair lost momentum and rapidly gave away all those gains, returning to the 1.0180 region and matching the previous day’s close.
In the German money markets, the 10y Bund yields climbed to multi-week tops around 1.37%, although the move fizzled out afterwards.
Other than the ECB event, Business Confidence in France eased to 106 in July (from 108). Across the pond, Initial Claims rose by 251K in the week to July 16, the Philly Fed Manufacturing Index deteriorated to -12.3 in the current month and the CB Leading Index dropped 0.8% MoM in June.
Further upside in EUR/USD now needs to leave behind the post-ECB top at 1.0278 (July 21) to attempt a move to the 55-day SMA at 1.0463. Beyond the latter comes the 5-month resistance line near 1.0515, which should mitigate the downside pressure once cleared. Further north emerges the weekly high at 1.0615 (June 27) ahead of the June peak at 1.0773 (June 9) and the May top at 1.0786 (May 30). On the other hand, there are no support levels of note until the parity area prior to the 2022 low at 0.9952 (July 14). The breach of this level exposes the December 2002 low at 0.9859 before the October 2002 low at 0.9685. The daily RSI recedes a tad to the sub-42 zone.
Resistance levels: 1.0277 1.0382 1.0448 (4H chart)
Support levels: 1.0153 1.0119 1.0081 (4H chart)
-637940269423835531.png)
USDJPY
USD/JPY left behind two consecutive sessions with gains and retreated modestly on the back of the selling pressure around the greenback and another poor performance of US yields.
On the latter, US yields retreated across the curve for the second straight session, with the short end revisiting the 3.15% area, the belly approaching the 2.90% region and the long end flirting with the 3.05% zone.
The US Dollar Index (DXY), in the meantime, retested the weekly lows in the mid-106.00s and bounced back to the107.00 region, retreating marginally for the day.
There was no reaction in the Japanese yen after the BoJ surprised no one once again and left the monetary policy unchanged at its meeting early on Thursday. The BoJ, however, did raise its inflation forecast to 2.3% (from 1.9%) for the FY 2023.
Further data in the Japanese docket showed June’s trade deficit shrink to ¥1,383.8.
Next up barrier for USD/JPY emerges at the 2022 top at 139.38 (July 13) prior to the round level at 140.00. If the bullish impulse picks up pace, then the weekly high at 145.41 (August 21 1998) could return to the radar before the all-time high at 147.67 (August 11 1998). On the downside, the July low at 134.74 (July 1) emerges as the immediate contention zone ahead of the 134.26 level (June 23 low) and the 55-day SMA at 133.08. Down from here comes the weekly low at 131.49 (June 16) ahead of the psychological 130.00 yardstick. The daily RSI drops to the 62 area following the daily retracement,
Resistance levels: 138.87 139.38 144.26 (4H chart)
Support levels: 137.71 137.38 136.47 4H chart)
-637940270843503141.png)
GBPUSD
GBP/USD traded on the defensive for the second session in a row on Thursday, navigating with the familiar range and with daily gains capped around the key 1.2000 neighbourhood.
The move lower in cable came despite the lack of upside traction in the greenback, while the quid managed to regain part of the ground lost to the single currency soon after the ECB hiked rates earlier in the session.
On the political front, the British pound remained apathetic after Rishi Sunak and Liz Truss were finally nominated to be the Tory candidates to replace Boris Johnson at Number 10.
In the UK calendar, Public Sector Net Borrowing shrank to £22.11B in June, in what was the only release on Thursday.
GBP/USD faces the immediate up barrier at the weekly peak at 1.2045 (July 19) ahead of the 55-day SMA at 1.2258. The breakout of this level exposes a probable test of the weekly top at 1.2332 (June 27) followed by another weekly high at 1.2405 (June 16). Extra gains from here should target the May peak at 1.2666 (May 27) ahead of the psychological 1.3000 mark. In the opposite direction, the next support appears at the 2022 low at 1.1759 (July 14) before the 2020 low at 1.1409 (March 20). The daily RSI loses momentum and approaches 42.
Resistance levels: 1.2045 1.2056 1.2165 (4H chart)
Support levels: 1.1889 1.1759 1.1638 (4H chart)
-637940270221470310.png)
AUDUSD
AUD/USD resumed the weekly recovery and quickly faded Wednesday’s pullback, although the daily advance ran out of steam in the proximity of 0.6920 on Thursday.
The weaker note in the greenback seems to have been enough to keep the Aussie dollar bid despite the broad-based decline in commodities and another retracement in prices of the iron ore, this time testing the $102.00 area per tonne.
The Aussie docket was empty on Thursday, leaving all the attention to the release of the preliminary Manufacturing and Services PMIs for the month of July on Friday.
AUD/USD faces the next up barrier at the weekly high at 0.6930 (July 20). The surpass of this area should open the door to a potential visit to the interim 55-day SMA at 0.6968 ahead of the psychological 0.7000 level. Beyond the latter appears the weekly peak at 0.7069 prior to the 100-day SMA at 0.7140 and the key 200-day SMA at 0.7187. On the other hand, the 2022 low at 0.6681 (July 14) remains the big magnet for bears ahead of the May 2020 low at 0.6372 (May 4) and the weekly low at 0.6253 (April 21 2020). The daily RSI advances modestly north of 51.
Resistance levels: 0.6930 0.6964 0.6995 (4H chart)
Support levels: 0.6858 0.6718 0.6681 (4H chart)
-637940271502292976.png)
GOLD
Following a drop to levels last seen in August 2021 around $1,680 per ounce troy, bullion sparked a moderate bounce to the $1,715/20 band on Thursday.
The rebound from nearly 12-month lows came in response to the loss of momentum in the greenback in combination with another downtick in US yields across the curve.
The negative outlook around gold remained, in the meantime, underpinned by the prospects for further tightening by major central banks and the consequent lower inflation expectations.
The breach of the 2022 low at $1,680 (July 21) should introduce gold to a deeper pullback to the 2021 low at $1,1676 (March 8) prior to the June 2020 low at $1,670 (June 5). Bulls are expected to meet the next hurdle at the $1,752 level (July 8 peak) before the key $1,800 mark. If the yellow metal clears the latter, it could then embark on a probable recovery to the 55-day SMA at $1,811 ahead of the more relevant 200-day SMA at $1,843. North from here appears the $1,857 level (June 16 high) prior to the June top at $1,879 (June 13).
Resistance levels: $1,718 $1,745 $1,752 (4H chart)
Support levels: $1,680 $1,670 $1,661 (4H chart)
-637940271969210315.png)
CRUDE WTI
Prices of the barrel of WTI retreated moderately and added to Wednesday’s losses on Thursday. Indeed, the commodity briefly dropped and revisited the area around the 200-day SMA near $94.60, just to regain some composure afterwards.
Crude oil prices remained under pressure, as the partial resumption of the activity in the Nord Stream 1 pipeline alleviated supply concerns around gas, while the unexpected large build in US gasoline inventories – as per the EIA’s report on Wednesday - also added to the downside.
Also, on the negatives for the commodity appeared the recent hike by the ECB, which also added to the fears surrounding a potential recession in the euro area in the next months.
A drop below the 200-day SMA ($94.58) on a convincing fashion should prompt prices of the WTI to retreat further and attempt another visit to the July low at $90.58 (July 14) ahead of the 81.94 level (low January 24) and the 2022 low at $74.30 (January 3). On the other hand, the weekly high at $104.44 (July 19) comes first prior to the July top at $111.42 (July 5) and another weekly peak at $114.00 (June 29). Once cleared, the WTI could revisit the June high at $123.66 (June 14) ahead of the 2022 top at $129.42 (March 8) and the all-time peak at $147.27 (July 11 2008).
Resistance levels: $100.69 $104.54 $105.21 (4H chart)
Support levels: $94.57 $90.54 $90.05 (4H chart)
-637940272944802516.png)
DOW JONES
US equities added to the weekly recovery and advanced for the third session in a row on Thursday. That said, the Dow Jones gained 0.02% at 31,879, the S&P500 rose 0.56% at 3,982 and the tech-heavy Nasdaq Composite advanced 1.05% at 12,022.
Upbeat quarterly reports from electric car-maker Tesla and streaming giant Netflix propped up the positive performance in the tech sector and helped prop up the optimism among investors, which remained focused on the start of the hiking cycle by the ECB and the FOMC event on July 27.
Extra rebound in the Dow should break the July top at 31,944 (July 20) prior to the interim 100-day SMA at 32,805. Further up aligns the June high at 33,272 (June 1) ahead of the May peak at 34,117 (May 4). On the downside, the initial support remains at the July low at 30,143 (July 14) before the 2022 low at 29,653 (June 17). A drop below the latter should expose the 28,902 level (low November 12 2020) prior to the October 2020 low at 26,143 (October 30). The RSI appears side-lined near 57.
Top Performers: Boeing, Walmart, Apple
Worst Performers: Verizon, Dow, IBM
Resistance levels: 31,944 32,799 33,272 (4H chart)
Support levels: 30,143 29,653 29,228 (4H chart)
-637940273856469835.png)
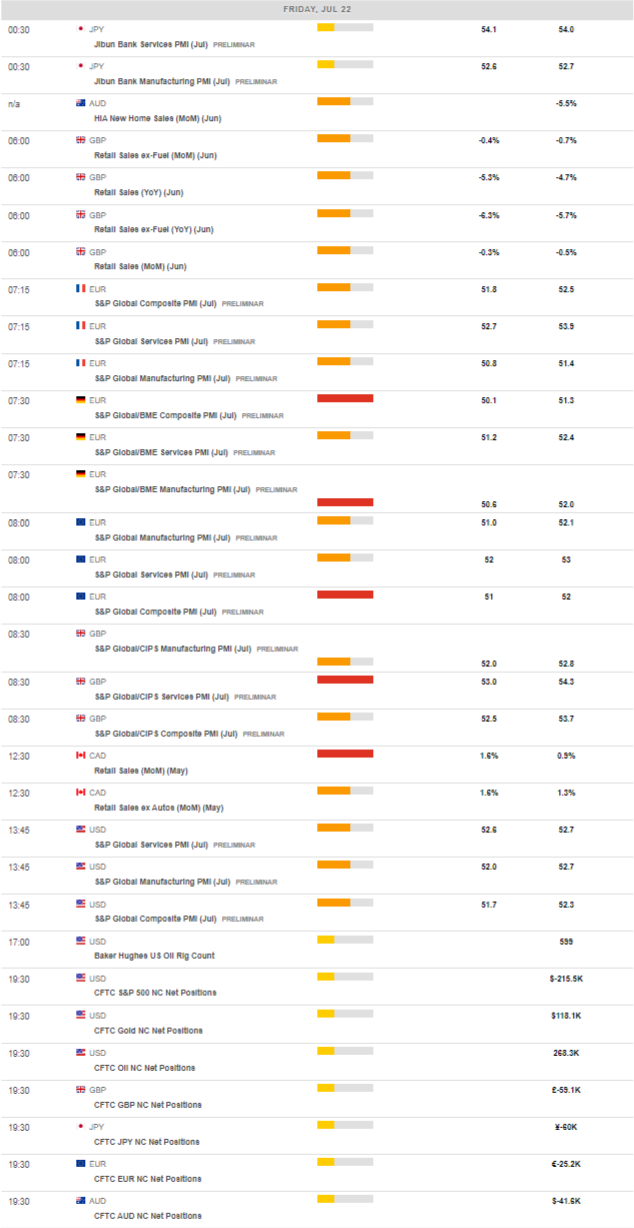
MACROECONOMIC EVENTS
All Information & Updates provided by:

All information relating to the financial markets available on this page has been prepared and issued by FXStreet (Forexstreet SL, Spain, Reg: B62498233) on the basis of publicly available information and all information believed to be reliable and does not conflict with Kuwaiti local laws, and all necessary care has been taken to before the company to ensure that the facts mentioned are correct from the source.
NCM Investment nor any of its directors or employees shall in any way be held responsible for the contents of this news, and the information contained on this page is intended only to provide clients with publicly available information and should not be construed as investment advice, report or analysis and/or constitute an offer or invitation to buy or sell financial instruments of any kind.
RISK WARNING: Forex and CFDs are highly risky leveraged products, as losses can exceed deposits. Please ensure you understand all the risks and take independent advice if necessary. NCM will segregate the clients based on the criteria of the regulator and its bylaws. NCM does not provide any advisory service; the material published does not constitute advice or a recommendation for a transaction in any financial instrument. NCM accepts no responsibility for any use of the content presented and any consequences of that use. Anyone acting on the information provided does so at their own risk.