
- Contact Us:
-

-

-

-


Daily Market Updates
25 Jul 2022
EURUSD
EUR/USD closed Friday’s session with modest losses in the 1.0210/15 band after quite a volatile session. Of note, however, is that the pair finally managed to close the first week with gains following three pullbacks in a row.
Same volatility faced the greenback after the US Dollar Index (DXY) gave away the initial advance in response to dismal readings from the flash Services PMI for the current month. Indeed, while the Manufacturing PMI came in a tad above estimates, the Services PMI sank into the contraction territory at 47, well below forecasts at 52.6.
The negative performance of the dollar was accompanied by another retracement in US yields, which was particularly exacerbated in the wake of the Services PMI results.
In the euro docket, the Manufacturing PMI in France, Germany and the Euroland is expected to drop further in July to 49.6, 49.2 and 49.6, respectively. The advanced Services PMIs are predicted to perform somewhat better at 52.1, 49.2 and 50.6, respectively.
Immediately to the upside in EUR/USD emerges the post-ECB high at 1.0278 (July 21) before the 55-day SMA at 1.0458. The continuation of the rebound should meet the 5-month resistance line around 1.0500 and a sustainable break above this area should alleviate the pair’s downside pressure and spark a potential visit to the weekly top at 1.0615 (June 27) prior to the June peak at 1.0773 (June 9), which is closely followed by the May high at 1.0786 (May 30). On the flip side, the resumption of the selling pressure is predicted to face the next support of note at the parity level ahead of the 2022 low at 0.9952 (July 14). The loss of the latter could see losses accelerate to the December 2002 low at 0.9859 ahead of the October 2002 low at 0.9685. The daily RSI deflates marginally below 45, in line with the small drop in spot.
Resistance levels: 1.0277 1.0382 1.0448 (4H chart)
Support levels: 1.0129 1.0119 1.0081 (4H chart)
-637942632499094247.png)
USDJPY
The renewed selling bias in the greenback in combination with the sharp decline in US yields forced the USD/JPY to print new 2-week lows in the mid-1350.00s and close at the same time the first week with losses after seven consecutive advances.
Indeed, the Japanese currency strongly appreciated after US yields retreated markedly to multi-week lows across the curve: the short end revisited the 2.90% area, while the belly broke below 2.75% and the long end tested the 2.95% region for the first time since late May.
In Japan, the Inflation Rate rose 2.4% in the year to June (from 2.5%). In addition, the Core Inflation Rate gained 2.2% YoY and the Inflation Rate Ex-Food and Energy rose 1.0% from a year earlier. Finally, Foreign Bond Investment shrank ¥919.6B in the week to July 16.
In case sellers remain in control of the sentiment, USD/JPY could extend the corrective downside to the July low at 134.74 (July 1) prior to the 134.26 level (June 23 low) and the 55-day SMA at 133.17. The breach of the latter exposes the weekly low at 131.49 (June 16) before the psychological 130.00 mark. Bullish attempts, however, are expected to meet the immediate hurdle at the 2022 high at 139.38 (July 13) seconded by the round level at 140.00. Further up, bulls could see the weekly top at 145.41 (August 21 1998) revisited prior to the all-time peak at 147.67 (August 11 1998). The daily RSI sinks to the 50 zone and opens the door to a probable deeper pullback.
Resistance levels: 138.87 139.38 144.26 (4H chart)
Support levels: 135.57 134.94 134.74 4H chart)
-637942633580167629.png)
GBPUSD
The soft tone in the greenback allowed the British pound to extend the weekly rebound and lift GBP/USD to fresh tops in the 1.2060/65 band, where some initial resistance appears to have turned up, triggering a subsequent correction to the vicinity of 1.2000.
In line with the rest of the global money markets, the demand for bond intensified and forced the UK 10y Gilt yields to retreat to levels last seen in late May in the 1.90% neighbourhood.
Also bolstering the upside momentum around the quid, preliminary figures saw the always relevant Services PMI surpass consensus at 53.3 for the current month, while the Manufacturing gauge is now seen at 52.2, also bettering previous estimates.
Extra releases in the UK calendar saw Retail Sales contract 5.8% in the year to June and the Consumer Confidence tracked by Gfk remained unchanged at -41 for the month of July.
Extra gains in GBP/USD now need to clear the weekly peak at 1.2063 (July 22) to allow for a probable visit to the 55-day SMA at 1.2252. North from here appears the weekly top at 1.2405 (June 16) ahead of the 100-day SMA at 1.2572 and the 1.2666 level (May 27), which is the last defense before a test of the psychological 1.3000 yardstick. On the downside, initial contention resurfaces at the 2022 low at 1.1759 (July 14) ahead of the 2020 low at 1.1409 (March 20). The daily RSI extends the bounce past the 45 level.
Resistance levels: 1.2063 1.2123 1.2165 (4H chart)
Support levels: 1.1889 1.1759 1.1638 (4H chart)
-637942633077432030.png)
AUDUSD
AUD/USD reversed Thursday’s uptick and ended the week around the 0.6920 region not before hitting new 4-week peaks near 0.6980 on Friday.
Another weak session in the greenback allowed the commodity complex to extend the weekly recovery, although this could not morph into extra legs to the Aussie dollar. On the latter, prices of the iron ore seem to have found some comfort zone around the $105.00 mark per tonne so far.
Data wise Down Under, flash readings for the month of July saw the Manufacturing PMI at 55.7 and the Services PMI at 50.4, down from June’s 56.2 and 52.6, respectively.
The so far July high at 0.6977 (July 22) appears as the initial up barrier seconded by the psychological 0.7000 mark. If the pair clears this level, then the next hurdle aligns at the weekly top at 0.7069 ahead of the 100-day SMA at 0.7136 and the key 200-day SMA at 0.7185. In the opposite direction, there are no support levels of relevance until the 2022 low at 0.6681 (July 14) prior to the May 2020 low at 0.6372 (May 4) and the weekly low at 0.6253 (April 21 2020). The daily RSI extends corrects lower to the proximity of 53.
Resistance levels: 0.6977 0.6995 0.7069 (4H chart)
Support levels: 0.6902 0.6858 0.6718 (4H chart)
-637942634248758478.png)
GOLD
Gold advanced for the second session in a row and briefly visited multi-day highs around $1,740 per ounce troy on Friday. Following the recent price action, the precious metal finally reversed a 5-week negative streak.
Despite the weekly advance, bullion is expected to remain under pressure considering the tight monetary stance prevailing among the major central banks, as the battle to tackle inflation remains far from over.
On the latter, investors largely anticipate the Federal Reserve to hike the Fed Funds Target Range by 75 bps at the July 27 gathering. According to CME Group’s FedWatch Tool, the probability of such a scenario now surpasses 81%.
Further upside momentum could motivate gold prices to challenge the $1,752 level (July 8 high) ahead of the critical $1,800 hurdle. The breakout of this level could open the door to the 55-day SMA at $1,809 before the more significant 200-day SMA at $1,843. If the upside gathers extra impulse, then a test of the $1,857 level (June 16 peak) could return to the radar ahead of the June top at $1,879 (June 13). The immediate down barrier, in the meantime, comes at the 2022 low at $1,680 (July 21) before the 2021 low at $1,1676 (March 8) and the June 2020 low at $1,670 (June 5).
Resistance levels: $1,739 $1,745 $1,752 (4H chart)
Support levels: $1,680 $1,670 $1,661 (4H chart)
-637942634697346328.png)
CRUDE WTI
Prices of the American benchmark for the sweet light crude oil dropped for the third session in a row and revisited the key 200-day SMA in the $94.60 region per barrel on Friday.
Demand concerns remained well and sound on Friday following further COVID cases in China, while traders continued to gauge the probability of a global slowdown in response to the tighter monetary conditions implemented by central banks around the world to tackle inflation.
In addition, supply worries appeared somewhat mitigated following the resumption of the Russian gas supply to Europe via the Nord Stream 1 pipeline. In the same tone, and despite the almost omnipresent military effervescence in the region, Libya remained on track to return to the normal activity of its oil production.
In the docket, the total US active oil rigs remained unchanged at 599 following the report by driller Baker Hughes in the week to July 22.
A deeper decline in prices of the WTI could put a test of the July low at $90.58 (July 14) back on the radar ahead of the 81.94 level (low January 24) and the 2022 low at $74.30 (January 3). On the flip side, the immediate up barrier turns up at the weekly peak at $104.44 (July 19) before the July high at $111.42 (July 5) and another weekly top at $114.00 (June 29). Beyond the latter, crude oil prices could challenge the June peak at $123.66 (June 14) prior to the 2022 top at $129.42 (March 8) and the all-time high at $147.27 (July 11 2008).
Resistance levels: $97.93 $100.69 $104.54 (4H chart)
Support levels: $94.22 $90.54 $90.05 (4H chart)
-637942635597775433.png)
DOW JONES
Equities tracked by the three major US stock indices seem to have taken a breather on Friday and reversed three consecutive daily advances. On the weekly chart, however, the Dow Jones clinched the third advance in a row.
Against that, the Dow Jones retreated 0.43% at 31,899, the S&P500 lost 0.93% at 3,961 and the tech reference Nasdaq Composite dropped 1.87% at 11,834.
The sour sentiment among investors gathered extra pace after both social media giants Twitter and Snap announced poor quarterly results, spreading the pessimism to shares of Meta Platforms Inc and Alphabet, which in turn put the tech sector under further pressure.
In the meantime, traders remained worried over the likelihood of a US recession following poor preliminary results from Manufacturing and Services PMIs, all against the backdrop of firm prospects for extra tightening by the Fed (and other central banks) for the time being.
The resumption of the uptrend should motivate the Dow Jones to clear the July high at 32,219 (July 22) ahead of the temporary 100-day SMA at 32,787. If the rebound gets more serious, then the next hurdle is at the June top at 33,272 (June 1) before the May peak at 34,117 (May 4). On the flip side, the July low at 30,143 (July 14) emerges as the immediate contention ahead of the 2022 low at 29,653 (June 17). The breach of this level carries the potential to spark a deeper retracement to the 28,902 level (low November 12 2020) ahead of the October 2020 low at 26,143 (October 30). The RSI corrects lower and breaks below 57.
Top Performers: American Express, Procter&Gamble, IBM
Worst Performers: Verizon, Intel, Nike
Resistance levels: 32,219 32,780 33,272 (4H chart)
Support levels: 30,982 30,143 29,653 (4H chart)
-637942636079702315.png)
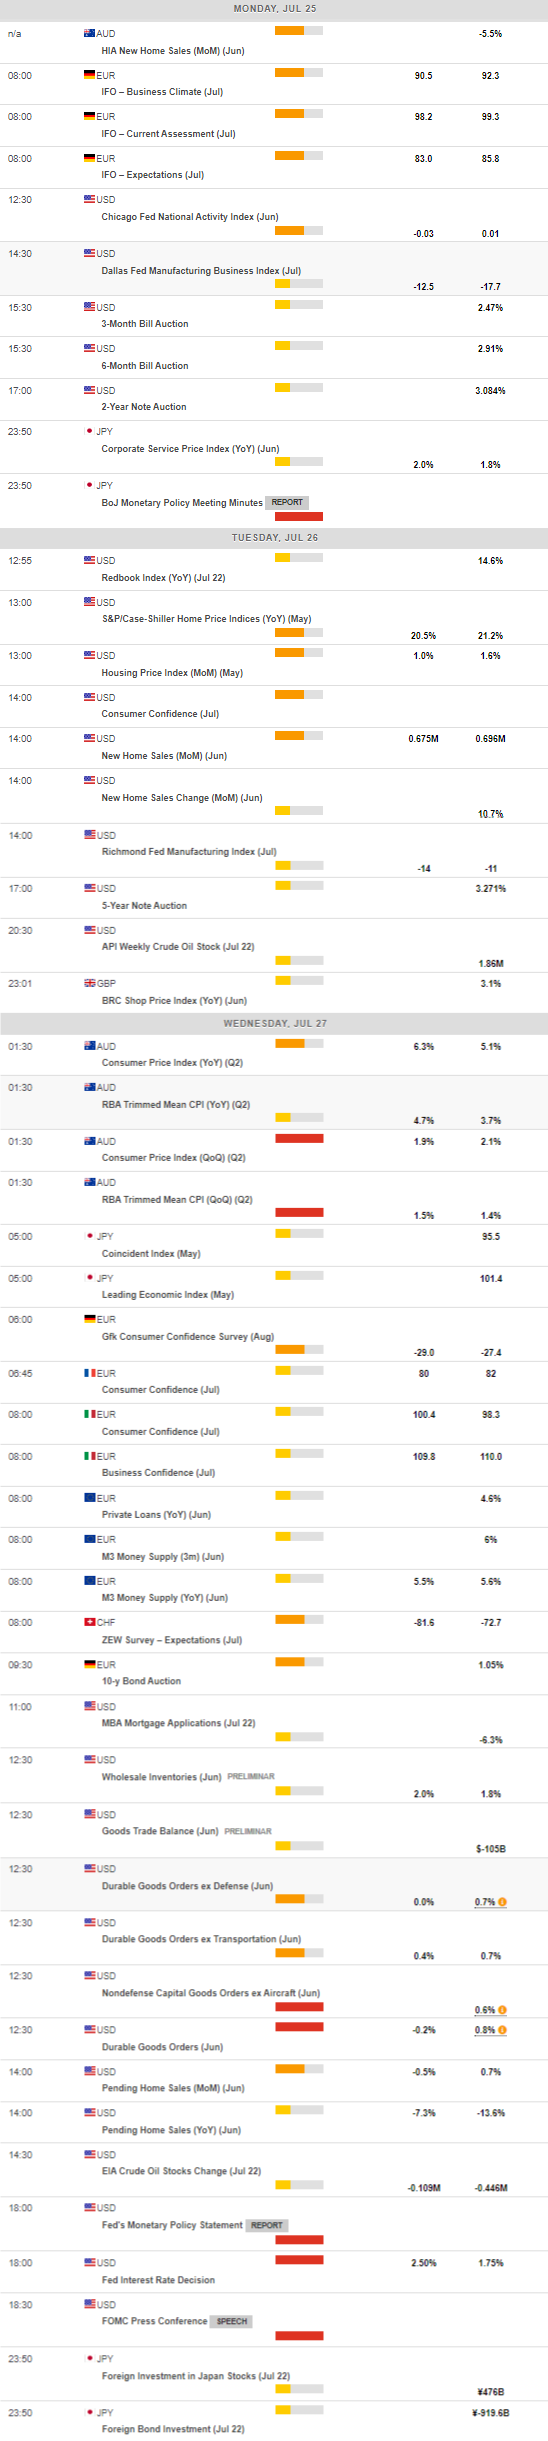
MACROECONOMIC EVENTS
All Information & Updates provided by:

All information relating to the financial markets available on this page has been prepared and issued by FXStreet (Forexstreet SL, Spain, Reg: B62498233) on the basis of publicly available information and all information believed to be reliable and does not conflict with Kuwaiti local laws, and all necessary care has been taken to before the company to ensure that the facts mentioned are correct from the source.
NCM Investment nor any of its directors or employees shall in any way be held responsible for the contents of this news, and the information contained on this page is intended only to provide clients with publicly available information and should not be construed as investment advice, report or analysis and/or constitute an offer or invitation to buy or sell financial instruments of any kind.
RISK WARNING: Forex and CFDs are highly risky leveraged products, as losses can exceed deposits. Please ensure you understand all the risks and take independent advice if necessary. NCM will segregate the clients based on the criteria of the regulator and its bylaws. NCM does not provide any advisory service; the material published does not constitute advice or a recommendation for a transaction in any financial instrument. NCM accepts no responsibility for any use of the content presented and any consequences of that use. Anyone acting on the information provided does so at their own risk.