
- Contact Us:
-

-

-

-


Daily Market Updates
26 Jul 2022
EURUSD
EUR/USD kept the consolidative trade well and sound for another session on Monday, this time leaving behind the initial knee-jerk to the 1.0180 region and resuming the upside beyond 1.0200 afterwards.
The uptick in the pair followed the third consecutive daily retracement in the greenback, which saw the US Dollar Index (DXY) recede to the 106.20 zone against the backdrop of a tepid recovery in US yields and a mild bias towards the risk complex.
Hawkish comments from ECB’s Kazaks seems to have propped up the better tone in the European currency after he favoured a “significant” rate hike in September and appeared to accompany the markets’ view of a 150 bps by June.
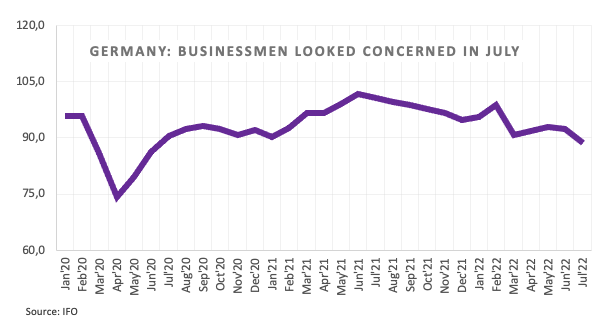
In addition, the euro remained apathetic after Germany’s Business Climate disappointed expectations in July at 88.6 when tracked by the IFO Institute. The institute added that companies see further deterioration in business in the next months, while Germany continues to flirt with a recession scenario amidst elevated energy prices and gas shortage.
Data wise across the pond, the Chicago Fed National Activity Index remained unchanged at -0.19 in June, while the Dallas Fed Manufacturing Index worsened to -22.6 for the current month.
EUR/USD still faces the next up barrier at the post-ECB top at 1.0278 (July 21) ahead of the 55-day SMA at 1.0452. Further up aligns the 5-month resistance line near 1.0490. The pair’s selling pressure is expected to alleviate once this area is cleared. Against that, the next hurdle emerges at the weekly high at 1.0615 (June 27) before the June peak at 1.0773 (June 9) and the May high at 1.0786 (May 30). In the opposite direction, there is immediate contention at the key party level. If breached, then a test of the 2022 low at 0.9952 (July 14) should return to the radar prior to the December 2002 low at 0.9859 and the October 2002 low at 0.9685. The daily RSI improves to the 47 region.
Resistance levels: 1.0257 1.0277 1.0382 (4H chart)
Support levels: 1.0129 1.0119 1.0081 (4H chart)
-637943692732401618.png)
USDJPY
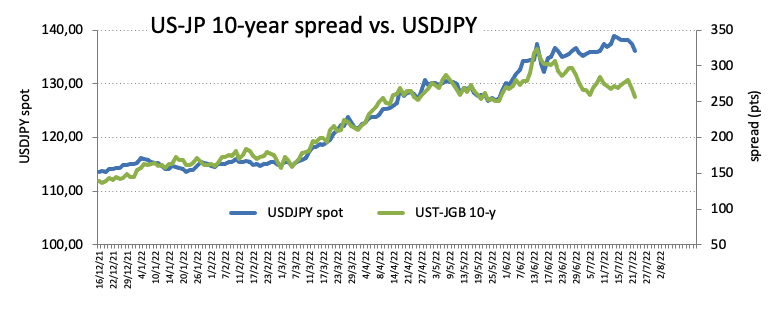
The mild recovery in US yields coupled with the mixed performance of the greenback seems to have been enough to motivate USD/JPY to reverse two daily pullbacks in a row and attempt a decent bounce on Monday.
Indeed, USD/JPY managed to leave behind the earlier drop to the 135.90 zone and embark on quite a strong rebound to the vicinity of 136.80 at the beginning of the week.
The uptick in spot came amidst a mild bounce in the US 10y yields to the 2.85% region, while the long end of the curve also traded with gains following three daily drops in a row.
From the BoJ, new Board member Takata defended the current Yield Curve Control (YCC) system, while his also new colleague suggested that an exit of the current ultra-accommodative stance should become the centre of attention in case a positive cycle kicks off in the domestic economy.
No data releases were scheduled in the Japanese calendar on Monday, whereas the BoJ Minutes will take centre stage on Tuesday.
The resumption of the bullish bias could motivate USD/JPY to challenge the 2022 top at 139.38 (July 13) ahead of the round level at 140.00. If cleared, then a potential visit to the weekly high at 145.41 (August 21 1998) could emerge on the horizon ahead of the all-time peak at 147.67 (August 11 1998). On the flip side, the weekly low at 135.56 (July 22) appears as the initial support seconded by the July low at 134.74 (July 1). Further weakness should target the 134.26 level (June 23 low) before the 55-day SMA at 133.29. The loss of this area exposes a deeper retracement to the weekly low at 131.49 (June 16) prior to the psychological 130.00 yardstick. The daily RSI rebounds past the 53 level.
Resistance levels: 137.95 138.87 139.38 (4H chart)
Support levels: 135.57 134.94 134.74 4H chart)
-637943693909528866.png)
GBPUSD
GBP/USD rose further and printed new 3-week highs past 1.2080 at the beginning of the week.
The continuation of the recovery in the sterling came in response to further selling pressure hitting the US dollar against the backdrop of an improved sentiment in the risk-linked galaxy.
In line with the above, UK 10y Gilt yields managed to finally leave behind several sessions in the negative territory and posted a small advance to the 1.96% area.
The UK docket will remain practically empty of relevant data releases until Friday’s publication of Mortgage Approvals and Mortgage Lending figures for the month of June.
Further recovery in GBP/USD should leave behind the weekly high at 1.2085 (July 25). The surpass of this level should expose a potential test of the 55-day SMA at 1.2247 ahead of the weekly peak at 1.2405 (June 16) and the 100-day SMA at 1.2561. North from here turns up the 1.2666 level (May 27) prior to the psychological 1.3000 mark. In case sellers regain initiative, the immediate support comes at the 2022 low at 1.1759 (July 14) prior to the 2020 low at 1.1409 (March 20). The daily RSI rebounds further and flirts with 50.
Resistance levels: 1.2085 1.2123 1.2165 (4H chart)
Support levels: 1.1915 1.1889 1.1759 (4H chart)
-637943693430451970.png)
AUDUSD
The favourable environment surrounding the riskier assets lent legs to the Aussie dollar and encouraged AUD/USD to fade Friday’s downtick and start the week with decent gains well north of the 0.6900 hurdle.
Indeed, another poor performance of the US dollar sustained the demand for the risk complex and bolstered the upside bias in spot, although the mixed note in the commodity space, including a small drop in prices of the iron ore appear to have capped the upside potential on Monday.
Further support to AUD came from the money markets in Oz, where the 10y AGB yields surpassed the 3.40% level following two daily drops in a row.
Next of relevance in the Australian calendar will be the publication of the inflation figures for the April-June period on Wednesday.
AUD/USD faces the next up barrier at the July top at 0.6977 (July 22) prior to the psychological 0.7000 level. North from here emerges the weekly peak at 0.7069 before the 100-day SMA at 0.7133 and the key 200-day SMA at 0.7183. In case the selling impulse regains momentum, the pair could slip back to the 2022 low at 0.6681 (July 14) ahead of the May 2020 low at 0.6372 (May 4) and the weekly low at 0.6253 (April 21 2020). The daily RSI pushes higher and surpasses 56.
Resistance levels: 0.6977 0.6995 0.7069 (4H chart)
Support levels: 0.6895 0.6878 0.6858 (4H chart)
-637943694329719251.png)
GOLD
Bullion abandoned a 2-session positive streak and resumed the downside despite the weaker tone around the greenback on Monday. Indeed, prices of the ounce troy of gold revisited the proximity of $1,740 before receding to the $1,715 area.
The precious metal remained under pressure ahead of the upcoming FOMC event (July 27) and the firm conviction among investors of another 75 bps rate hike. Supporting this view, the probability of such a raise surpasses 75%, as per CME Group’s FedWatch tool.
Also collaborating with the downbeat sentiment around gold, US yields left behind the recent moderate pullback and printed modest gains across the curve.
If losses accelerate, then gold could see the 2022 low at $1,680 (July 21) retested ahead of the 2021 low at $1,1676 (March 8) and the June 2020 low at $1,670 (June 5). The continuation of the rebound, instead, could revisit the $1,752 level (July 8 high) prior to the critical $1,800 hurdle. The surpass of the latter could pave the way for a move to the 55-day SMA at $1,806 prior to the key 200-day SMA at $1,842. Extra upside could put the $1,857 level (June 16 peak) back on the radar before the June high at $1,879 (June 13).
Resistance levels: $1,739 $1,745 $1,752 (4H chart)
Support levels: $1,680 $1,670 $1,661 (4H chart)
-637943694819366758.png)
CRUDE WTI
After bottoming out in multi-day lows around the $93.00 mark per barrel, prices of the West Texas Intermediate sparked a corrective upside to the vicinity of the $97.00 hurdle, where it attempted to consolidate on Monday.
Daily gains in the WTI came in response to the weak tone in the US dollar, while supply concerns also collaborated with the reversion of the recent downside.
However, the upcoming FOMC event (July 27) and the prospects for further tightening by the Fed and other major central banks around the world kept fears of a global slowdown alive along with persistent jitters surrounding the demand for crude oil.
Later in the week, the API and the EIA will report on US crude oil inventories in the week to July 22.
Additionally, and in light of the next OPEC meeting on August 3, CME Group’s OPEC Watch Tool sees the probability that the cartel maintains the output increase at nearly 78% vs. almost 20% probability of further output increase.
A deeper decline in WTI continues to target the July low at $90.58 (July 14) prior to the 81.94 level (low January 24) and the 2022 low at $74.30 (January 3). On the upside, the weekly high at $104.44 (July 19) emerges as the next significant barrier prior to the July peak at $111.42 (July 5) and another weekly top at $114.00 (June 29). If bulls push harder, then a probable visit to the June high at $123.66 (June 14) could start shaping up ahead of the 2022 peak at $129.42 (March 8) and the all-time top at $147.27 (July 11 2008).
Resistance levels: $97.93 $100.69 $104.54 (4H chart)
Support levels: $93.00 $90.54 $90.05 (4H chart)
-637943695663531148.png)
DOW JONES
US equities started the week on a mixed note, as investors remained cautious ahead of the FOMC event on Wednesday, where the Fed Funds Target Range is expected to go up by 75 bps.
Tech companies performed poorly and put the tech reference Nasdaq under pressure in a week where Apple, Amazon, Alphabet and Microsoft among others are expected to report quarterly results.
Investors will also closely follow the release of the preliminary GDP figures for the April-June period and inflation tracked by the PCE.
All in all, the Dow Jones gained 0.08% at 31,924, the S&P500 shed 0.12% at 3,956 and the tech-heavy Nasdaq Composite retreated 0.61% at 11,761.
Dow Jones faces the immediate up barrier at the July peak at 32,219 (July 22) before the temporary 100-day SMA at 32,773. Further gains could see the June high at 33,272 (June 1) revisited prior to the May top at 34,117 (May 4). Next on the downside, the July low at 30,143 (July 14) should offer initial support before the 2022 low at 29,653 (June 17). If the Dow breaks below the latter it could extend the decline to the 28,902 level (low November 12 2020) before the October 2020 low at 26,143 (October 30). The RSI hovers around the vicinity of 57.
Top Performers: Chevron, Travelers, Caterpillar
Worst Performers: Salesforce.com, McDonald’s, Boeing
Resistance levels: 32,219 32,780 33,272 (4H chart)
Support levels: 30,982 30,143 29,653 (4H chart)
-637943696342012658.png)
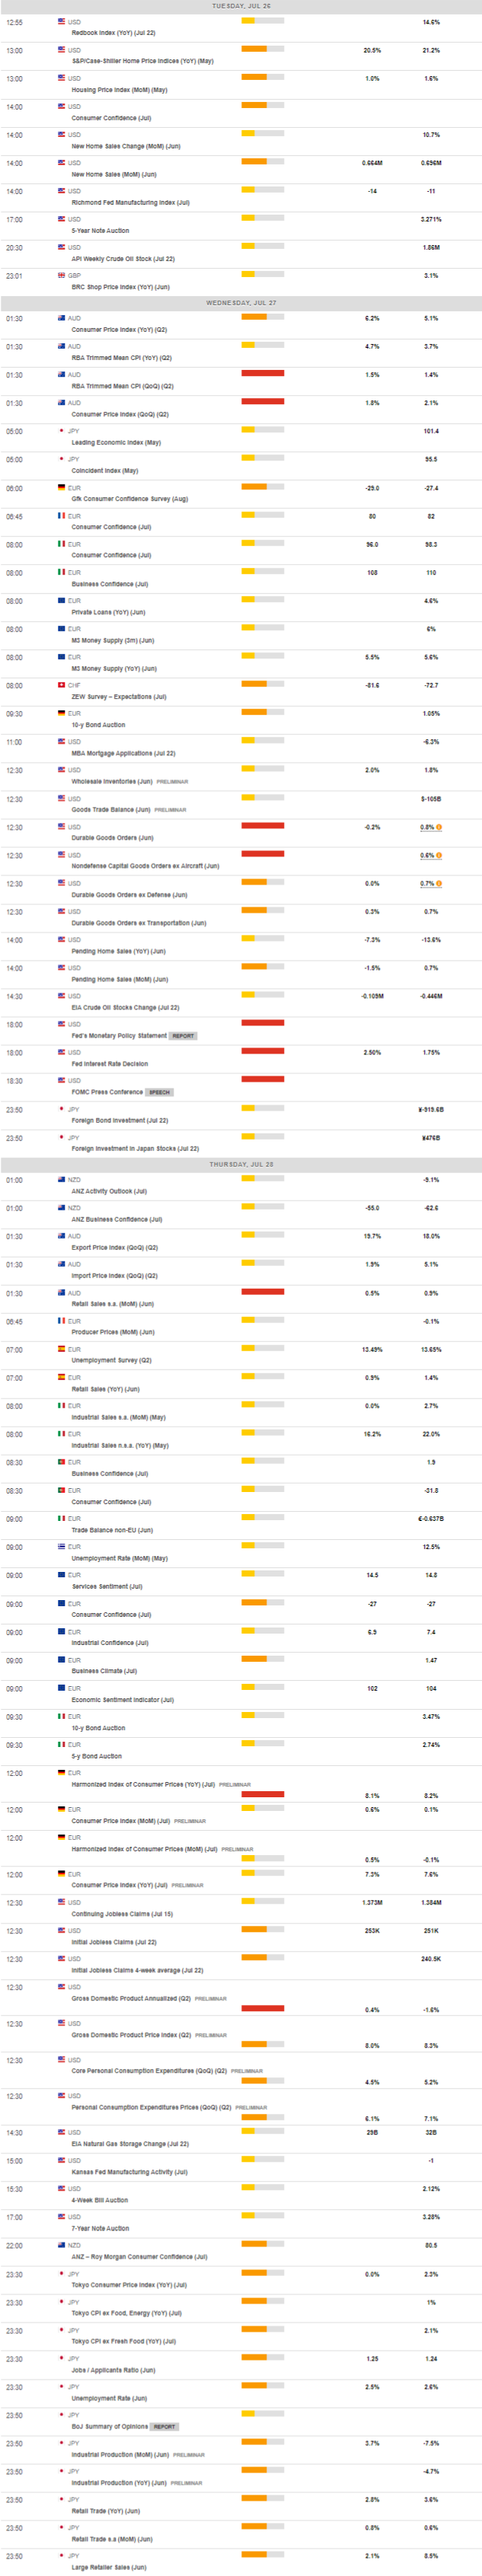
MACROECONOMIC EVENTS
All Information & Updates provided by:

All information relating to the financial markets available on this page has been prepared and issued by FXStreet (Forexstreet SL, Spain, Reg: B62498233) on the basis of publicly available information and all information believed to be reliable and does not conflict with Kuwaiti local laws, and all necessary care has been taken to before the company to ensure that the facts mentioned are correct from the source.
NCM Investment nor any of its directors or employees shall in any way be held responsible for the contents of this news, and the information contained on this page is intended only to provide clients with publicly available information and should not be construed as investment advice, report or analysis and/or constitute an offer or invitation to buy or sell financial instruments of any kind.
RISK WARNING: Forex and CFDs are highly risky leveraged products, as losses can exceed deposits. Please ensure you understand all the risks and take independent advice if necessary. NCM will segregate the clients based on the criteria of the regulator and its bylaws. NCM does not provide any advisory service; the material published does not constitute advice or a recommendation for a transaction in any financial instrument. NCM accepts no responsibility for any use of the content presented and any consequences of that use. Anyone acting on the information provided does so at their own risk.