
- Contact Us:
-

-

-

-


Daily Market Updates
27 Jul 2022
EURUSD
EUR/USD failed once again to surpass the 1.0250 region and instead sparked a deep pullback to the 1.0100 neighbourhood on Tuesday. The sharp U-turn came on the back of fresh concerns around a potential recession in the region after EU countries decided to reduce the use of gas in the next winter.
The greenback was propelled to 2-day highs past the 107.00 mark when measured by the US Dollar Index (DXY) amidst a mild recovery in US yields in the short end of the curve.
Moving forward, EUR/USD is expected to remain under pressure ahead of the key FOMC event due on Wednesday, where investors anticipate the Federal Reserve to hike the fed Funds Target Range by 75 bps to 2.25%-2.50%.
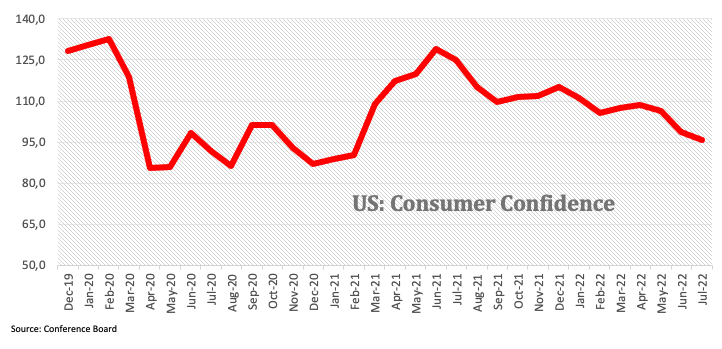
The European calendar remained empty on Tuesday, whereas the FHFA’s House Price Index rose 1.4% MoM in May, the always relevant Consumer Confidence tracked by the Conference Board eased a tad to 95.7 in July and New Home Sales contracted at a monthly 8.1%, or 0.59M units.
EUR/USD faces the immediate up barrier at the post-ECB high at 1.0278 (July 21) prior to the 55-day SMA at 1.0444. North from here comes the 5-month resistance line around 1.0490, while a break above this level should mitigate the downside pressure and allow the rebound to challenge the weekly top at 1.0615 (June 27) ahead of the June peak at 1.0773 (June 9) and the May high at 1.0786 (May 30). On the flip side, the key parity level should offer decent support prior to the 2022 low at 0.9952 (July 14). The breach of the latter should open the door to the December 2002 low at 0.9859 seconded by the October 2002 low at 0.9685. The daily RSI deflates below the 39 level.
Resistance levels: 1.0257 1.0277 1.0382 (4H chart)
Support levels: 1.0107 1.0081 1.0006 (4H chart)
-637944591386261991.png)
USDJPY
USD/JPY charted a doji-like session around 136.70 on Tuesday against the backdrop of the stronger greenback and the mixed performance of US yields across the curve: while the short end added to Monday’s gains, the belly and the long end of the curve retreated tepidly.
Indeed, the US dollar regained traction in response to the knee-jerk reaction in the risk-linked galaxy, particularly following increasing speculation of a recession in the euro area after EU countries agreed on a reduction of the use of gas in the next winter.
On another front, the Japanese currency practically ignored the publication of the BoJ Minutes, where members reinforced the current ultra-accommodative stance aimed at achieving the inflation target.
Next on the Japanese calendar will be the final figures of the Coincident Index and the Leading Economic Index, both due on Wednesday.
In case sellers regain the upper hand, USD/JPY is expected to face initial contention at the weekly low at 135.56 (July 22) followed by the July low at 134.74 (July 1). A deeper drop could see the 134.26 level (June 23 low) revisited ahead of the 55-day SMA at 133.40. Extra retracements should force the pair to retest the weekly low at 131.49 (June 16) before the psychological 130.00 mark. Immediately to the upside turns up the 2022 high at 139.38 (July 13) prior to the round level at 140.00. A move beyond the latter should open the door to the weekly top at 145.41 (August 21 1998) before the all-time peak at 147.67 (August 11 1998). The daily RSI sheds some ground and approaches 53.
Resistance levels: 136.84 137.95 138.87 (4H chart)
Support levels: 136.05 135.57 134.94 4H chart)
-637944592711052838.png)
GBPUSD
GBP/USD recorded moderate losses following three consecutive daily advances on Tuesday. The resumption of the selling bias forced cable to give away part of the recent rebound and re-check the 1.1960 region not before printing a new multi-day peak at 1.2090.
Indeed, the renewed upbeat tone in the greenback sparked a corrective move in the risk-associated universe, prompting the quid to join the rest of its peers on their way south.
On another page, there was no impact on the FX space following a bitter first debate between candidates to succeed Boris Johnson at Downing St. Rishi Sunak and Liz Truss.
In the domestic cash market, the 10y Gilt yields dropped to the lowest level since late May around 1.90%.
In the UK, minor releases saw the CBI Distributive Trades at -4 in July (from -5).
GBP/USD now faces the next up barrier at the weekly high at 1.2090 (July 26) ahead of the 55-day SMA at 1.2242. The continuation of the uptrend should expose a potential visit to the weekly top at 1.2405 (June 16) prior to the 100-day SMA at 1.2550. Up from here comes the 1.2666 level (May 27) before the psychological 1.3000 yardstick. The next down barrier emerges at the 2022 low at 1.1759 (July 14), which precedes the 2020 low at 1.1409 (March 20). The daily RSI drops a tad to the 47 region.
Resistance levels: 1.2090 1.2123 1.2165 (4H chart)
Support levels: 1.1915 1.1889 1.1759 (4H chart)
-637944592139149213.png)
AUDUSD
AUD/USD faltered just ahead of the psychological 0.7000 mark, sparking a move lower soon afterwards in response to the abrupt upside in the greenback.
Indeed, the sudden change of heart in buck hurt the sentiment in the risk complex and dragged spot lower, although the commodity space seems to have fared better, limiting the downside potential. On this, prices of the iron ore surpassed the $105.00 mark per tonne and clinched new multi-day peaks.
Absent data releases in Oz, the focus of attention is expected to be on the publication of the inflation figures for the April-June period on Wednesday.
Despite the daily downtick, further upside in AUD/USD should meet the next resistance at the July high at 0.6983 (July 22), just ahead of the key 0.7000 mark. Once cleared, the pair should attempt a move to the weekly top at 0.7069 ahead of the 100-day SMA at 0.7129 and the key 200-day SMA at 0.7180. In the opposite direction, there are no support levels of importance until the 2022 low at 0.6681 (July 14) before the May 2020 low at 0.6372 (May 4) and the weekly low at 0.6253 (April 21 2020). The daily RSI gives away some ground and retreats to 54.
Resistance levels: 0.6983 0.6995 0.7069 (4H chart)
Support levels: 0.6921 0.6889 0.6878 (4H chart)
-637944593115172249.png)
GOLD
Prices of the ounce troy of the yellow metal charted an inconclusive session around the $1,720 region on turnaround Tuesday.
The resumption of the decline in US yields – which usually is a positive for bullion – confronted the stronger bias in the greenback, all resulting in a tight range around Monday’s closing levels.
In the meantime, Gold is forecast to remain under scrutiny in the very near term ahead of the FOMC gathering on Wednesday. While a 75 bps rate hike appears largely priced in, the precious metal would closely follow the subsequent press conference by Chair Powell regarding the potential next moves by the Fed when it comes to the continuation of the current normalization of the monetary conditions.
Next on the downside for gold appears the 2022 low at $1,680 (July 21) prior to the 2021 low at $1,1676 (March 8) and the June 2020 low at $1,670 (June 5). In case the upside regains fresh oxygen, then the weekly high at $1,739 (July 22) should come to the fore seconded by the $1,752 level (July 8 top) and the critical $1,800 barrier. The breakout of this level could lead up to a test of the 55-day SMA at $1,804 ahead of the key 200-day SMA at $1,842. North from here aligns the $1,857 level (June 16 peak) prior to the June high at $1,879 (June 13).
Resistance levels: $1,739 $1,745 $1,752 (4H chart)
Support levels: $1,680 $1,670 $1,661 (4H chart)
-637944593482171940.png)
CRUDE WTI
Prices of the WTI came in short of a test of the triple-digit barrier earlier on Tuesday, motivating bears to eventually return to the market and put the commodity under some downside pressure.
The barrel of the WTI gave away all of those initial gains after the White House announced it will sell another 20M barrels of oil from the SPR by October, adding to the already announced sell of 180M barrels.
In the meantime, crude oil prices remained vigilant ahead of the FOMC event on Wednesday and continued to gauge the probability of an economic slowdown in response to the tighter monetary conditions in both the US and other major economies.
In the docket, the API will release its report on US crude oil stockpiles in the week to July 22 later on Tuesday.
Further retracements in WTI face the next support at the so far weekly low at $93.02 (July 25) ahead of the July low at $90.58 (July 14). The breach of this level could pave the way for an additional drop to the 81.94 level (low January 24) prior to the 2022 low at $74.30 (January 3). On the other hand, the initial hurdle appears at the weekly top at $104.44 (July 19) before the July high at $111.42 (July 5). If the WTI clears the latter, then it could challenge another weekly peak at $114.00 (June 29) before the June top at $123.66 (June 14), which precedes the 2022 top at $129.42 (March 8) and the all-time peak at $147.27 (July 11 2008).
Resistance levels: $97.97 $100.69 $104.54 (4H chart)
Support levels: $94.81 $93.00 $90.54 (4H chart)
-637944594263890717.png)
DOW JONES
US equities measured by the three major stock indices traded on the defensive on Tuesday.
The trigger this time was the profit warning from giant Walmart, which seem to have exacerbated concerns among retailers in the current context of elevated inflation, while the moderate pullback in Amazon also weighed on the tech sector.
In the meantime, investors remain cautious ahead of the FOMC gathering on Wednesday and the already anticipated 75 bps hike in the Fed Funds. In addition, Powell’s press conference will also be in the centre of the debate, as market participants will look for any hint regarding the Fed’s plans for the next months.
Against all that, the Dow Jones dropped 0.52% at 31,823, the S&P500 shed 1.12% at 3,922 and the tech benchmark Nasdaq Composite gave away 1.78% at 11,573.
Immediately to the upside in the Dow Jones is the July high at 32,219 (July 22), which precedes the interim 100-day SMA at 32,753. A move beyond this area could open the door to the June peak at 33,272 (June 1) ahead of the May top at 34,117 (May 4). On the other hand, sellers face the next contention at the July low at 30,143 (July 14) ahead of the 2022 low at 29,653 (June 17). The breakdown of this region exposes the 28,902 level (low November 12 2020) prior to the October 2020 low at 26,143 (October 30). The RSI comes down and retests 54.
Top Performers: 3M, McDonald’s, Coca-Cola
Worst Performers: Walmart, Nike, Salesforce.com
Resistance levels: 32,219 32,780 33,272 (4H chart)
Support levels: 30,982 30,143 29,653 (4H chart)
-637944594648741213.png)
MACROECONOMIC EVENTS

All Information & Updates provided by:

All information relating to the financial markets available on this page has been prepared and issued by FXStreet (Forexstreet SL, Spain, Reg: B62498233) on the basis of publicly available information and all information believed to be reliable and does not conflict with Kuwaiti local laws, and all necessary care has been taken to before the company to ensure that the facts mentioned are correct from the source.
NCM Investment nor any of its directors or employees shall in any way be held responsible for the contents of this news, and the information contained on this page is intended only to provide clients with publicly available information and should not be construed as investment advice, report or analysis and/or constitute an offer or invitation to buy or sell financial instruments of any kind.
RISK WARNING: Forex and CFDs are highly risky leveraged products, as losses can exceed deposits. Please ensure you understand all the risks and take independent advice if necessary. NCM will segregate the clients based on the criteria of the regulator and its bylaws. NCM does not provide any advisory service; the material published does not constitute advice or a recommendation for a transaction in any financial instrument. NCM accepts no responsibility for any use of the content presented and any consequences of that use. Anyone acting on the information provided does so at their own risk.