
- Contact Us:
-

-

-

-


Daily Market Updates
29 Jul 2022
EURUSD
EUR/USD printed marginal losses on Thursday following an earlier move to the 1.0230 region, where sellers returned to the market once again.
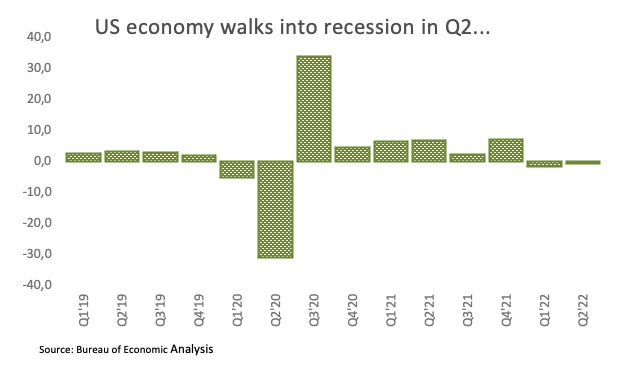
The greenback, on the other hand, came under pressure after the flash US GDP Growth Rate sees the economy contracting 0.9% in the April-June period, therefore entering a technical recession.
The pullback in the dollar was also accompanied by a moderate retracement in US yields across the curve in line with a multi-week decline in the German 10y Bund yields.
Further data in the US docket saw Initial Claims rise by 256K in the week to July 23.
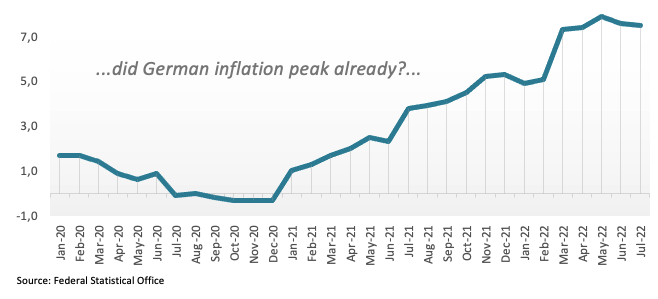
Closer to home, EMU final Consumer Confidence remained at -27 I in July, while the Economic Sentiment and the Industrial Sentiment worsened to 99 and 3.5, respectively, in the same period. In Germany, flash inflation figures now expect the CPI to rise at an annualized 7.5% in July (from 7.6%).
So far, EUR/USD appears consolidative and faces the next hurdle at the post-ECB high at 1.0278 (July 21) seconded by the 55-day SMA at 1.0435. Beyond this region appears the 5-month resistance line near 1.0470, which if cleared it should open the door to a probable move to the weekly top at 1.0615 (June 27) ahead of the June peak at 1.0773 (June 9) and the May high at 1.0786 (May 30). On the downside, the parity level should hold the initial test before the 2022 low at 0.9952 (July 14) and ahead of the December 2002 low at 0.9859 and the October 2002 low at 0.9685. The daily RSI corrects lower and revisits 41.
Resistance levels: 1.0234 1.0257 1.0277 (4H chart)
Support levels: 1.0096 1.0081 1.0006 (4H chart)
-637946330934234965.png)
USDJPY
USD/JPY sank to 6-week lows in the 134.30 region following the inconclusive direction in the greenback and the moderate decline in US yields across the pond.
Indeed, and tracked by the US Dollar Index (DXY), the buck traded in a volatile fashion, although it leant towards the downside soon after advanced US GDP figures showed the economy is seen entering a technical recession in Q2.
In addition, fresh demand for US bonds saw yields in the belly of the curve slip back to levels last seen in mid-April around 2.65%.
From the BoJ, Board member Amamiya said that the central bank keeps monitoring assets and FX developments following the recent hike by the Fed, which he said could impact on the Japanese economy and prices in the short-term. Amamiya also stressed that the BoJ pursues an average inflation of 2%, not just a temporary raise to that level, while he once again defended the current mega-loose monetary stance on the back of a shaly recovery and uncertain wage growth.
If USD/JPY accelerates the downside, then the next support of note is at the 55-day SMA at 133.64 ahead of the weekly low at 131.49 (June 16), which is considered the last defense for an assault of the psychological 130.00 mark. On the upside, the weekly high at 137.46 (July 27) emerges as the next up barrier seconded by the post-BoJ top at 138.87 (July 21) and the 2022 peak at 139.38 (July 13). Further up aligns the round level at 140.00 before the weekly high at 145.41 (August 21 1998) and the all-time top at 147.67 (August 11 1998). The daily RSI tumbles to the 40 area.
Resistance levels: 136.18 137.46 137.95 (4H chart)
Support levels: 134.33 134.26 131.49 (4H chart)
-637946331967927418.png)
GBPUSD
GBP/USD added to Wednesday’s decent gains and hit fresh 4-week highs in levels just shy of the 1.2200 mark on Thursday, just to recede a tad afterwards.
Initially, cable could not sustain the upside impetus post-FOMC and triggered a corrective downside in response to the better tone in the greenback, although the selling interest eventually dragged the buck to the negative ground.
In the UK, Car Production expanded at an annualized 5.6% in June in what was the sole release in the calendar on Thursday.
Extra gains in GBP/USD now face the July peak at 1.2191 (July 28) prior to the 55-day SMA at 1.2239. Beyond this area comes the weekly top at 1.2405 (June 16) before the 100-day SMA at 1.2530. If the rebound picks up extra pace then the pair could challenge the 1.2666 level (May 27 high) ahead of the psychological 1.3000 mark. On the flip side, the immediate contention appears at the 2022 low at 1.1759 (July 14) seconded by the 2020 low at 1.1409 (March 20). The daily RSI deflates a tad to the sub-55 area.
Resistance levels: 1.2191 1.2332 1.2405 (4H chart)
Support levels: 1.2073 1.2020 1.1963 (4H chart)
-637946331640810615.png)
AUDUSD
AUD/USD climbed to fresh tops north of the psychological 0.7000 mark, although the later recovery in the greenback prompted the Aussie dollar to give away those gains and recede to the 0.6960/50 band.
In fact, the resumption of the risk aversion sentiment in the global markets appeared accentuated after the poor results from the US Q2 GDP, which signaled the second consecutive quarter in the contraction territory.
The generalized positive performance in the commodity space also failed to lend support to AUD despite the jump in the iron ore to the vicinity of the $120.00 mark per tonne, or fresh July peaks.
On another front, Australia’s Treasurer Chalmers said earlier in the session that inflation is expected to peak at 7.75% at some point by year end, while he sees consumer prices coming down from around 5.5% by mid-2023 to 3.5% by the end of that year and around 4% by June 2024.
Data wise in Oz, preliminary figures saw Retail Sales expanding 0.2% in June vs. a month earlier.
If AUD/USD breaks above the July high at 0.7013 (July 28) it could then open the door to a potential visit to the weekly top at 0.7069 ahead of the 100-day SMA at 0.7122 and the key 200-day SMA at 0.7175. The surpass of the latter could lead up to a challenge of the June peak at 0.7282 (June 3). On the other hand, there are no contention levels of significance until the 2022 low at 0.6681 (July 14). A drop below this level could pave the way to the May 2020 low at 0.6372 (May 4) before the weekly low at 0.6253 (April 21 2020). The daily RSI loses some traction and recedes to 56.
Resistance levels: 0.7013 0.7069 0.7137 (4H chart)
Support levels: 0.6912 0.6889 0.6878 (4H chart)
-637946332306524688.png)
GOLD
Prices of the ounce troy of the precious metal edged higher for the second session in a row and managed to surpass the key $1,750 level on Thursday.
The marginal gains in the greenback coupled with the poor performance in US yields – which gathered extra downside following the US Q2 GDP release – and Powell suggesting that another unusually large rate hike will hinge on data seem to have been enough to sustain Thursday’s upside in bullion to levels past $1,750.
The new weekly high at $1,756 (July 28) now emerges as the next magnet for bulls. Once cleared, a probable return to the key $1,800 zone could start re-emerging on the horizon. This area also coincides with the 55-day SMA. The surpass of the latter should introduce a move to the 200-day SMA at $1,842 prior to the $1,857 level (June 16 top) and the June high at $1,879 (June 13). On the flip side, sellers will look to retest the 2022 low at $1,680 (July 21) before the 2021 low at $1,1676 (March 8) and the June 2020 low at $1,670 (June 5).
Resistance levels: $1,756 $1,773 $1,814 (4H chart)
Support levels: $1,711 $1,680 $1,670 (4H chart)
-637946332633698009.png)
CRUDE WTI
WTI prices came in short of the key triple-digit barrier and returned to the negative territory just above the $96.00 mark per barrel on Thursday.
Recession fears and the impact on the demand for crude oil were exacerbated after the US economy was seen contracting 0.9% in the second quarter, as per flash data from the US Commerce Department published earlier in the NA session.
In addition, and considering the upcoming OPEC+ meeting on August 3, there is more than 70% probability that the cartel would maintain the output increase according to CME Group’s OPEC+ Watch Tool.
The loss of the key 200-day SMA at $94.94 could trigger a deeper drop to, initially, the weekly low at $93.02 (July 25) prior to the July low at $90.58 (July 14). Down from here comes the 81.94 level (low January 24) ahead of the 2022 low at $74.30 (January 3). IN case bulls regain control of the market, the surpass of the psychological $100.00 mark per barrel could put the weekly top at $104.44 (July 19) back on the traders’ radar ahead of the July high at $111.42 (July 5). Extra gains should then target another weekly peak at $114.00 (June 29) before the June high at $123.66 (June 14) and the 2022 peak at $129.42 (March 8), all before the all-time top at $147.27 (July 11 2008).
Resistance levels: $99.83 $104.44 $111.42 (4H chart)
Support levels: $96.04 $94.30 $93.00 (4H chart)
-637946333253794511.png)
DOW JONES
US stocks extend the post-FOMC optimism and print decent gains on Thursday despite the latest GDP results suggesting the economy slipped back into recession territory in the April-June period.
On the latter, advanced GDP figures showed the economy is expected to shrink 0.9% in Q2, recording the second straight quarterly pullback and indicative of a technical recession.
However, investors preferred to look the other way and focus instead on the “glass half full” version, that is, the probability that the Federal Reserve could slow down the pace of its normalization process sooner rather than later.
All in all, the Dow Jones rose 1.18% at 32,577, the S&P500 gained 1.29% at 4,076 and the tech reference Nasdaq Composite advanced 1.12% at 12,167.
Immediately to the upside for Dow comes the temporary 100-day SMA at 32,726 ahead of the June peak at 33,272 (June 1) and the May top at 34,117 (May 4). On the downside, the weekly low at 31,705 (July 26) emerges as the immediate contention before the July low at 30,143 (July 14) and ahead of the 2022 low at 29,653 (June 17). A deeper decline exposes the 28,902 level (low November 12 2020) prior to the October 2020 low at 26,143 (October 30). The RSI improves past the 63 level.
Top Performers: Nike, Honeywell, Microsoft
Worst Performers: Travelers, Intel, Merck&Co
Resistance levels: 32,609 32,718 33,272 (4H chart)
Support levels: 31,705 30,982 30,143 (4H chart)
-637946333582288475.png)
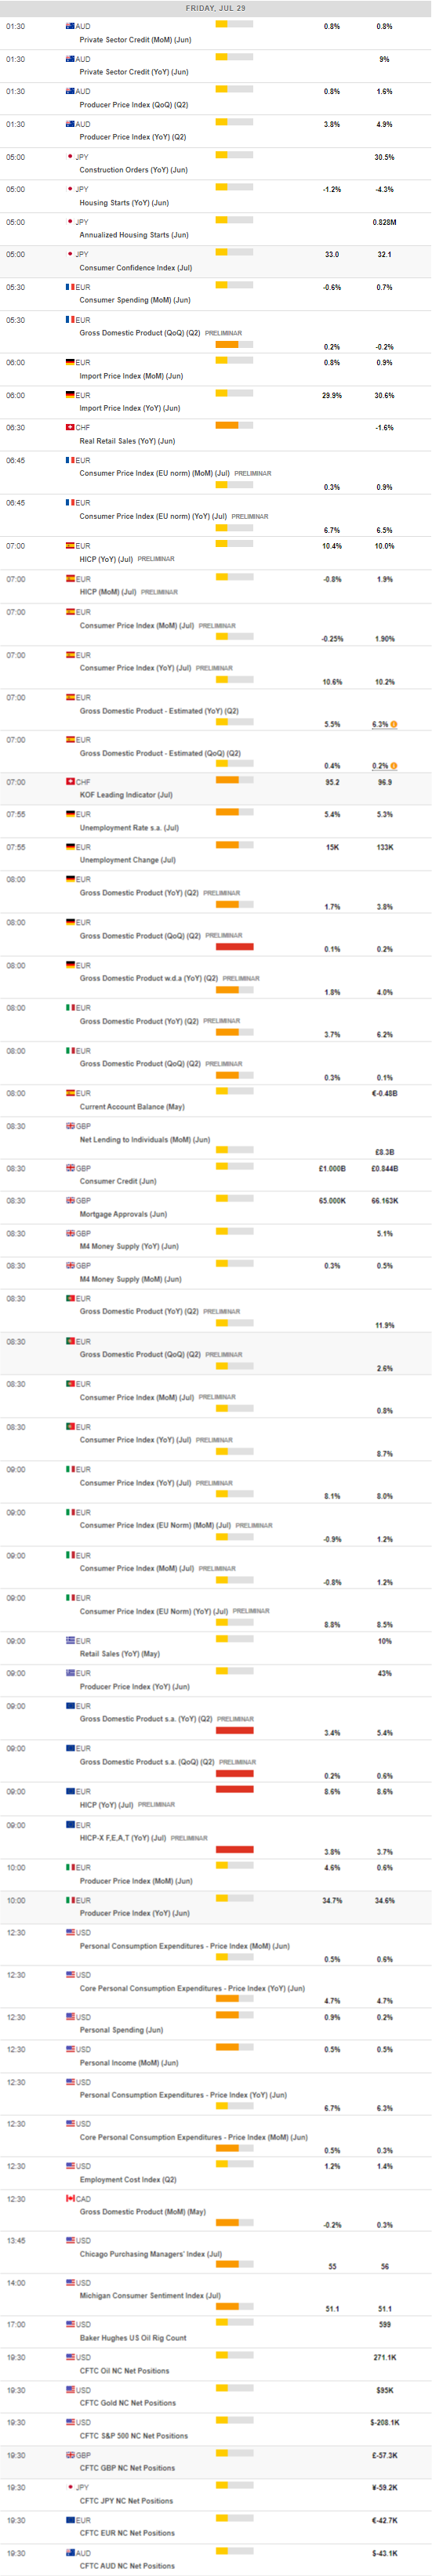
MACROECONOMIC EVENTS
All Information & Updates provided by:

All information relating to the financial markets available on this page has been prepared and issued by FXStreet (Forexstreet SL, Spain, Reg: B62498233) on the basis of publicly available information and all information believed to be reliable and does not conflict with Kuwaiti local laws, and all necessary care has been taken to before the company to ensure that the facts mentioned are correct from the source.
NCM Investment nor any of its directors or employees shall in any way be held responsible for the contents of this news, and the information contained on this page is intended only to provide clients with publicly available information and should not be construed as investment advice, report or analysis and/or constitute an offer or invitation to buy or sell financial instruments of any kind.
RISK WARNING: Forex and CFDs are highly risky leveraged products, as losses can exceed deposits. Please ensure you understand all the risks and take independent advice if necessary. NCM will segregate the clients based on the criteria of the regulator and its bylaws. NCM does not provide any advisory service; the material published does not constitute advice or a recommendation for a transaction in any financial instrument. NCM accepts no responsibility for any use of the content presented and any consequences of that use. Anyone acting on the information provided does so at their own risk.