
- Contact Us:
-

-

-

-


Daily Market Updates
01 Aug 2022
EURUSD
EUR/USD advanced for the third session in a row and flirted once again with the area around 1.0250/60 on Friday. The continuation of the upbeat tone in the pair followed another poor performance of the US dollar and yields.
On the other side of the coin, the greenback remained depressed and closed south of the 106.00 mark when gauged by the US Dollar Index (DXY), despite a futile bull run in the wake of multi-year highs in the US PCE for the month of June (+6.8% YoY).
It is worth recalling that the sentiment around the buck deteriorated further after the US economy entered technical recession – regardless of what Powell and Biden think of it – in the April-June period.
In addition, the lack of traction in yields in the US money markets also added to the pessimism around the buck, while the German 10y Bund yields managed to spark some modest gains at the end of the week.
Speaking about Germany, flash GDP figures now see the economy expanding 1.4% YoY in Q2, while the Unemployment Rate ticked higher to 5.4% and the Unemployment Change rose by 48K persons in July. In the broader Euroland, advanced GDP readings expect the economy to expand at an annualized 4.0% in Q2 and inflation to rise 8.9% in the year to July.
Across the ocean, inflation tracked by the PCE rose 6.8% YoY in June and 4.8% when it comes to the Core PCE. Additional results saw Personal Income and Personal Spending expand 0.6% MoM and 1.1% MoM, respectively in June and the final Consumer Sentiment came at 51.5 for the current month.
EUR/USD’s upside remains capped by the post-ECB top at 1.0278 (July 21). The brek above this level should put a test of the 55-day SMA at 1.0432 back on the radar ahead of the 5-month resistance line near 1.0460. Above this region, the selling pressure is expected to mitigate and lift spot to the weekly high at 1.0615 (June 27) prior to the June top at 1.0773 (June 9) and the May peak at 1.0786 (May 30). In the opposite direction, the parity level emerges as the next support of note prior to the 2022 low at 0.9952 (July 14) and ahead of the December 2002 low at 0.9859 and the October 2002 low at 0.9685. The daily RSI corrects higher and tests 47 and beyond.
Resistance levels: 1.0254 1.0277 1.0307 (4H chart)
Support levels: 1.0096 1.0081 1.0006 (4H chart)
-637948226686746682.png)
USDJPY
After dropping to new 6-week lows in the mid-132.00s, USD/JPY reversed part of those losses and ended the session with a marked retracement in the 133.20 zone on Friday.
Indeed, spot kept the late pessimism well and sound and came under extra pressure in response to further losses in the greenback and the continuation of the downtrend in US yields, this time in the belly and the long end of the curve.
In Japan, the BoJ Summary of Opinions noted that monetary tightening in the US and Europe will cause recession in the US and a negative market shock, all impacting adversely on the domestic economy. In addition, members suggested that it is difficult to see inflation consistently hitting the bank’s goal when the output gap and inflation expectations are considered.
In the docket, flash figures expect Industrial Production to contract 3.1% in the year to June, while Retail Sales expanded at an annualized 1.5% also in June. Further data saw the Consumer Confidence recede a tad to 30.2 in July (from 32.1) and Housing Starts contract 2.2% YoY in June.
If USD/JPY breaks below the July low at 132.50 (July 29) it could then open the door to a move to the 131.49 level (June 16) ahead of the psychological 130.00 mark. On the other hand, there is initial resistance at the weekly peak at 137.46 (July 27) prior to the post-BoJ high at 138.87 (July 21) and the 2022 top at 139.38 (July 13). Up from here comes the round level at 140.00 ahead of the weekly peak at 145.41 (August 21 1998) and the all-time top at 147.67 (August 11 1998). The daily RSI plummets to the 36 region.
Resistance levels: 134.59 136.17 137.46 (4H chart)
Support levels: 132.50 131.49 130.42 (4H chart)
-637948227525333043.png)
GBPUSD
GBP/USD reversed two daily pullbacks in a row and ended Friday’s session with marginal losses despite hitting fresh peaks near 1.2250. However, looking at the weekly chart, cable managed to clinch the second advance in a row after bottoming out around 1.1760 in mid-July.
The greenback, in the meantime, failed to ignite a more lasting bounce after US inflation figures tracked by the PCE rose at the fastest pace since 2005 in June and eventually succumbed to the selling pressure.
In the UK debt market, the 10y benchmark Gilt yields regained traction and rebounded moderately to the 1.97% region after hitting multi-week lows in the previous session.
In the UK calendar, Mortgage Approvals dropped to 63.726K in June and Mortgage Lending shrank to £5.273B in the same month.
Further upside in GBP/USD now needs to clear the July high at 1.2245 (July 29), an area underpinned by the proximity of the 55-day SMA. North from here, the next up barrier emerges at the weekly peak at 1.2405 (June 16) prior to the 100-day SMA at 1.2522. The surpass of the latter should open the door to the 1.2666 level (May 27 high) seconded by the psychological 1.3000 yardstick. On the downside, there is initial contention at the 2022 low at 1.1759 (July 14) before the 2020 low at 1.1409 (March 20). The daily RSI recedes to the sub-57 area.
Resistance levels: 1.2245 1.2332 1.2405 (4H chart)
Support levels: 1.2074 1.2020 1.1963 (4H chart)
-637948227134349193.png)
AUDUSD
AUD/USD charted an inconclusive session and could not sustain a bullish attempt to fresh 6-week highs near 0.7030 at the end of the week, ending the week in the sub-0.7000 region.
The pair could not capitalize on the later pullback in the dollar, as the US Dollar Index (DXY) quickly faded the advance in response to higher-than-expected US inflation figures measured by the PCE during June.
The generalized positive performance in the commodity space along with another uptick in prices of the tonne of iron ore failed to lend support to the Aussie dollar.
Data wise Down Under, Producer Prices rose 1.4% QoQ in the April-June period and 5.6% over the last twelve months.
Despite the daily retracement, price action suggests further near-term upside in AUD/USD. Against that, there is initial hurdle at the July high at 0.7031 (July 29), which precedes the weekly peak at 0.7069 before the 100-day SMA at 0.7120. Further north emerges the key 200-day SMA at 0.7173 prior to the June top at 0.7282 (June 3). On the flip side, the resumption of the selling bias is expected to meet the next support of note at the 2022 low at 0.6681 (July 14) ahead of the May 2020 low at 0.6372 (May 4) and the weekly low at 0.6253 (April 21 2020). The daily RSI loses momentum and approaches 58.
Resistance levels: 0.7031 0.7069 0.7137 (4H chart)
Support levels: 0.6911 0.6889 0.6878 (4H chart)
-637948227913730817.png)
GOLD
Gold prices advanced for the third straight session on Friday, gaining nearly 3% in the last three days, although recording the fourth consecutive month in the red territory, including a drop to the $1,680 region per ounce troy on July 21, an area las seen nearly a year ago.
Friday’s improvement in the precious metal came on the back of the higher-than-expected US inflation figures tracked by the PCE – the Fed’s preferred gauge – during June, suggesting that elevated inflation appears far from abating for the time being.
Another driver of the weekly upside in bullion was the poor preliminary US GDP figures, which showed the US economy slipping back to recession after contracting 0.9% in the April-June period.
Finally, the yellow metal also gathered traction after the FOMC signaled that further large rate hikes appear unlikely, although further tightening is still needed and the pace of future rate hikes will depend on data.
The continuation of the current bullish move in gold needs to clear the July high at $1,766 (July 29) to allow for a move to the key $1,800 area in the relatively near term, which remains supported by the 55-day SMA. Beyond the zone of resistance emerges the 200-day SMA at $1,842 ahead of the $1,857 level (June 16 peak) and the June top at $1,879 (June 13). The initial down barrier, in the meantime, aligns at the weekly low at $1,711 (July 27) before the 2022 low at $1,680 (July 21). Further losses could see the 2021 low at $1,1676 (March 8) revisited ahead of the June 2020 low at $1,670 (June 5).
Resistance levels: $1,767 $1,771 $1,814 (4H chart)
Support levels: $1,752 $1,711 $1,680 (4H chart)
-637948228285292867.png)
CRUDE WTI
Prices of the barrel of American reference for the sweet light crude oil faded Thursday’s pullback and ended the week on a positive note, reversing at the same time three weeks in a row closing with losses.
Indeed, prices of the WTI advanced to the vicinity of the $102.00 mark earlier in the session, although they gave away part of those gains and ended the day once again below the key $100.00 level.
The optimism among traders was this time sustained by speculation that the OPEC+ could maintain its production unchanged for the month of September at its meeting on August 3. On this, CME Group’s OPEC+ Watch Tool sees the probability of that outcome at more than 66%.
In the docket, driller Baker Hughes informed that US oil rig count went up by 6 in the week to July 29, taking the total US active oil rigs to 605.
Further upside in prices of the WTI still targets the weekly high at $104.44 (July 19) prior to the July top at $111.42 (July 5). The breakout of this level could open the door to the weekly high at $114.00 (June 29) ahead of June peak at $123.66 (June 14) and the 2022 top at $129.42 (March 8). Further north should emerge the all-time high at $147.27 (July 11 2008). Bears, on the flip side, need to breach the key 200-day SMA at $95.02 on a sustainable fashion to allow a potential decline to the weekly low at $93.02 (July 25) ahead of the July low at $90.58 (July 14). The loss of the later could put the 81.94 level (low January 24) back on the radar before the 2022 low at $74.30 (January 3).
Resistance levels: $101.87 $104.44 $111.42 (4H chart)
Support levels: $96.04 $94.30 $93.00 (4H chart)
-637948229082337958.png)
DOW JONES
US equities extended the upbeat tone on Friday and closed near weekly highs after all three major stock indices had their best month since 2020.
Against that, the Dow Jones advanced 0.97% at 32,845, the S&P500 rose 1.42% at 4,130 and the tech-heavy Nasdaq Composite gained 1.66% at 12,390.
The sentiment among investors improved following better-than-expected earnings reports throughout the week, particularly in the tech sector, while expectations that the Fed may slow the pace of its normalization process also added to the positive mood.
Next on the upside for the Dow aligns the July high at 32,910 (July 29) prior to the June top at 33,272 (June 1) and the May peak at 34,117 (May 4). In case sellers return to the market, the weekly low at 31,705 (July 26) is expected to hold the initial test ahead of the July low at 30,143 (July 14). The breach of the latter could open the door to a test of the 2022 low at 29,653 (June 17) prior to the 28,902 level (low November 12 2020) and the October 2020 low at 26,143 (October 30). The RSI leaps above the 65 level.
Top Performers: Chevron, Caterpillar, Apple
Worst Performers: Intel, Procter&Gamble, Amgen
Resistance levels: 32,910 33,272 34,117 (4H chart)
Support levels: 31,534 30,982 30,143 (4H chart)
-637948229432999409.png)
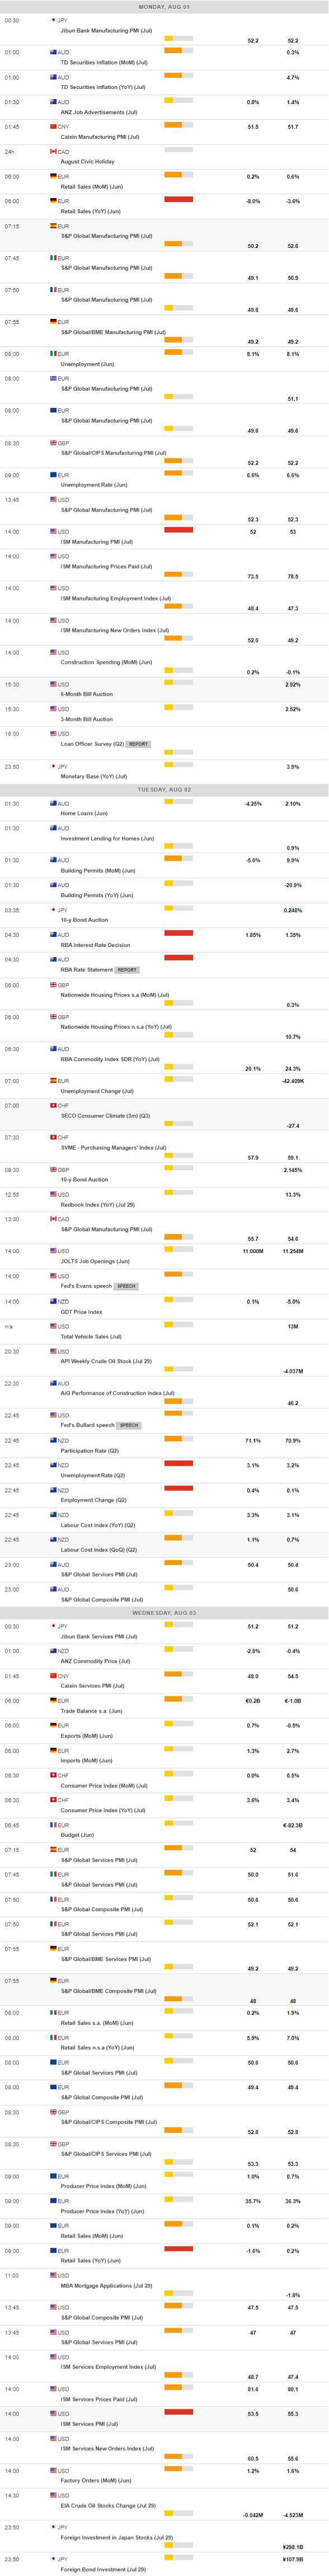
MACROECONOMIC EVENTS
All Information & Updates provided by:

All information relating to the financial markets available on this page has been prepared and issued by FXStreet (Forexstreet SL, Spain, Reg: B62498233) on the basis of publicly available information and all information believed to be reliable and does not conflict with Kuwaiti local laws, and all necessary care has been taken to before the company to ensure that the facts mentioned are correct from the source.
NCM Investment nor any of its directors or employees shall in any way be held responsible for the contents of this news, and the information contained on this page is intended only to provide clients with publicly available information and should not be construed as investment advice, report or analysis and/or constitute an offer or invitation to buy or sell financial instruments of any kind.
RISK WARNING: Forex and CFDs are highly risky leveraged products, as losses can exceed deposits. Please ensure you understand all the risks and take independent advice if necessary. NCM will segregate the clients based on the criteria of the regulator and its bylaws. NCM does not provide any advisory service; the material published does not constitute advice or a recommendation for a transaction in any financial instrument. NCM accepts no responsibility for any use of the content presented and any consequences of that use. Anyone acting on the information provided does so at their own risk.