
- Contact Us:
-

-

-

-


Daily Market Updates
02 Aug 2022
EURUSD
EUR/USD secured the fourth consecutive session with gains on Monday, although a break above the key 1.0270/80 resistance band still remained elusive for bulls.
Indeed, the persistent bias towards the riskier assets lent extra legs to the European currency and kept dollar-buyers at bay and forced the US Dollar Index (DXY) to retest new 4-week lows in the 105.30 zone.
Further improvement in the risk sentiment also reflected on the US and German cash markets, where yields attempted a mild bounce despite maintaining the trade in the lower end of the range.
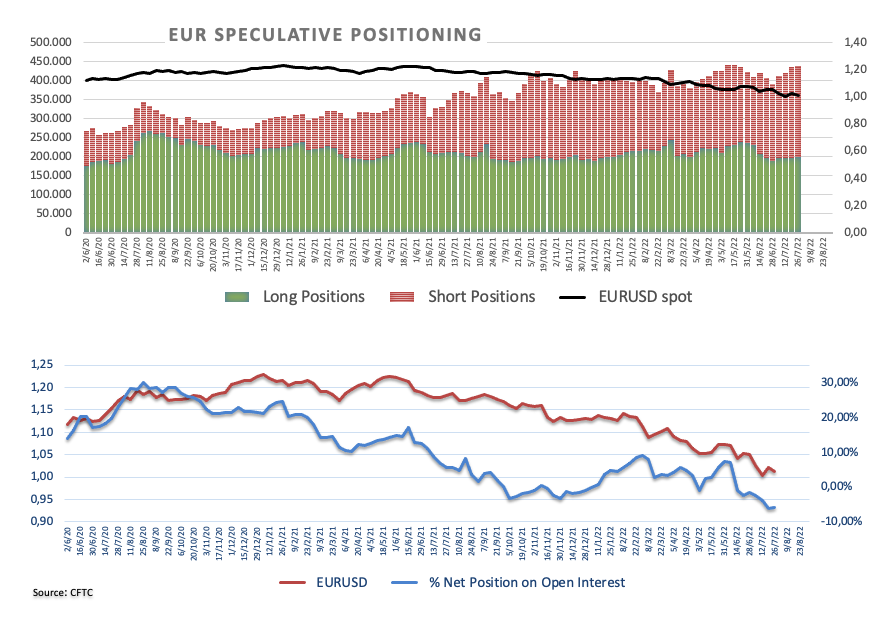
From the speculative community, and always according to the CFTC Positioning Report for the week ended on July 26, net shorts in the European currency retreated to 2-week lows, as market participants were digesting the ECB’s first rate hike ahead of the key FOMC event on July 27.
In the European docket, German Retail Sales contracted 8.8% in the year to June and the final Manufacturing PMI came at 49.3 in July. In the broader Euroland, final figures saw the Manufacturing PMI at 49.8 during last month, while the Unemployment Rate stayed unchanged at 6.6%.
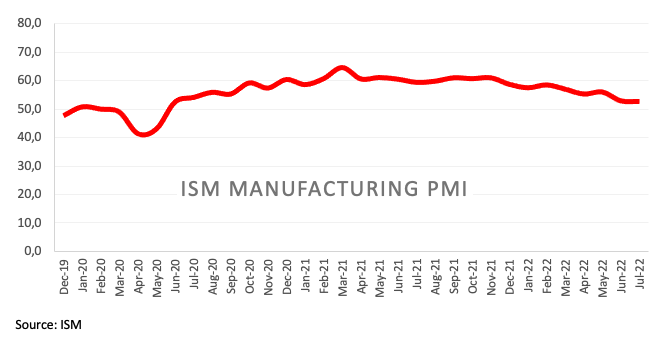
In the US, the final Manufacturing PMI eased to 52.2 in July, the always relevant ISM Manufacturing surpassed estimates at 52.8 in the same period and Construction Spending contracted 1.1% in June vs. the previous month.
Further upside in EUR/USD still needs to leave behind the post-ECB high at 1.0278 (July 21) to allow for a probable move to the 55-day SMA at 1.0429. Further up emerges the 6-month resistance line near 1.045. The pair could see its downside pressure alleviated once this area is cleared. Against that, the next up barrier should appear at the weekly peak at 1.0615 (June 27) ahead of the June top at 1.0773 (June 9) and the May high at 1.0786 (May 30). On the downside, the breach of the weekly low at 1.0096 (July 27) should pave the way for a visit to the parity level before the 2022 low at 0.9952 (July 14) and prior to the December 2002 low at 0.9859. The daily RSI improves a tad beyond the 48 mark.
Resistance levels: 1.0269 1.0277 1.0307 (4H chart)
Support levels: 1.0145 1.0113 1.0096 (4H chart)
-637949773439097606.png)
USDJPY
Sellers did not give up around USD/JPY and dragged it to the sub-132.00 area for the first time since mid-June on Monday.
The lack of traction in US yields in combination with the persevering sell-off in the greenback prompted the pair to print the fourth consecutive session with losses against the backdrop of investors’ preference of the riskier assets.
Indeed, US yields in the belly and the long end of the curve kept the downtrend well in place around 2.61% and 2.96%, respectively, vs. a lacklustre advance in the short end.
In the Japanese calendar, final results saw the Jibun Bank Manufacturing PMI at 52.1 in July (from 52.7).
Bears in USD/JPY now look to revisit the 131.49 level (June 16 low), which stands as the latest defense before a test of the psychological 130.00 yardstick. This area of contention appears propped up by the 100-day SMA at 130.09. The loss of this level exposes a deeper pullback to the May low at 126.36 (May 24). Immediately to the upside comes the interim 55-day SMA at 133.77 ahead of the weekly high at 137.46 (July 27) and before the post-BoJ top at 138.87 (July 21). The surpass of this level could open the door to the 2022 peak at 139.38 (July 13) prior to the round level at 140.00. The daily RSI already flirts with the oversold territory around 33.
Resistance levels: 134.59 136.09 137.46 (4H chart)
Support levels: 131.81 131.49 130.42 (4H chart)
-637949774658318415.png)
GBPUSD
GBP/USD advanced to fresh 2-month highs near 1.2300 on Monday, already gaining more than 5 cents since YTD lows in the 1.1760 recorded in mid-July.
The favourable context for the risk-associated assets lent further oxygen to the sterling amidst the intense sell-off in the greenback, while the not-so-bad print from the Manufacturing PMI in July also collaborated with the pair’s upside.
In line with the cash markets around the world, the UK 10y Gilt yields remained depressed and navigated to multi-week lows around 1.85%.
In the UK, final figures saw the Manufacturing PMI recede a tad to 52.2 in July.
Bulls now target the weekly high at 1.2332 (June 27) ahead of another weekly top at 1.2405 (June 16) and the 100-day SMA at 1.2515. North of this area, the 1.2666 level (May 27 high) could return to the radar, while there are no hurdles of note in case of the breakout of the latter until the psychological 1.3000 mark. On the flip side, no contention of relevance is seen until the 2022 low at 1.1759 (July 14) ahead of the 2020 low at 1.1409 (March 20). The daily RSI ticks higher and surpasses 62.
Resistance levels: 1.2293 1.2332 1.2405 (4H chart)
Support levels: 1.2079 1.2020 1.1963 (4H chart)
-637949774265108611.png)
AUDUSD
AUD/USD extended the upside further north of the psychological 0.7000 mark and clocked new 2-month peaks near 0.7050 at the beginning of the week.
Mixed Chinese PMIs over the weekend in combination with the diversified performance of the commodity space on Monday somewhat supported the uptick in spot, although the persistent weakness hitting the US dollar can be found as the main driver for the pair’s upside.
In the Aussie debt market, the 10y AGB yields snapped three consecutive daily pullbacks and climbed to the 3.15% region.
In Australia, the Ai Group Manufacturing Index deflated to 52.5 in July (from 54.0) and the final Manufacturing PMI tracked by S&P Global came at 55.7 (from 56.2).
AUD/USD now trades at shouting distance from the weekly top at 0.7069. Further up aligns the interim 100-day SMA at 0.7118, which precedes the key 200-day SMA at 0.7170. The breakout of the latter could open the door to a move to the June peak at 0.7282 (June 3). In the opposite direction, sellers should meet the next support of significance at the 2022 low at 0.6681 (July 14) prior to the May 2020 low at 0.6372 (May 4) and the weekly low at 0.6253 (April 21 2020). The daily RSI climbs higher and trespasses 62.
Resistance levels: 0.7047 0.7069 0.7137 (4H chart)
Support levels: 0.6911 0.6889 0.6878 (4H chart)
-637949775056414275.png)
GOLD
Traders remained optimistic around the precious metal on Monday.
Indeed, gold prices extended the uptrend for the fourth session in a row and met a new resistance in daily peaks around $1,775 per ounce troy.
The relentless weakness surrounding the greenback in combination with declining US yields across the curve helped the yellow metal extend the upside bias for yet another session, while recession talk also played its part sustaining the upbeat tone in the low-yielder metal.
The continuation of the march north in gold now targets the key $1,800 area, which in turn appears underpinned by the 55-day SMA. The surpass of this area should pave the way for a potential move to the 200-day SMA at $1,842 prior to the 100-day SMA at $1,851 and the $1,857 level (June 16 high). If sellers regain some control there is a minor contention at the weekly low at $1,711 (July 27) ahead of the 2022 low at $1,680 (July 21). The breach of the latter leaves the metal vulnerable to a deeper decline to the 2021 low at $1,1676 (March 8) prior to the June 2020 low at $1,670 (June 5).
Resistance levels: $1,775 $1,814 $1,825 (4H chart)
Support levels: $1,752 $1,711 $1,680 (4H chart)
-637949775812017010.png)
CRUDE WTI
WTI prices briefly dropped to fresh 3-week lows in the $92.40 region, just to regain some composure soon afterwards on Monday.
In fact, the commodity traded well into the negative territory and faded Friday’s advance as investors showed concerns over a potential global slowdown that could directly impact the crude oil demand, as emerged from the deterioration of the manufacturing sector on both sides of the Atlantic during last month.
The cautious note around crude oil should remain in place ahead of the key OPEC+ meeting on August 3. According to CME Group’s OPEC+ Watch Tool, the probability that the cartel could stick with the current output increase is at 77%, while the chances of a further output increase surpass 17%.
As usual, the EIA and the API will report on the weekly US crude oil supplies change in the week to July 29 on Tuesday and Wednesday, respectively.
A drop below $92.44 (August 1) should open the door to a probable visit to the July low at $90.58 (July 14) prior to the 81.94 level (low January 24) and before the 2022 low at $74.30 (January 3). Occasional bullish attempts, in the meantime, face the next hurdle at the weekly peak at $101.87 (July 29) followed by another weekly top at $104.44 (July 19). Extra gains from here should target the July high at $111.42 (July 5) ahead of the weekly top at $114.00 (June 29) and the June peak at $123.66 (June 14). The breakout of this level should lead up to a move to the 2022 top at $129.42 (March 8).
Resistance levels: $101.87 $104.44 $111.42 (4H chart)
Support levels: $92.42 $90.54 $89.00 (4H chart)
-637949776565286446.png)
DOW JONES
Equities tracked by the three major US stock indices shed part of last week’s advance and started the week/month on the back foot. That said, the Dow Jones retreated 0.34% at 32,739, the S&P500 dropped 0.54% at 4,108 and the tech benchmark Nasdaq Composite lost 0.45% at 12,334.
Investors remained prudent and many cashed up part of the solid gains made during July, as recession chatter continued to hover around the markets, while results from the US manufacturing sector surpassed initial expectations in July in contrast with readings seen in Europe and Asia earlier in the day.
The next up barrier for the Dow Jones appears at the so far weekly peak at 32,972 (August 1) ahead of the June high at 33,272 (June 1) and the May top at 34,117 (May 4). If the buying mood gathers further impulse, then a test of the April top at 35,492 (April 21) should re-emerge on the horizon. On the downside, the weekly low at 31,705 (July 26) should initially offer decent support prior to the July low at 30,143 (July 14). Down from here turns up the 2022 low at 29,653 (June 17) before the 28,902 level (low November 12 2020) and the October 2020 low at 26,143 (October 30). The RSI looks stable beyond 65.
Top Performers: Boeing, Procter&Gamble, Home Depot
Worst Performers: Chevron, Dow, Caterpillar
Resistance levels: 32,979 33,272 34,117 (4H chart)
Support levels: 31,705 31,534 30,982 (4H chart)
-637949776939486452.png)
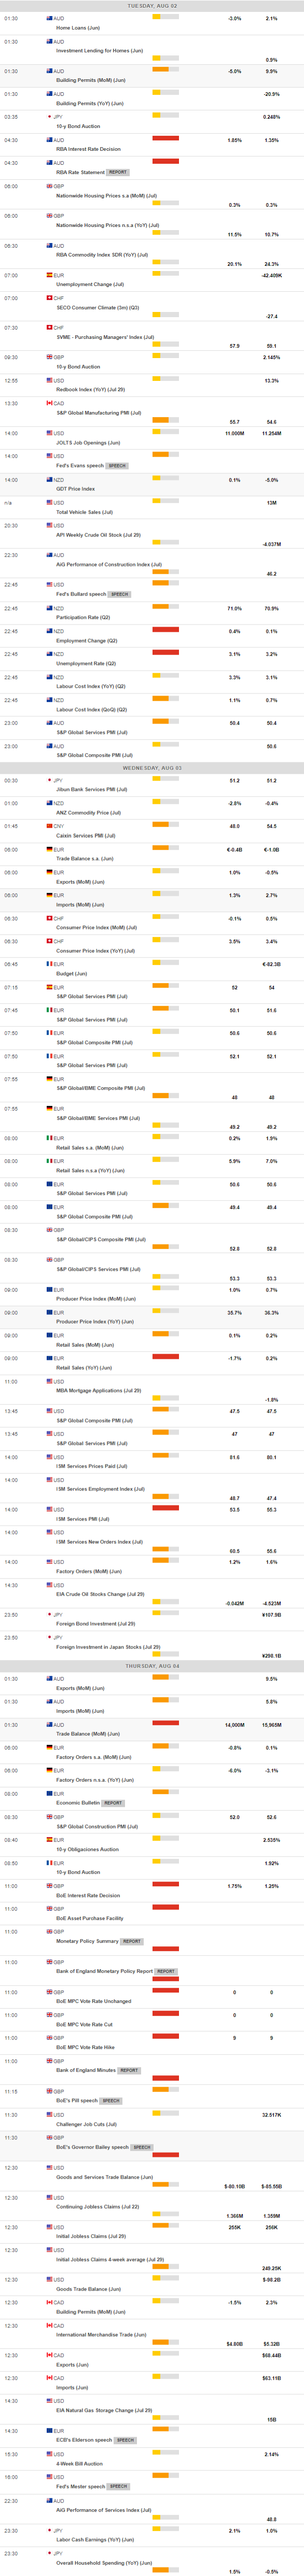
MACROECONOMIC EVENTS
All Information & Updates provided by:

All information relating to the financial markets available on this page has been prepared and issued by FXStreet (Forexstreet SL, Spain, Reg: B62498233) on the basis of publicly available information and all information believed to be reliable and does not conflict with Kuwaiti local laws, and all necessary care has been taken to before the company to ensure that the facts mentioned are correct from the source.
NCM Investment nor any of its directors or employees shall in any way be held responsible for the contents of this news, and the information contained on this page is intended only to provide clients with publicly available information and should not be construed as investment advice, report or analysis and/or constitute an offer or invitation to buy or sell financial instruments of any kind.
RISK WARNING: Forex and CFDs are highly risky leveraged products, as losses can exceed deposits. Please ensure you understand all the risks and take independent advice if necessary. NCM will segregate the clients based on the criteria of the regulator and its bylaws. NCM does not provide any advisory service; the material published does not constitute advice or a recommendation for a transaction in any financial instrument. NCM accepts no responsibility for any use of the content presented and any consequences of that use. Anyone acting on the information provided does so at their own risk.