
- Contact Us:
-

-

-

-


Daily Market Updates
04 Aug 2022
EURUSD
EUR/USD could not sustain the earlier advance to the area north of the 1.0200 yardstick and triggered a corrective move that added to Tuesday’s losses in the 1.0150 zone.
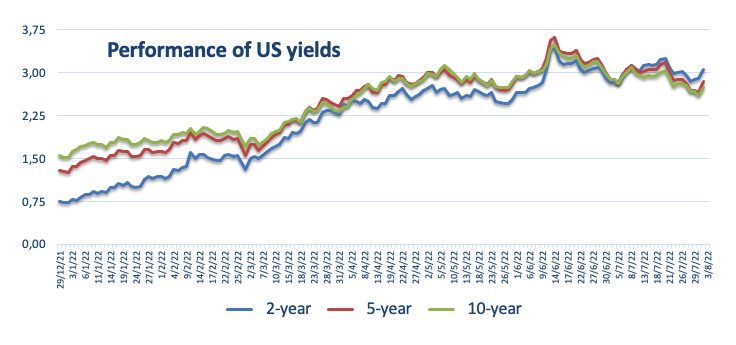
The favourable context for the dollar was also underpinned by better-than-expected results from the US docket as well as by higher US yields, particularly on the back of hawkish messages from Fed’s rate-setters Mester, Daly, Bullard and Evans on Tuesday.
Against that, the US Dollar Index (DXY) reversed the initial pullback and managed to climb as high as the 106.80 region soon after the release of the ISM Non-Manufacturing, shedding some ground afterwards.
In the euro docket, the German trade surplus widened to €6.4B in June, while the final Services PMI came at 49.7 in July. In the broader euro bloc, the same gauge surpassed estimates at 51.2, although Retail Sales contracted 3.7% in the year to June.
Across the Atlantic, MBA Mortgage Applications expanded 1.8% in the week to July 29, the final Services PMI retreated to 47.3 in July, Factory Orders expanded 2.0% MoM in June and the key ISM Non-Manufacturing surprised to the upside and climbed to 56.7 during last month.
-637951479370607641.png)
A more serious rebound would need EUR/USD to clear the so far August high at 1.0293 (August 2). Beyond this level initially comes the 55-day SMA at 1.0417 prior to the 6-month resistance line near 1.0440. The recovery is expected to gather further steam on a break above this resistance area and therefore it could open the door to the weekly peak at 1.0615 (June 27) ahead of the June top at 1.0773 (June 9) and the May high at 1.0786 (May 30). On the downside, the weekly low at 1.0096 (July 27) should hold the initial test before the parity level, while the loss of the latter could lead up to another visit to the 2022 low at 0.9952 (July 14) prior to the December 2002 low at 0.9859. The daily RSI worsens a little and drops near the 43 level.
Resistance levels: 1.0199 1.0293 1.0462 (4H chart)
Support levels: 1.0122 1.0113 1.0096 (4H chart)
-637951478409751691.png)
USDJPY
The continuation of the upside bias in US yields and further upside in the greenback all favoured further depreciation in the Japanese yen on Wednesday, sending USD/JPY to new 3-day highs to the 134.50 region, an area coincident with the 55-day SMA.
In fact, the recent sharp rebound in US yields to multi-session peaks across the curve came after FOMC governors suggested that further tightening remains well on the table in the next months in a context where inflation still gives no sign of losing traction.
In the Japanese calendar, the final Jibun Bank Services PMI deflated to 50.3 in July (from 54.0).
USD/JPY faces a minor up barrier at the weekly top at 137.46 (July 27) followed by the post-BoJ high at 138.87 (July 21). Once cleared, the pair should refocus on the 2022 top at 139.38 (July 13) prior to the round level at 140.00. On the flip side, there should be decent contention at the so far August low at 130.39 (August 2), which appears bolstered by the 100-day SMA. The loss of this region should put the pair en route toa test of the psychological 130.00 mark ahead of the May low at 126.36 (May 24) and the key 200-day SMA at 122.53. The daily RSI rebounds above the 44 level.
Resistance levels: 134.55 136.01 137.42 (4H chart)
Support levels: 130.39 129.51 126.55 (4H chart)
-637951480500128291.png)
GBPUSD
In line with the majority of the risk complex, the sterling suffered another positive session in the US dollar and forced GBP/USD to remain in the negative territory and well below the key barrier at 1.2200 on Wednesday.
The initial selling bias in the US dollar reappeared as the risk aversion that dominated markets’ sentiment in the previous session dissipated after the end of Pelosi’s trip to Taiwan. However, solid prints from the US calendar motivated the buck to regain composure and erode the earlier pullback.
The offered bias around the quid came in tandem with the continuation of the rebound in the UK 10y Gilt yields to the vicinity of the 2.00% area.
In the UK docket, the always relevant Services PMI remained in the expansion territory in July despite easing to 52.6 (from 54.3). The next key event in the calendar will be the BoE monetary policy meeting on Thursday, where consensus expects the “Old Lady” to hike the policy rate by 50 bps.
Further upside in GBP/USD targets the so far August top at 1.2293 (August 1) ahead of the weekly high at 1.2332 (June 27). Beyond the latter, cable could challenge another weekly peak at 1.2405 (June 16) prior to the 100-day SMA at 1.2496 and the 1.2666 level (May 27 high), which precedes the psychological 1.3000 yardstick. In the opposite direction, the next support of importance comes at the 2022 low at 1.1759 (July 14) before the 2020 low at 1.1409 (March 20). The daily RSI edges lower to the 53 zone.
Resistance levels: 1.2293 1.2332 1.2405 (4H chart)
Support levels: 1.2100 1.2079 1.2020 (4H chart)
-637951479980062065.png)
AUDUSD
AUD/USD managed to reclaim part of the ground lost on Tuesday’s deep decline despite the greenback managing to regain composure following a negative start of the session.
Indeed, the Aussie dollar recorded decent gains vs. the buck, although it could not retest the key 0.7000 zone despite the favourable context in the risk appetite trends and against the backdrop of the mixed tone in the commodity complex.
On the latter, another downtick in prices of the tone of iron ore also limited the upside potential in the pair.
Data wise Down Under, the final Services PMI eased to 50.9 in July (from 52.6) and final results showed Retail Sales expanded 0.2% MoM in June.
Further weakness lies ahead for AUD/USD in case the August low at 0.6886 (August 3) is breached. Against that, the pair could attempt a move to the 2022 low at 0.6681 (July 14) ahead of the May 2020 low at 0.6372 (May 4) and the weekly low at 0.6253 (April 21 2020). Occasional bullish attempts should meet the next up barrier at the August top at 0.7047 (August 1) before the weekly high at 0.7069. The surpass of the latter could open the door to a potential test of the temporary 100-day SMA at 0.7112, which precedes the key 200-day SMA at 0.7164 ahead of the June peak at 0.7282 (June 3). The daily RSI regains poise and approaches the 52 level.
Resistance levels: 0.6966 0.7047 0.7069 (4H chart)
Support levels: 0.6886 0.6858 0.6802 (4H chart)
-637951480983549423.png)
GOLD
Prices of the ounce troy of gold traded in an inconclusive fashion on Wednesday, hovering around the $1,760 region and recording marginal losses for the day.
The recovery in the greenback followed solid prints from the US calendar and put the yellow metal under pressure, while further gains in US yields across the curve also collaborated with the daily pullback.
The better-than-expected results from the ISM Non-Manufacturing and Factory Orders seem to have removed strength from the perception that the US economy entered recession in the April-June period, therefore curtailing tailwinds in bullion.
The continuation of the leg lower in gold should now face the next support at the weekly low at $1,711 (July 27) ahead of the 2022 low at $1,680 (July 21). If breached, then the yellow metal could attempt a move to the 2021 low at $1,1676 (March 8) prior to the June 2020 low at $1,670 (June 5). The next up barrier, in the meantime, comes at the August top at $1,788 (August 2) just before the critical $1,800 mark, which remains reinforced by the 55-day SMA ($1,797). Up from here aligns the 200-day SMA at $1,841 closely followed by the 100-day SMA at $1,847 and the $1,857 level (June 16 high).
Resistance levels: $1,788 $1,814 $1,825 (4H chart)
Support levels: $1,752 $1,711 $1,680 (4H chart)
-637951481323069072.png)
CRUDE WTI
Prices of the West Texas Intermediate debilitated to new 3-week lows in the sub-$91.00 region on Wednesday.
In fact, WTI prices gathered extra downside pressure after the OPEC+ meeting said the cartel will increase its oil production by only 100 kbpd in September, a raise that came well short of US expectations.
Further news undermining the sentiment surrounding the commodity noted US and Iran officials are expected to meet in Vienna to resume negotiations to revive the 2015 Tehran nuclear deal.
Still on the negatives for the WTI, the EIA reported a 4.467M barrels build in US crude oil stockpiles in the week to July 29, while supplies at Cushing increased by 0.926M barrels and gasoline inventories went up by 0.163M barrels. Late on Tuesday, the API said US crude oil supplies unexpectedly went up by 2.165M barrels.
Extra losses in the WTI should see the July low at $90.58 (July 14) revisited sooner rather than later. The loss of this level should expose a deeper drop to the 81.94 level (low January 24) prior to the 2022 low at $74.30 (January 3). In the opposite direction, the resumption of the buying interest should refocus on the weekly high at $101.87 (July 29) prior to the weekly top at $104.44 (July 19) and the July peak at $111.42 (July 5). The surpass of the latter should pave the way for the commodity to challenge the weekly high at $114.00 (June 29) before the June peak at $123.66 (June 14) and the 2022 top at $129.42 (March 8).
Resistance levels: $96.55 $101.87 $104.44 (4H chart)
Support levels: $90.81 $90.54 $89.00 (4H chart)
-637951482030183070.png)
DOW JONES
Equities tracked by the three major US stock indices rebounded sharply on Wednesday on the back of firmer prints from the US docket for the months of June and July, which appear to have mitigated ongoing recession jitters somewhat.
Indeed, optimism among market participants remained on the rise after Factory Orders and the key ISM Non-Manufacturing surprised to the upside in Wednesday’s calendar.
In addition, investors seem to have perceived as positive the recent visit to Taiwan by US Speaker N.Pelosi, which eventually underpinned the upbeat mood in the session.
All in all, the Dow Jones advanced 1.29% at 32,814, the S&P500 gained 1.53% at 4,153 and the tech-heavy Nasdaq Composite rose 2.52% at 12,660.
Further recovery in the Dow Jones continues to target the so far August peak at 32,972 (August 1) followed by the June top at 33,272 (June 1) and the key 200-day SMA at 33,992. The surpass of this area could open the door to a visit to the May high at 34,117 (May 4) ahead of the April peak at 35,492 (April 21). On the flip side, there is immediate contention at the weekly low at 31,705 (July 26) before the July low at 30,143 (July 14) and the 2022 low at 29,653 (June 17). A deeper pullback could see the 28,902 level (low November 12 2020) revisited ahead of the October 2020 low at 26,143 (October 30). The RSI gathers traction and advances beyond 62.
Top Performers: Walt Disney, Apple, Salesforce.com
Worst Performers: Chevron, Walmart, Walgreen Boots
Resistance levels: 32,972 33,272 34,117 (4H chart)
Support levels: 32,387 31,705 31,534 (4H chart)
-637951482376235156.png)
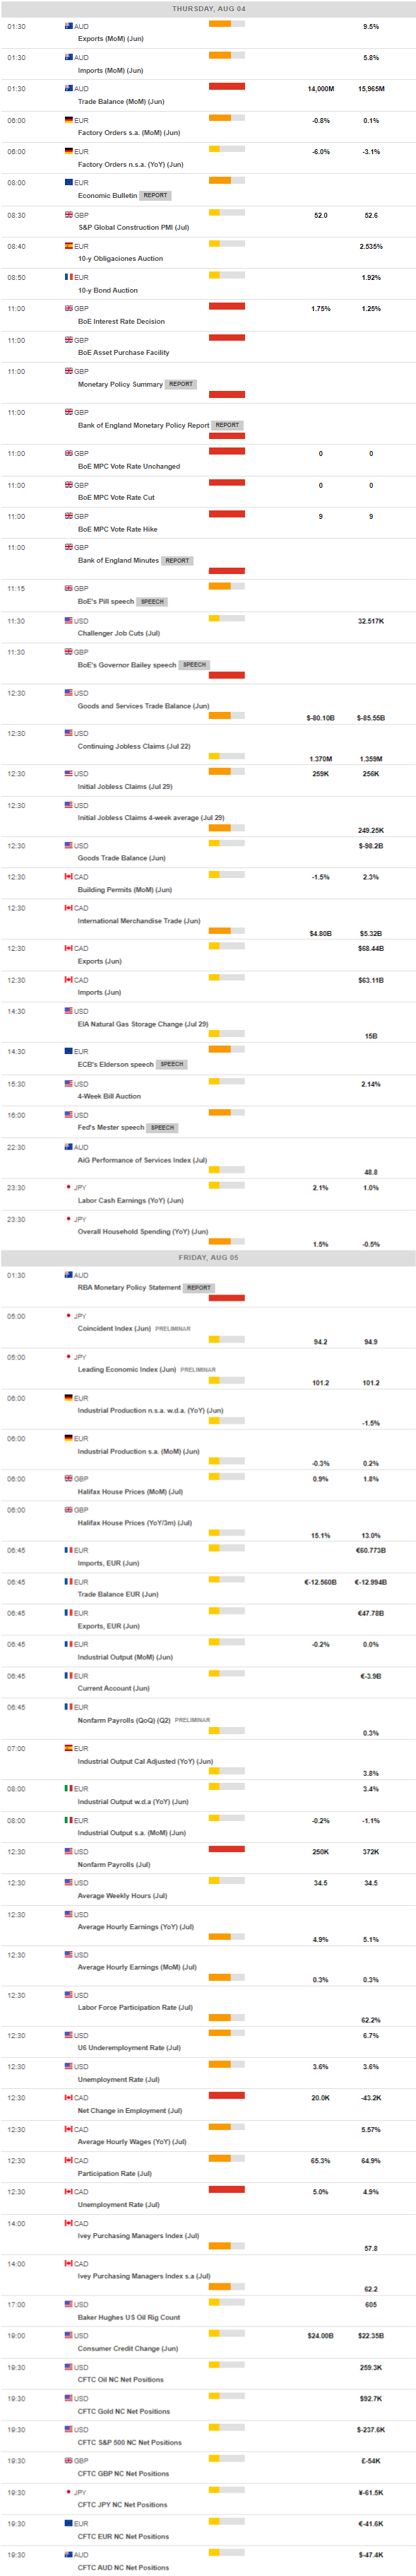
MACROECONOMIC EVENTS
All Information & Updates provided by:

All information relating to the financial markets available on this page has been prepared and issued by FXStreet (Forexstreet SL, Spain, Reg: B62498233) on the basis of publicly available information and all information believed to be reliable and does not conflict with Kuwaiti local laws, and all necessary care has been taken to before the company to ensure that the facts mentioned are correct from the source.
NCM Investment nor any of its directors or employees shall in any way be held responsible for the contents of this news, and the information contained on this page is intended only to provide clients with publicly available information and should not be construed as investment advice, report or analysis and/or constitute an offer or invitation to buy or sell financial instruments of any kind.
RISK WARNING: Forex and CFDs are highly risky leveraged products, as losses can exceed deposits. Please ensure you understand all the risks and take independent advice if necessary. NCM will segregate the clients based on the criteria of the regulator and its bylaws. NCM does not provide any advisory service; the material published does not constitute advice or a recommendation for a transaction in any financial instrument. NCM accepts no responsibility for any use of the content presented and any consequences of that use. Anyone acting on the information provided does so at their own risk.