
- Contact Us:
-

-

-

-


Daily Market Updates
05 Aug 2022
EURUSD
EUR/USD sharply reversed the recent weakness and made its way up to the 1.0240 region, or 2-day highs, on Thursday.
Renewed and strong selling pressure around the greenback found a way to return to the markets after the risk aversion that emerged during Pelosi’s visit to Taiwan died off, opening the door instead to the resurgence of the appetite for the risk-associated universe.
Daily gains in the pair were accompanied by a negative performance of US yields in the short end and the belly of the curve, while the long end managed to record decent gains. In addition, the German 10y Bund yields also grinded lower after two daily gains in a row.
However, recession fears creeped back in and weighed on the greenback, sending the US Dollar Index (DXY) back south of the 106.00 mark.
The US docket did not help the buck either after weekly Claims rose more than expected by 260K in the week to July 30. On a more positive note, June’s trade deficit shrank to $79.6B (from $84.9B).
In the euro calendar, Germany Factory Orders contracted 0.4% inter-month in June and the Construction PMI deteriorated to 43.7 during last month.
EUR/USD continues to target the August top at 1.0293 (August 2) ahead of the temporary 55-day SMA at 1.0410 and the 6-month resistance line near 1.0430. The pair is expected to see its downside pressure reduced on a breakout of the latter, allowing at the same time a probable visit to the weekly high at 1.0615 (June 27) prior to the June peak at 1.0773 (June 9) and the May top at 1.0786 (May 30). On the flip side, initial contention remains at the weekly low at 1.0096 (July 27) just before the parity level. If this level is breached, then the pair could drop to the 2022 low at 0.9952 (July 14) ahead of the December 2002 low at 0.9859. The daily RSI improves markedly and tests the vicinity of 50.
Resistance levels: 1.0239 1.0275 1.0293 (4H chart)
Support levels: 1.0122 1.0113 1.0096 (4H chart)
-637952378066300061.png)
USDJPY
Following two consecutive daily advances, USD/JPY gave away part of those gains and recorded strong losses near the 133.00 area on Thursday.
The corrective leg lower in the pair came on the back of the renewed offered stance in the greenback and the continuation of the downside bias in US yields. On the latter, yields across the curve attempted a mild recovery during early trade, although the bull run lacked follow through.
In Japan, Foreign Bond Investment rose by ¥37.1B in the week to July 30.
Further recovery in USD/JPY needs to clear the August high at 134.55 (August 3) to allow for a probable test of the weekly peak at 137.46 (July 27). The surpass of this level should open the door to the post-BoJ top at 138.87 (July 21) prior to the 2022 top at 139.38 (July 13) and the round level at 140.00. On the other hand, the August low at 130.39 (August 2) is forecast to offer decent initial contention along with the 100-day SMA. South from here emerges the psychological 130.00 yardstick before the May low at 126.36 (May 24) and the key 200-day SMA at 122.63. The daily RSI breaks below the 41 mark.
Resistance levels: 134.55 136.01 137.42 (4H chart)
Support levels: 133.15 132.28 130.39 (4H chart)
-637952378832368800.png)
GBPUSD
Quite volatile session for the British pound. Indeed, GBP/USD saw its downside accelerated to new multi-session lows well south of the 1.2100 mark on Thursday following the (very) dovish hike from the BoE.
Cable, however, managed to trim all of those losses and advanced into the positive territory past the 1.2100 mark later in the session and in response to the accelerated decline in the US dollar.
The initial leg lower in cable emerged despite the BoE raising the policy rate by the most since 1995 at its event earlier on Thursday, after it hiked rates by 50 bps to 1.75%, as broadly anticipated. The MPC voted 8-1 to hike rates by 50 bps, as member Tenreyro voted for a 25 bps raise. However, the “Old Lady” delivered quite a downbeat view on the UK economy, as it is expected to enter recession in Q4 2022, while forecasts now see inflation peaking around 13.3% at some point in the October-December 2022 period. The central bank sees the economy contracting 2.1% this year and predicts the recession would last five quarters at a time when it stressed that the labour market remains tight.
At his press conference, Governor A.Bailey reiterated the economy is forecast to enter recession later in 2022, while he suggested that all options are on the table when it comes to the interest rate decision in September
In the UK docket, the Construction PMI deteriorated to 48.9 in July (from 52.6).
The continuation of the downtrend in GBP/USD is not expected to meet any support of note until the 2022 low at 1.1759 (July 14) ahead of the 2020 low at 1.1409 (March 20). In case bulls regain the upper hand, the August high at 1.2293 (August 1) should turn up as the next target followed by the weekly top at 1.2332 (June 27). North from here emerges another weekly peak at 1.2405 (June 16) before the 100-day SMA at 1.2485 and the 1.2666 level (May 27 high). Once cleared, a probable test of the psychological 1.3000 mark could start emerging on the horizon. The daily RSI changes direction and points to a test of 55.
Resistance levels: 1.2214 1.2293 1.2332 (4H chart)
Support levels: 1.2065 1.2020 1.1963 (4H chart)
-637952378443818140.png)
AUDUSD
AUD/USD clinched the second daily advance in a row and reclaimed further ground following Tuesday’s sharp sell-off, this time getting closer to the psychological barrier at 0.7000.
The negative session in the greenback collaborated with the pair’s upside bias, which was also underpinned by the positive performance of the commodity complex, where prices of the iron ore finally regained the smile and halted a 4-session negative streak.
In the Australian docket, the trade surplus widened to A$17.67B in June, with Exports and Imports expanding 5.1% and 0.7%, respectively.
Immediately to the upside in AUD/USD comes the August high at 0.7047 (August 1), which precedes the weekly top at 0.7069. The breakout of this level introduces a probable move to the temporary 100-day SMA at 0.7108 just before the key 200-day SMA at 0.7162 and prior to the June peak at 0.7282 (June 3). Bears, in the meantime, are expected to target the minor support at the August low at 0.6886 (August 3) ahead of the 2022 low at 0.6681 (July 14) and the May 2020 low at 0.6372 (May 4). The breakdown of this level should expose a deeper drop to the weekly low at 0.6253 (April 21 2020). The daily RSI picks up pace and approaches 55.
Resistance levels: 0.6989 0.7047 0.7069 (4H chart)
Support levels: 0.6886 0.6858 0.6802 (4H chart)
-637952379228471008.png)
GOLD
Prices of the ounce troy of the precious metal extended the bullish bias so far this week and traded at shouting distance from the critical resistance area around $1,800 on Thursday.
The strong daily retracement in the greenback in combination with the lack of upside traction in US yields, particularly in the short end and the belly of the curve, catapulted bullion to levels last seen a month ago.
Also favouring the upside in the yellow metal, Cleveland Fed and known-hawk L.Mester once again ruled out that the economy is in a recession, although she suggested that recession risks now look higher.
Extra gains in gold now look to challenge the critical $1,800 zone, an area also underpinned by the 55-day SMA ($1,796). The break above this zone should meet the next hurdle at the always-relevant 200-day SMA at $1,842 and the 100-day SMA at $1,846, all prior to the $1,857 level (June 16 high). On the downside, the August low at $1,754 (August 3) should offer minor contention prior to the weekly low at $1,711 (July 27). Down from here emerges the 2022 low at $1,680 (July 21) seconded by the 2021 low at $1,1676 (March 8) and the June 2020 low at $1,670 (June 5).
Resistance levels: $1,791 $1,814 $1,825 (4H chart)
Support levels: $1,764 $1,754 $1,711 (4H chart)
-637952379599668792.png)
CRUDE WTI
Crude oil prices extended the bearish mood and prompted the barrel of the American reference for the sweet light crude oil to re-visit the sub-$88.00 area for the first time since late January.
Indeed, recession concerns hurt both traders’ sentiment and demand prospects, forcing the commodity to trade at fresh 6-month lows around $87.60 in the worst part of the session.
Collaborating with the downside, the BoE hiked the policy rate by 50 bps at its event earlier on Thursday and Governor Bailey suggested that the UK economy is expected to enter recession at some point in Q4 2022. That same spectre is now hovering around the euro region and the US (which already is, technically, in recession).
In addition, the unexpected weekly build in US crude oil supplies also sapped the mood among traders and propped up the selling bias.
A drop below the August low at $87.60 (August 4) should facilitate a test of the 81.94 level (low January 24) ahead of the 2022 low at $74.30 (January 3). The initial up barrier now emerges at the always-important 200-day SMA at $95.18 ahead of the weekly peak at $101.87 (July 29) and another weekly high at $104.44 (July 19). Extra gains should retarget the July peak at $111.42 (July 5) before the weekly top at $114.00 (June 29) and the June peak at $123.66 (June 14).
Resistance levels: $91.88 $96.55 $101.20 (4H chart)
Support levels: $87.60 $86.74 $86.34 (4H chart)
-637952380414028142.png)
DOW JONES
US equities traded on a mixed note on Thursday, with the Dow Jones dropping 0.26% to 32,728, the S&P500 shedding 0.07% to 4,152 and the tech reference Nasdaq Composite gaining 0.26% to 12,701.
Stocks followed the inconclusive sentiment among traders, which navigated between recession concerns, the sharp pullback in crude oil prices and the usual cautious stance pre-Nonfarm Payrolls (due on Friday).
Next on the upside for the Dow Jones remains the August high at 32,972 (August 1) ahead of the June peak at 33,272 (June 1) and the key 200-day SMA at 33,980. If the index clears the latter, it could spark further to the May top at 34,117 (May 4) prior to the April high at 35,492 (April 21). The initial contention appears at the August low at 32,387 (August 2) seconded by the weekly low at 31,705 (July 26). If sellers keep pushing, then a test of the July low at 30,143 (July 14) could return to the radar before the 2022 low at 29,653 (June 17). Down from here aligns the 28,902 level (low November 12 2020) prior to the October 2020 low at 26,143 (October 30). The RSI corrects lower and breaches 61.
Top Performers: Visa A, 3M, Caterpillar
Worst Performers: Walmart, JP Morgan, Verizon
Resistance levels: 32,972 33,272 34,117 (4H chart)
Support levels: 32,387 31,705 31,534 (4H chart)
-637952380763933977.png)
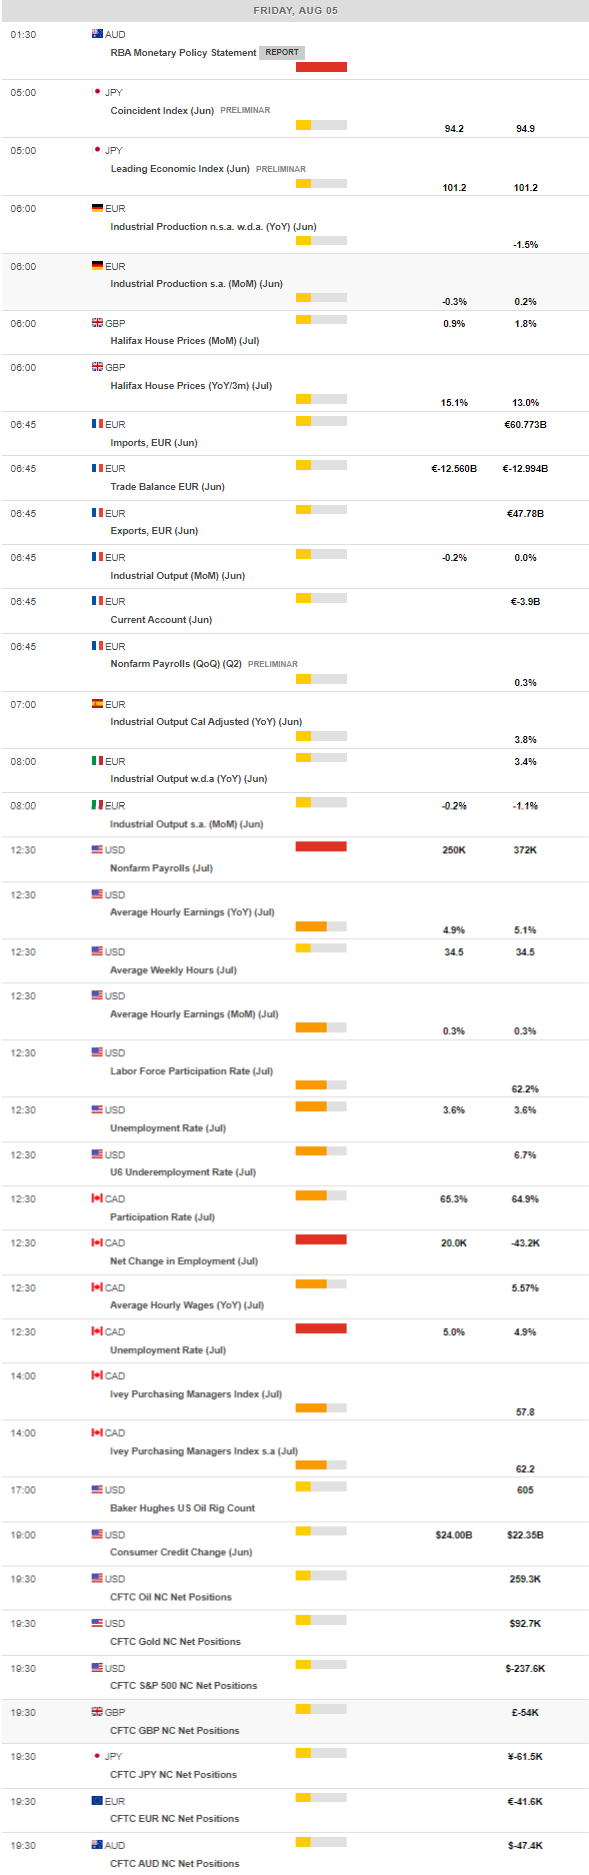
MACROECONOMIC EVENTS
All Information & Updates provided by:

All information relating to the financial markets available on this page has been prepared and issued by FXStreet (Forexstreet SL, Spain, Reg: B62498233) on the basis of publicly available information and all information believed to be reliable and does not conflict with Kuwaiti local laws, and all necessary care has been taken to before the company to ensure that the facts mentioned are correct from the source.
NCM Investment nor any of its directors or employees shall in any way be held responsible for the contents of this news, and the information contained on this page is intended only to provide clients with publicly available information and should not be construed as investment advice, report or analysis and/or constitute an offer or invitation to buy or sell financial instruments of any kind.
RISK WARNING: Forex and CFDs are highly risky leveraged products, as losses can exceed deposits. Please ensure you understand all the risks and take independent advice if necessary. NCM will segregate the clients based on the criteria of the regulator and its bylaws. NCM does not provide any advisory service; the material published does not constitute advice or a recommendation for a transaction in any financial instrument. NCM accepts no responsibility for any use of the content presented and any consequences of that use. Anyone acting on the information provided does so at their own risk.