
- Contact Us:
-

-

-

-


Daily Market Updates
09 Aug 2022
EURUSD
EUR/USD hovered around the 1.0200 region in an uneventful Monday, keeping well and sound the broader 1.0100-1.0300 range bound theme for yet another session.
The greenback eased part of Friday’s strong gains recorded in the wake of the stellar Nonfarm Payrolls for the month of July (+528K jobs) and retreated to the low 106.00s when gauged by the US Dollar Index (DXY), all after hitting the boundaries of the 107.00 neighbourhood at the end of last week.
The macro scenario remained pretty much the same in the global markets, as investors continued to adjust to July’s NFP amidst rising speculation of a potential 75 bps rate hike at the Fed’s event in September. Currently, CME Group’s FedWatch Tool notes the probability of a 75 bps rate hike next month is at nearly 69%.
In the meantime, prudence is expected to prevail in the next couple of sessions in light of the release of crucial US inflation figures for the month of July due later in the week.
In the calendar, the only release was the Sentix Index, which measures the Investor Confidence in the euro area, and it improved a little in August to -25.2 (from -26.4).
-637955804054971785.png)
EUR/USD remains within its 1.0100-1.0300 consolidation theme. The break above the latter is expected to put the August top at 1.0293 (August 2) back on the radar ahead of the interim 55-day SMA at 1.0394. Beyond this area comes the 6-month resistance line near 1.0410, which once cleared, it should mitigate the pair’s selling pressure and thus open the door to a probable visit to the weekly top at 1.0615 (June 27) followed by the June high at 1.0773 (June 9) and the May peak at 1.0786 (May 30). On the flip side, the drop below the weekly low at 1.0096 (July 27) could pave the way for a test of the parity level prior to the 2022 low at 0.9952 (July 14). Down from here emerges the December 2002 low at 0.9859. The daily RSI improves a tad above 46.
Resistance levels: 1.0256 1.0262 1.0448 (4H chart)
Support levels: 1.0141 1.0122 1.0113 (4H chart)
-637955799855309502.png)
USDJPY
The poor start of the week for the greenback and US yields prompted some appreciation in the Japanese yen, therefore putting USD/JPY under downside pressure and dragging well south of the 135.00 mark on Monday.
Indeed, market participants appear to have cashed up gains in the dollar in light of the strong post-Payrolls advance, while the lack of convincing upside momentum forced US yields to refocus on the downside.
In the Japanese calendar, Banking Lending expanded at an annualized 1.8% in July, while the Eco Watchers Survey Current worsened to 43.8 and the Eco Watchers Survey Outlook dropped to 42.8, both prints for the month of July.
No changes on the upside in USD/JPY, as it continues to target the weekly top at 137.46 (July 27) ahead of the post-BoJ high at 138.87 (July 21). A move beyond the latter should open the door to the 2022 peak at 139.38 (July 13) prior to the round level at 140.00. On the downside, the 100-day SMA at 130.84 should hold the initial test followed by the so far August low at 130.39 (August 2). The loss of this region could lead up to a drop to the psychological 130.00 mark before the May low at 126.36 (May 24) and the key 200-day SMA at 122.83. The daily RSI loses momentum and approaches 49.
Resistance levels: 135.58 135.93 137.42 (4H chart)
Support levels: 134.34 132.52 130.39 129.51 (4H chart)
-637955800520431363.png)
GBPUSD
GBP/USD regained composure and advanced north of the 1.2100 mark on Monday, although part of those gains did not stick.
The renewed offered stance in the greenback allowed sterling and the rest of its risk-associated peers to reclaim some ground lost following Friday’s sharp move higher in the buck.
In the UK cash markets the UK 10y Gilt yields gave away part of the recent gains and retreated to the 1.93% region.
The UK calendar was empty on Monday.
Immediately to the downside for GBP/USD emerges the August low at 1.2002 (August 5) ahead of the 2022 low at 1.1759 (July 14). Down from here comes the 2020 low at 1.1409 (March 20). On the upside, there is initial hurdle at the August high at 1.2293 (August 1) prior to the weekly top at 1.2332 (June 27). Further north of the latter is expected to resurface the weekly peak at 1.2405 (June 16) ahead of the 100-day SMA at 1.2464. Extra gains could see the 1.2666 level (May 27 high) revisited prior to the psychological 1.3000 mark. The daily RSI ticks higher north of 48.
Resistance levels: 1.2137 1.2214 1.2293 (4H chart)
Support levels: 1.2066 1.2003 1.1963 (4H chart)
-637955800197359545.png)
AUDUSD
AUD/USD managed to briefly test the area beyond the key 0.7000 barrier on Monday, just to shed some ground soon afterwards.
The soft tone in the greenback encouraged the Aussie dollar to resume the upside and quickly leave behind Friday’s sharp sell-off, while the broad-based upbeat note in the commodity space and marginal gains in prices of the iron ore also collaborated with the bid bias in the pair.
In line with the rest of the global money markets, the 10y AGB yields reversed two daily advances in a row and charted modest losses around the 3.20% on Monday.
No data releases scheduled Down Under on Monday should leave all the attention to Tuesday’s Consumer Confidence gauged by Westpac and the Business Confidence tracked by NAB.
The resumption of the upside bias in AUD/USD is expected to target the August high at 0.7047 (August 1) ahead of the weekly top at 0.7069 and the 100-day SMA at 0.7098. The breakout of this level could open the door to a test of the key 200-day SMA at 0.7156 before the June peak at 0.7282 (June 3). In the opposite direction, the initial support comes at the August low at 0.6869 (August 5). If the pair clears the latter, then there are no contention levels of note until the 2022 low at 0.6681 (July 14) prior to the May 2020 low at 0.6372 (May 4) and the weekly low at 0.6253 (April 21 2020). The daily RSI leaps past the 55 yardstick.
Resistance levels: 0.7009 0.7047 0.7069 (4H chart)
Support levels: 0.6882 0.6869 0.6858 (4H chart)
-637955800885317577.png)
GOLD
Prices of the ounce troy of the precious metal resumed the uptrend and revisited once again the $1,790 region at the beginning of the week.
The continuation of the strong recovery in the yellow metal came on the back of the renewed selling pressure in the greenback, as market participants seem to have already digested July’s stellar Nonfarm Payrolls figures.
Collaborating with the upside in bullion also came the resumption of the downtrend in US yields across the curve, all coupled with increasing prudence ahead of the publication of the US inflation figures tracked by the CPI on Wednesday.
The next up barrier of relevance in gold emerges at the $1,800 zone, which precedes the key 200-day SMA at $1,841 and the 100-day SMA at $1,843. Above this region turns up the $1,857 level (June 16 high) ahead of the June high at $1,879 (June 13). Bears, in the meantime, should initially target the August low at $1,754 (August 3) ahead of the weekly low at $1,711 (July 27). If the selling pressure gathers impulse, then a visit to the 2022 low at $1,680 (July 21) could return to the radar prior to the 2021 low at $1,1676 (March 8) and the June 2020 low at $1,670 (June 5).
Resistance levels: $1,794 $1,814 $1,825 (4H chart)
Support levels: $1,765 $1,754 $1,711 (4H chart)
-637955801218139690.png)
CRUDE WTI
Prices of the WTI clinched the second consecutive session with gains on Monday and managed to return to the area north of the $90.00 mark per barrel.
The continuation of the rebound from last week’s multi-month lows around $87.00 came in tandem with better-than-expected trade figures in the Chinese economy (published on Sunday), while the solid US jobs report also added to the sentiment.
However, the positive atmosphere around recent talks between US and Iran to revive the Tehran nuclear deal appears to have limited the upside potential, while recession chatter remains a drag to any serious recovery in crude oil prices.
Further rebound in WTI faces a key barrier at the key 200-day SMA, today at $95.25. Further up emerges the psychological $100.00 mark seconded by the weekly peak at $101.87 (July 29) and another weekly top at $104.44 (July 19). Extra gains from here should target the July high at $111.42 (July 5) before the weekly peak at $114.00 (June 29) and the June top at $123.66 (June 14). In case bears regain control, the August low at $87.03 (August 5) appears as the immediate contention area seconded by the 81.94 level (low January 24) and the 2022 low at $74.30 (January 3).
Resistance levels: $88.49 $91.88 $96.55 (4H chart)
Support levels: $87.01 $86.74 $86.34 (4H chart)
-637955801873420328.png)
DOW JONES
US equities started the trading week in a mixed fashion following Friday’s advance in a context dominated by renewed dollar weakness, diminishing US yields and rising cautiousness ahead of the US CPI release later in the week.
In addition, investors continued to gauge the strong US jobs report vs. the increasing likelihood that the Fed could extend its aggressive normalization in the next months. On this, a 75 bps rate hike at the September event remains the preferred scenario so far.
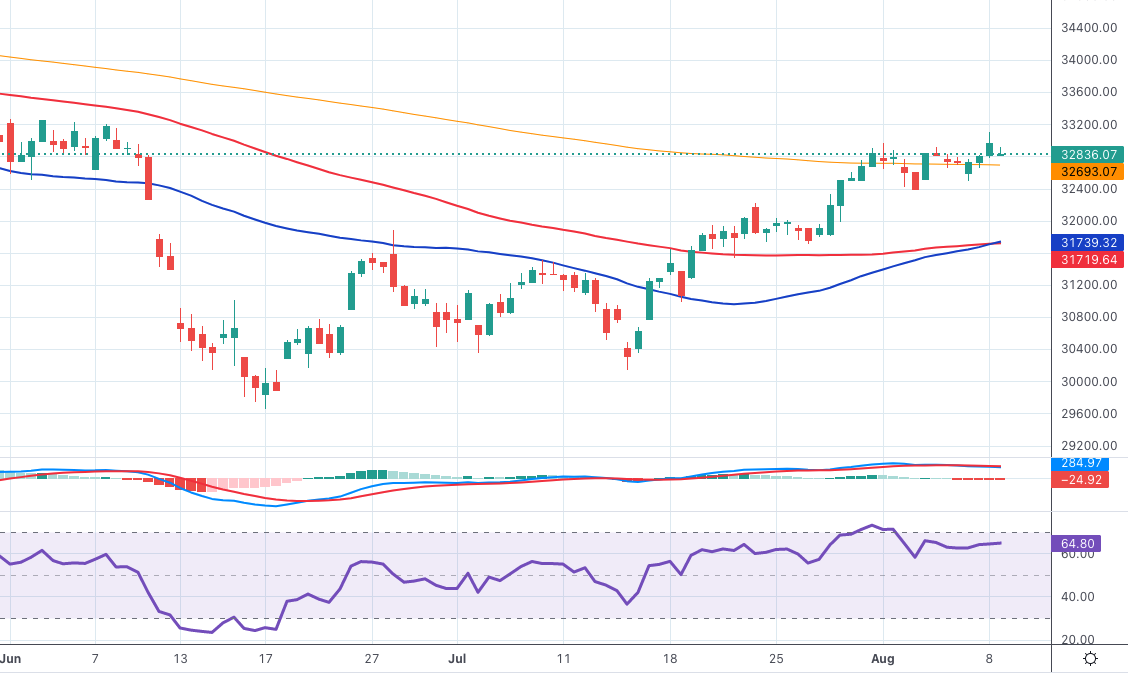
That said, the Dow Jones rose 0.16% to 32,866, the S&P500 dropped 0.05% to 4,142 and the tech-heavy Nasdaq Composite advanced 0.05% to 12,664.
The Dow Jones clinched a new August high at 33,109 (August 8). The surpass of this level should open the door to a visit to the June peak at 33,272 (June 1) before the key 200-day SMA at 33,953. Beyond this region emerges the May top at 34,117 (May 4) prior to the April high at 35,492 (April 21). On the other hand, initial support comes at the August low at 32,387 (August 2) seconded by the weekly low at 31,705 (July 26). South from here turns up the July low at 30,143 (July 14) ahead of the 2022 low at 29,653 (June 17). A deeper decline should expose the 28,902 level (low November 12 2020) before the October 2020 low at 26,143 (October 30). The RSI edges higher just above 62.
Top Performers: Walt Disney, Boeing, Dow
Worst Performers: Visa A, Microsoft, McDonald’s
Resistance levels: 33,109 33,272 34,117 (4H chart)
Support levels: 32,489 32,387 31,705 (4H chart)
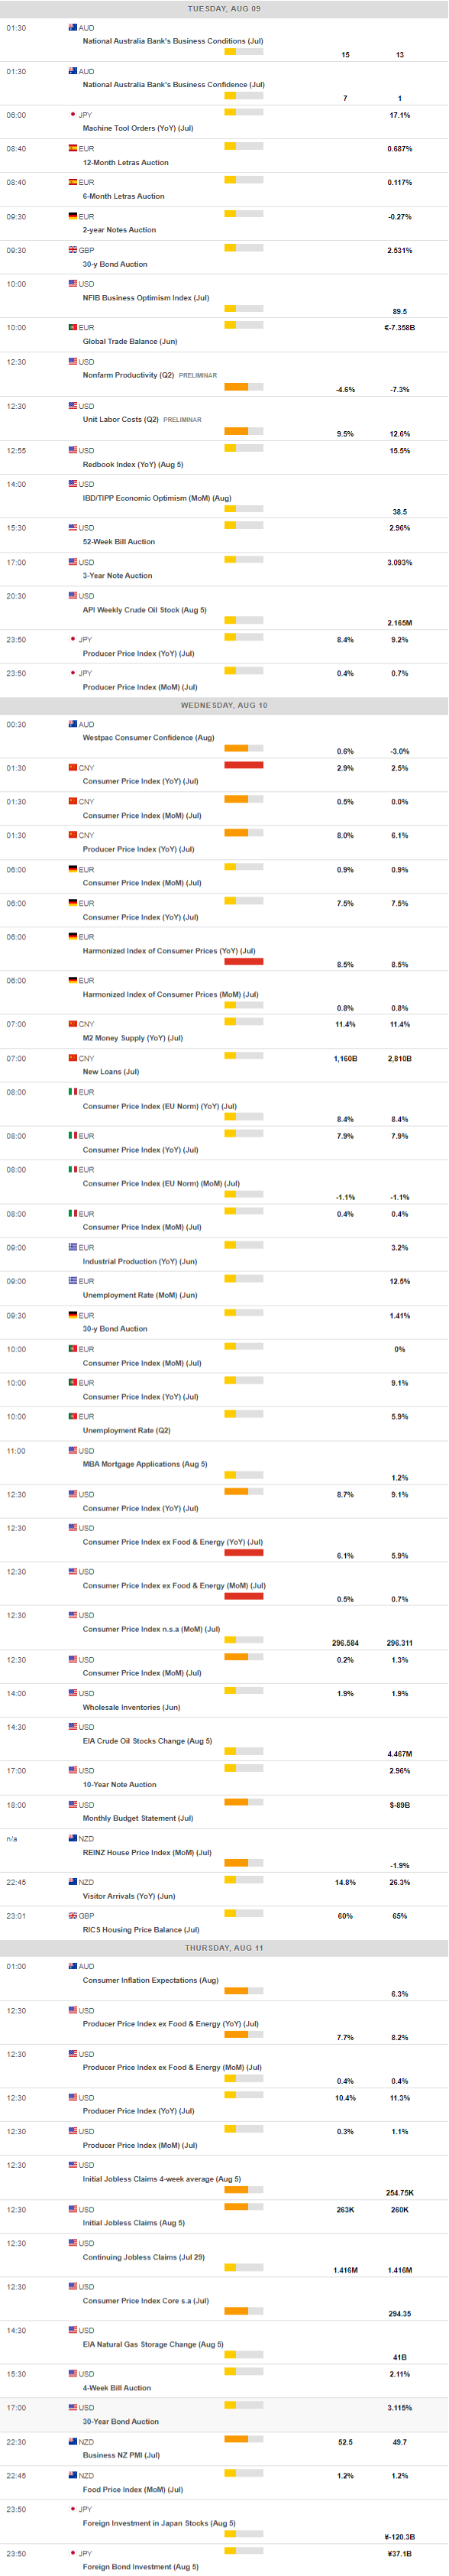
MACROECONOMIC EVENTS
All Information & Updates provided by:

All information relating to the financial markets available on this page has been prepared and issued by FXStreet (Forexstreet SL, Spain, Reg: B62498233) on the basis of publicly available information and all information believed to be reliable and does not conflict with Kuwaiti local laws, and all necessary care has been taken to before the company to ensure that the facts mentioned are correct from the source.
NCM Investment nor any of its directors or employees shall in any way be held responsible for the contents of this news, and the information contained on this page is intended only to provide clients with publicly available information and should not be construed as investment advice, report or analysis and/or constitute an offer or invitation to buy or sell financial instruments of any kind.
RISK WARNING: Forex and CFDs are highly risky leveraged products, as losses can exceed deposits. Please ensure you understand all the risks and take independent advice if necessary. NCM will segregate the clients based on the criteria of the regulator and its bylaws. NCM does not provide any advisory service; the material published does not constitute advice or a recommendation for a transaction in any financial instrument. NCM accepts no responsibility for any use of the content presented and any consequences of that use. Anyone acting on the information provided does so at their own risk.