
- Contact Us:
-

-

-

-


Daily Market Updates
10 Aug 2022
EURUSD
Another positive session saw EUR/USD climb to fresh 2-day highs near 1.0250 on turnaround Tuesday, always accompanied by the persistent selling bias surrounding the greenback.
Indeed, on the latter, the US Dollar Index (DXY) continued to shed ground following the post-Payrolls sharp climb to the boundaries of the 107.00 yardstick last Friday.
Extra gains in the pair were underpinned by the improvement in the risk-associated galaxy, which also morphed into a mild rebound in yields on both sides of the ocean.
In the meantime, there were no changes to the broader macro view, where recession talks remain almost omnipresent as well as speculation of further interest rate hikes by both the Federal Reserve and the ECB at the September events.
Nothing in the euro calendar shifted the attention to the US docket, where the NFIB Business Optimism Index came at 89.9 in July and the IBD/TIPP Economic Optimism Index deflated a tad to 38.1 in August.
EUR/USD faces the immediate up barrier at the August high at 1.0293 (August 2) prior to the temporary 55-day SMA at 1.0385. Just above the latter emerges the 6-month resistance line around 1.0400. The breakout of this level could mitigate the selling pressure in the pair and allow for the continuation of the recovery to the weekly peak at 1.0615 (June 27) seconded by the June top at 1.0773 (June 9) and the May high at 1.0786 (May 30). On the downside, a move below the weekly low at 1.0096 (July 27) should open the door to a test of the parity level ahead of the 2022 low at 0.9952 (July 14) and the December 2002 low at 0.9859. The daily RSI improves further and surpasses 48.
Resistance levels: 1.0247 1.0253 1.0293 (4H chart)
Support levels: 1.0141 1.0122 1.0113 (4H chart)
-637956655770622816.png)
USDJPY
USD/JPY extended the directionless trading in the upper end of the weekly range around the 135.00 neighbourhood amidst the bearish performance of the greenback and the decent rebound in US yields across the curve.
In fact, the appetite for the risk complex dominated the sentiment among market participants on Tuesday and this translated into further selling pressure in the safe haven yen and motivated US yields to regain some poise after Monday’s decline.
In the Japanese calendar, Machine Tool Orders expanded at an annualized 5.5% in July.
Further recovery in USD/JPY faces a minor hurdle at the weekly high at 135.58 (August 8) ahead of the weekly peak at 137.46 (July 27). The surpass of this level could open the door to the post-BoJ top at 138.87 (July 21) before the 2022 high at 139.38 (July 13) and the round level at 140.00. In the opposite direction, there is a temporary contention at the 100-day SMA at 130.98 ahead of the so far August low at 130.39 (August 2). A deeper retracement should expose the psychological 130.00 level prior to the May low at 126.36 (May 24) and the key 200-day SMA at 122.94. The daily RSI navigates the area below 50.
Resistance levels: 135.58 135.87 137.42 (4H chart)
Support levels: 134.34 132.52 130.39 129.51 (4H chart)
-637956657283194831.png)
GBPUSD
GBP/USD added to gains recorded at the beginning of the week and advanced north of 1.2100 the figure in an atmosphere favourable to the risk complex and amidst further dollar weakness. Cable, however, faded that initial advance and receded to the 1.2080 region.
Indeed, the selling bias in the buck gathered extra pace after investors digested the recent strong US jobs report and seem to have already priced in the likelihood of a 75 bps rate hike at the Fed’s September event.
In the UK cash market, the 10y Gilt yields edged a tad higher in tandem with the generalized upbeat mood in the rest of the global bond benchmarks.
In the UK calendar, the BRC Retail Sales Monitor expanded 1.6% in the year to July in what was the sole release on Tuesday.
BoE’s Ramsden advocated for further tightening of the monetary conditions and added that inflation expectations remain anchored.
GBP/USD clinched the second session in a row with gains and now faces immediate hurdle at the August top at 1.2293 (August 1), which precedes the weekly peak at 1.2332 (June 27). Further gains should target the weekly high at 1.2405 (June 16) prior to the 100-day SMA at 1.2452. North from here appears the 1.2666 level (May 27 high) before the psychological 1.3000 yardstick. Occasional bouts of selling pressure should meet initial support at the August low at 1.2002 (August 5) prior to the 2022 low at 1.1759 (July 14) followed by the 2020 low at 1.1409 (March 20). The daily RSI ticks higher to 50 and beyond.
Resistance levels: 1.2137 1.2214 1.2293 (4H chart)
Support levels: 1.2061 1.2003 1.1963 (4H chart)
-637956656843792689.png)
AUDUSD
Despite the upbeat tone in the risk-linked galaxy, AUD/USD printed modest losses while the daily upside remained capped by the key 0.7000 region on turnaround Tuesday.
Indeed, the pair failed to capitalize on the continuation of the selling pressure in the US dollar and the positive price action in commodities, where prices of the iron ore traded with marginal gains near the $110.00 mark per tonne and copper prices extended the uptrend to levels last seen in early July.
The cautious trade in the Aussie dollar also reflected the generalized wariness ahead of the release of the US inflation figures (Wednesday) and the simmering tensions between China and Taiwan.
In Oz, the Westpac Consumer Confidence Index eased to 81.2 in August (from 83.8) and the NAB Business Confidence improved to 7 in July (from 2).
The resumption of the buying interest should prompt AUD/USD to challenge the August top at 0.7047 (August 1) prior to the weekly peak at 0.7069 and the 100-day SMA at 0.7093. The break above the latter should introduce a potential visit to the key 200-day SMA at 0.7154 prior to the June high at 0.7282 (June 3). On the other hand, the August low at 0.6869 (August 5) is expected to hold the initial test before the 2022 low at 0.6681 (July 14). South from here emerges the May 2020 low at 0.6372 (May 4) and the weekly low at 0.6253 (April 21 2020). The daily RSI deflates marginally below 55.
Resistance levels: 0.7009 0.7047 0.7069 (4H chart)
Support levels: 0.6884 0.6869 0.6858 (4H chart)
-637956657657087529.png)
GOLD
Gold prices extended the positive start of the week and finally tested, albeit ephemerally, levels just above the critical $1,800 mark per ounce troy on Tuesday.
Another negative session for the greenback allowed the yellow metal to add to recent gains beyond that key resistance area, although the corrective upside in US yields and the perception that US inflation could surprise to the downside in July somehow limited the upside in bullion.
On the latter, all the attention is expected to be on the release of the US inflation figures tracked by the CPI on Wednesday.
A sustainable advance beyond the $1,800 level should encourage bullion to accelerate gains to, initially, the key 200-day SMA at $1,841 and the 100-day SMA at $1,842. Further north emerges the $1,857 level (June 16 high) before the June top at $1,879 (June 13). The immediate down barrier comes at the August low at $1,754 (August 3) followed by the weekly low at $1,711 (July 27). Extra weakness could see the 2022 low at $1,680 (July 21) revisited while a deeper pullback should put the 2021 low at $1,1676 (March 8) back on the radar ahead of the June 2020 low at $1,670 (June 5).
Resistance levels: $1,800 $1,814 $1,825 (4H chart)
Support levels: $1,765 $1,759 $1,711 (4H chart)
-637956657997595335.png)
CRUDE WTI
Crude oil prices halted two consecutive sessions with gains and returned to the $90.00 area after the initial bull run to the area past the $92.00 mark per barrel of WTI lacked conviction. Indeed, prices gathered initial upside traction after Russia accuses Ukraine of halting the supply of Russian oil to central Europe.
However, prices of the WTI lost momentum pari passu with news citing further progress in the US-Iran negotiations to revive the nuclear deal, which could see around 1 mbpd of Iranian oil return to the markets on a positive outcome of the current talks.
Also having a negative impact on prices of the commodity, the EIA said its forecast for US crude oil production averages 11.9 mbpd in 2022 and 12.8 mbpd in 2023, which should be a record for US crude oil output in a year.
If bulls regain the upper hand, WTI prices should still face initial resistance at the key 200-day SMA, today at $95.28. The surpass of this level exposes the psychological $100.00 mark ahead of the weekly top at $101.87 (July 29) and followed by another weekly peak at $104.44 (July 19). Extra gains are expected to target the July high at $111.42 (July 5) prior to the weekly top at $114.00 (June 29) and the June peak at $123.66 (June 14). On the flip side, immediate contention lines up at the August low at $87.03 (August 5) followed by the 81.94 level (low January 24) and the 2022 low at $74.30 (January 3).
Resistance levels: $92.62 $96.55 $99.59 (4H chart)
Support levels: $87.01 $86.74 $86.34 (4H chart)
-637956658738018316.png)
DOW JONES
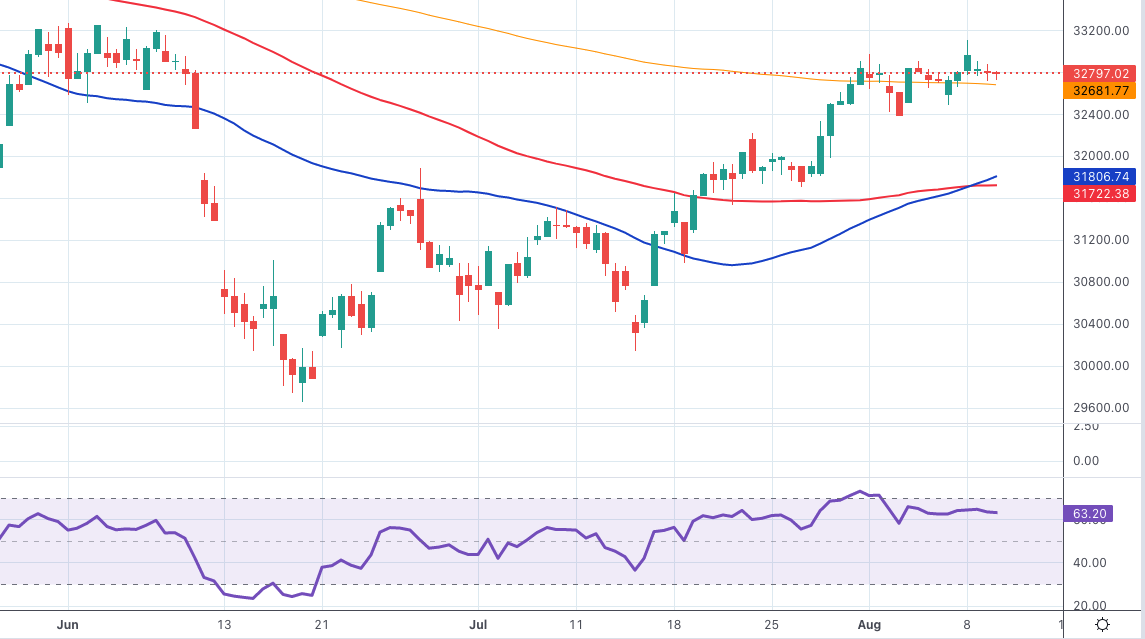
Equities in US markets extended the weekly leg lower and added to Monday’s retracement on turnaround Tuesday, as the Dow Jones dropped 0.27% to 32,745, the S&P500 retreated 0.54% to 4,117 and the tech reference Nasdaq Composite shed 1.40% to 12,468.
Stocks traded mostly on the defensive as investors remained prudent ahead of the release of key US inflation figures gauged by the CPI for the month of July on Wednesday.
In addition, losses in the tech sector dragged the Nasdaq lower and outspread the downbeat mood after Micron Technology warned of lower demand for chips in the next months.
Immediately to the upside for the Dow Jones emerges the August top at 33,109 (August 8) followed by the June high at 33,272 (June 1), which precedes the key 200-day SMA at 33,938. The breakout of this region exposes the May peak at 34,117 (May 4) ahead of the April top at 35,492 (April 21). The drop below the August low at 32,387 (August 2) is expected to put the weekly low at 31,705 (July 26) back on the radar before the July low at 30,143 (July 14) and the 2022 low at 29,653 (June 17). Further south aligns the 28,902 level (low November 12 2020) prior to the October 2020 low at 26,143 (October 30). The RSI stays side-lined below 62.
Top Performers: Merck&Co, Travelers, Chevron
Worst Performers: Salesforce.com, Nike, Home Depot
Resistance levels: 33,109 33,272 34,117 (4H chart)
Support levels: 32,489 32,387 31,705 (4H chart)
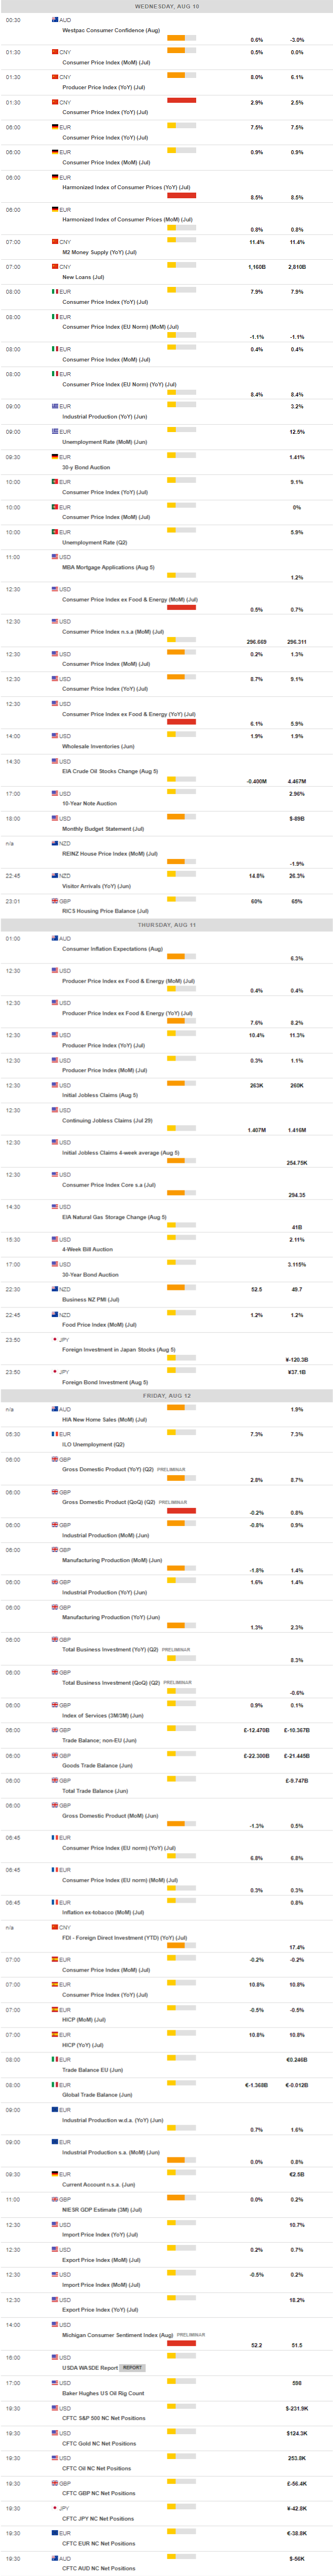
MACROECONOMIC EVENTS
All Information & Updates provided by:

All information relating to the financial markets available on this page has been prepared and issued by FXStreet (Forexstreet SL, Spain, Reg: B62498233) on the basis of publicly available information and all information believed to be reliable and does not conflict with Kuwaiti local laws, and all necessary care has been taken to before the company to ensure that the facts mentioned are correct from the source.
NCM Investment nor any of its directors or employees shall in any way be held responsible for the contents of this news, and the information contained on this page is intended only to provide clients with publicly available information and should not be construed as investment advice, report or analysis and/or constitute an offer or invitation to buy or sell financial instruments of any kind.
RISK WARNING: Forex and CFDs are highly risky leveraged products, as losses can exceed deposits. Please ensure you understand all the risks and take independent advice if necessary. NCM will segregate the clients based on the criteria of the regulator and its bylaws. NCM does not provide any advisory service; the material published does not constitute advice or a recommendation for a transaction in any financial instrument. NCM accepts no responsibility for any use of the content presented and any consequences of that use. Anyone acting on the information provided does so at their own risk.