
- Contact Us:
-

-

-

-


Daily Market Updates
11 Aug 2022
EURUSD
EUR/USD advanced to new 5-week highs after finally managing to break above the key hurdle at 1.0300 the figure on Wednesday.
Indeed, the pair popped higher rapidly and approached the 1.0370 region in response to the violent pullback in the greenback soon after US inflation figures came below initial forecast in July.
The immediate post-CPI reaction was a sharp scale back of expectations of a 75 bps rate hike at the Fed’s September event by investors, which was also reflected in the CME Group’s FedWatch Tool. According to the latter, the probability of such a scenario is now at nearly 37% from around 70% moments before the publication of the US CPI.
Following the release of US CPI and the markets’ reaction, Chicago Fed C.Evans was on the wires and anticipated that the FFTR will be at 3.25%-3.50% by year end and 3.75%-4.00% towards the end of 2023. He also dialed down the probability that the US economy could slow down anytime soon.
In the euro calendar, the final Inflation Rate in Germany and Italy saw the CPI rise 7.5%YoY and 7.9% YoY, respectively, both declining from the June’s prints.
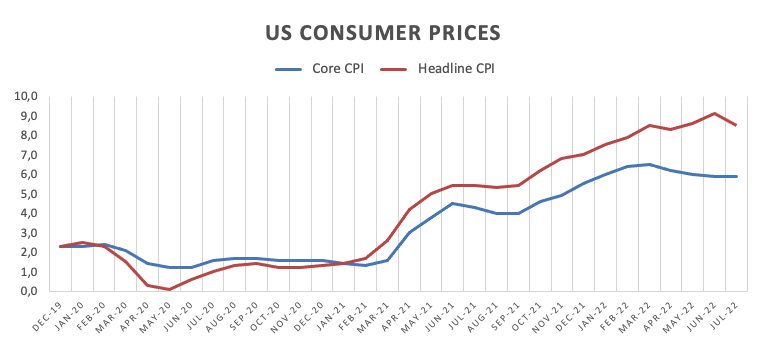
In the US data space, the Inflation Rate rose 8.5% in the year to July and 5.9% YoY when it comes to prices stripping food and energy costs. Additional data saw MBA Mortgage Applications expand 0.2% in the week to August 5, Wholesale Inventories expand 1.8% MoM in June and the Monthly Budget Statement shrank to $194B during last month.
Following Wednesday’s price action, EUR/USD is now expected to meet the next up barrier at the August peak at 1.0368 (August 10) just ahead of the temporary 55-day SMA at 1.0378. Beyond this level turns up the 6-month resistance line near 1.0400. If the pair trespasses this region, then its downside pressure should mitigate and could allow gains to test the weekly top at 1.0615 (June 27) ahead of the June high at 1.0773 (June 9) and the May peak at 1.0786 (May 30). On the flip side, a decent contention remains at the weekly low at 1.0096 (July 27), which precedes the parity level prior to the 2022 low at 0.9952 (July 14) and the December 2002 low at 0.9859. The daily RSI leaps past the 56 level, in line with the daily jump in spot.
Resistance levels: 1.0368 1.0448 1.0462 (4H chart)
Support levels: 1.0202 1.0141 1.0122 (4H chart)
-637957523900572263.png)
USDJPY
USD/JPY lost the grip and slipped back to new multi-day lows in the 132.00 neighbourhood following the intense leg lower in the dollar and the decline in US yields, particularly in the short end and the belly of the curve.
Indeed, the US Dollar Index (DXY) plummeted to the sub-105.00 zone in response to the lower-than-expected US CPI results for the month of July and the subsequent reassessment of a large interest rate hike by investors at the Fed’s September gathering.
In Japan, Producer Prices rose 0.4% MoM in July and 8.6% over the last twelve months.
In case the selling pressure picks up extra pace in the near term, USD/JPY could drop further and retest the 100-day SMA at 131.10 ahead of the so far August low at 130.39 (August 2). Extra losses from here unveils a probable visit to the psychological 130.00 mark ahead of the May low at 126.36 (May 24) and the key 200-day SMA at 123.03. Occasional bullish moves, on the contrary, are seen retesting the August top at 135.58 (August 8) followed by the weekly high at 137.46 (July 27). Once cleared, the post-BoJ peak at 138.87 (July 21) could re-emerge on the horizon before the 2022 top at 139.38 (July 13) seconded by the round level at 140.00. The daily RSI mirrors the pair’s move and retreats to the vicinity of 40.
Resistance levels: 135.58 135.85 137.42 (4H chart)
Support levels: 132.03 130.39 129.51 (4H chart)
-637957524819461054.png)
GBPUSD
In line with the rest of the risk-associated peers and following the intense sell-off in the greenback, the sterling managed to gather steam and propel GBP/USD to fresh multi-session peaks around 1.2275 midweek.
Indeed, the selling pressure hurt the dollar in the wake of disappointing US inflation figures for the month of July (+8.5% YoY) pari passu with investors’ repricing of the next steps from the Fed, namely, whether to hike by 75 bps or a smaller raise at the September event.
Indeed, the selling bias in the buck gathered extra pace after investors digested the recent strong US jobs report and seem to have already priced in the likelihood of a 75 bps rate hike at the Fed’s September event.
The UK docket remained empty on Wednesday, leaving all the attention to the release of preliminary Q2 GDP figures on Friday.
GBP/USD now seems to have paved the way for a test of the August high at 1.2293 (August 1) ahead of the weekly top at 1.2332 (June 27). The surpass of this level could see the weekly peak at 1.2405 (June 16) revisited before the 100-day SMA at 1.2442. The continuation of the march north should then target the 1.2666 level (May 27 high) ahead of the psychological 1.3000 mark. In the opposite direction, immediate contention appears at the August low at 1.2002 (August 5) ahead of the 2022 low at 1.1759 (July 14), which is seconded by the 2020 low at 1.1409 (March 20). The daily RSI jumps to the boundaries of 60.
Resistance levels: 1.2276 1.2293 1.2332 (4H chart)
Support levels: 1.2057 1.2003 1.1963 (4H chart)
-637957524374158759.png)
AUDUSD
AUD/USD abruptly rose to fresh 2-month highs on Wednesday, managing at the same time to reclaim the 0.7100 mark and flirt with the 200-week SMA, today at 0.7125.
Indeed, spot advanced more than 2% - the largest single day gain since May 4 – in response to the fierce sell-off in the greenback, which forced the US Dollar Index (DXY) to breach the 105.00 support for the first time since early July.
Extra wings for the Aussie dollar came from the upbeat trade in commodities, where prices of the iron ore surpassed the $110.00 mark per tonne and copper traded in 2-month tops around $3.65 per pound.
There were no data releases scheduled in the Australian calendar, while key Consumer Inflation Expectations for the month of August are due on Thursday.
The acute upside in AUD/USD now opens the door to a visit to the key 200-day SMA at 0.7152 ahead of the June peak at 0.7282 (June 3) and the weekly top at 0.7458 (April 21). On the downside, initial support comes at the August low at 0.6869 (August 5) prior to the 2022 low at 0.6681 (July 14) and the May 2020 low at 0.6372 (May 4). The breakdown of this level should allow a deeper retracement to the weekly low at 0.6253 (April 21 2020). The daily RSI picks up pace and approaches 63.
Resistance levels: 0.7108 0.7137 0.7194 (4H chart)
Support levels: 0.6946 0.6884 0.6869 (4H chart)
-637957525521520472.png)
GOLD
Prices of the ounce troy of gold rose to new 5-week highs past the key $1,800 mark on Wednesday, although they gave away some ground later, ending the session just around that critical zone.
The slump in the dollar following the lower-than-expected US inflation prints underpinned the third consecutive session with gains in bullion, while the corrective drop in yields in the 2y-10y band also collaborated with the upside bias in the precious metal.
In addition, investors’ speculation over a probable 50 bps rate hike (instead of 75 bps) also lent extra support to the yellow metal.
Gold now needs to clear the August high at $1,807 (August 10) to attempt a move to the key 200-day SMA, today at $1,841. Once surpassed, a probable visit to the June top at $1,879 (June 13) could start shaping up prior to the April peak at $1,998 (April 19). On the other hand, the August low at $1,754 (August 3) should emerge as the initial contention seconded by the weekly low at $1,711 (July 27). The breakdown of this level should lead up to a test of the 2022 low at $1,680 (July 21) prior to the 2021 low at $1,1676 (March 8) and the June 2020 low at $1,670 (June 5).
Resistance levels: $1,807 $1,814 $1,825 (4H chart)
Support levels: $1,765 $1,758 $1,711 (4H chart)
-637957525941331857.png)
CRUDE WTI
Prices of the American benchmark for the sweet light crude oil rebounded and revisited the $92.00 mark per barrel on Wednesday on the back of the persistent weakness hitting the dollar, renewed appetite for riskier assets and higher demand for gasoline.
On the latter, the EIA said in its report for the week ended on August 5 that gasoline inventories shrank far more than expected by 4.978M barrels, while US crude oil stockpiles increased by 5.458M barrels and supplies at Cushing rose by 0.723M barrels.
In addition, the severe drop in the greenback lent fresh oxygen to crude oil prices and the rest of the commodities as well as the USD-denominated assets.
No changes to the topside in WTI, which continues to target the key 200-day SMA, today at $95.33 prior to the psychological $100.00 level and before the weekly high at $101.87 (July 29). The break above this level could motivate crude oil to confront another weekly top at $104.44 (July 19) ahead of the July peak at $111.42 (July 5). Further up comes the weekly high at $114.00 (June 29) prior to the June top at $123.66 (June 14). The initial down barrier aligns at the August low at $87.03 (August 5) seconded by the 81.94 level (low January 24) and the 2022 low at $74.30 (January 3).
Resistance levels: $92.62 $96.55 $99.59 (4H chart)
Support levels: $87.01 $86.74 $86.34 (4H chart)
-637957526677387703.png)
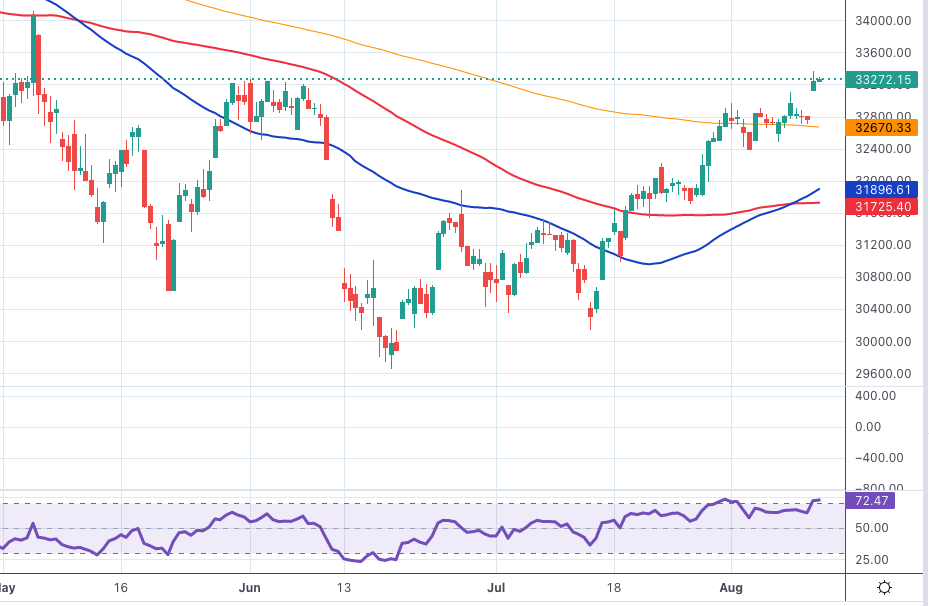
DOW JONES
US equities resumed the upside and traded in an upbeat mood on Wednesday, always underpinned by the strong improvement in the appetite for the riskier assets.
In fact, the exceptional weakness around the greenback coupled with investors’ renewed speculation over a potential slower pace in the Fed’s normalization process – particularly following the lower-than-expected US inflation figures in July - lent legs to stocks and supported the change of heart among market participants.
Against that, the Dow Jones gained 1.55% to 33,283, the S&P500 advanced 2.06% to 4,207 and the tech-heavy Nasdaq Composite rose 2.72% to 12,834.
If the Dow Jones clears the August high at 33,364 (August 10) it could then attempt a move to the always-relevant 200-day SMA at 33,926. Beyond the latter emerges the May top at 34,117 (May 4) prior to the April peak at 35,492 (April 21). Immediately to the downside, the August low at 32,387 (August 2) should offer initial contention ahead of the weekly low at 31,705 (July 26). The loss of this region could put a test of the July low at 30,143 (July 14) back on the radar before the 2022 low at 29,653 (June 17) and ahead of the 28,902 level (low November 12 2020). South from here awaits the October 2020 low at 26,143 (October 30). The RSI ticks higher and toys with the 67 area.
Top Performers: Goldman Sachs, Dow, Salesforce.com
Worst Performers: Merck&Co, J&J, UnitedHealth
Resistance levels: 33,364 34,117 35,492 (4H chart)
Support levels: 32,670 32,489 32,387 (4H chart)
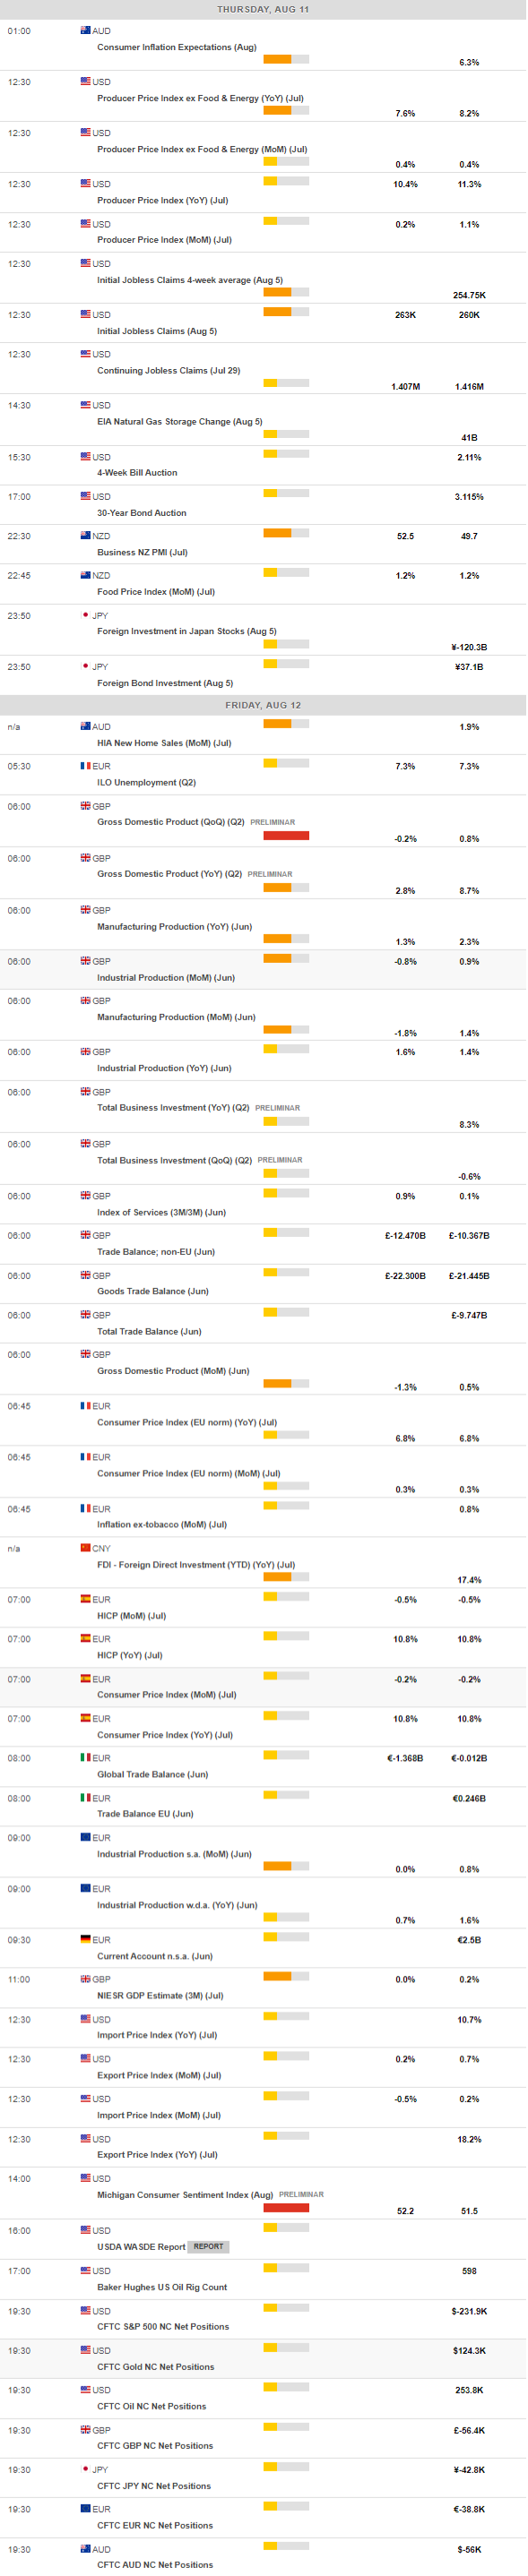
MACROECONOMIC EVENTS
All Information & Updates provided by:

All information relating to the financial markets available on this page has been prepared and issued by FXStreet (Forexstreet SL, Spain, Reg: B62498233) on the basis of publicly available information and all information believed to be reliable and does not conflict with Kuwaiti local laws, and all necessary care has been taken to before the company to ensure that the facts mentioned are correct from the source.
NCM Investment nor any of its directors or employees shall in any way be held responsible for the contents of this news, and the information contained on this page is intended only to provide clients with publicly available information and should not be construed as investment advice, report or analysis and/or constitute an offer or invitation to buy or sell financial instruments of any kind.
RISK WARNING: Forex and CFDs are highly risky leveraged products, as losses can exceed deposits. Please ensure you understand all the risks and take independent advice if necessary. NCM will segregate the clients based on the criteria of the regulator and its bylaws. NCM does not provide any advisory service; the material published does not constitute advice or a recommendation for a transaction in any financial instrument. NCM accepts no responsibility for any use of the content presented and any consequences of that use. Anyone acting on the information provided does so at their own risk.