
- Contact Us:
-

-

-

-


Daily Market Updates
12 Aug 2022
EURUSD
The upbeat mood prevailed around the European currency for yet another session on Thursday, motivating EUR/USD to extend the weekly uptrend for the fourth consecutive session and reclaim once again the area beyond 1.0300 the figure.
Extra gains in the pair came in response to further weakness surrounding the greenback, as investors continued to dump the dollar on dwindling expectations of a 75 bps rate hike by the Federal Reserve at next month’s event.
Indeed, and tracked by CME Group’s FedWatch Tool, the probability of a 50 bps rate hike at the September 21 meeting is at nearly 63%, all following the lower-than-expected US inflation figures for the month of July published on Wednesday.
In the US cash markets, yields in the short and the belly of the curve traded on the defensive, while the long end extended the recent uptrend and the German 10y Bund yields remained side-lined just above the 0.90% level.
In the US docket, Producer Prices dropped 0.5% MoM in July and rose 9.8% from a year earlier. Additionally, Initial Claims rose by 262K in the week to August 6.
Next on the upside for EUR/USD emerges the August peak at 1.0368 (August 10) closely followed by the interim 55-day SMA at 1.0371 and the 6-month resistance line near 1.0390. Above the latter, the pair could accelerate its gains to the weekly high at 1.0615 (June 27) prior to the June peak at 1.0773 (June 9) and the May top at 1.0786 (May 30). In the opposite direction, the weekly low at 1.0096 (July 27) should hold the initial test ahead of the parity level. The breach of the latter exposes the 2022 low at 0.9952 (July 14) ahead of the December 2002 low at 0.9859. The daily RSI pushes higher and breaks above 56.
Resistance levels: 1.0368 1.0448 1.0462 (4H chart)
Support levels: 1.0275 1.0230 1.0201 (4H chart)
-637958374897498815.png)
USDJPY
Further weakness dragged USD/JPY to new 2-week lows in the sub-132.00 neighbourhood on Thursday, although the later rebound in US yields lent support to some selling bias in the Japanese yen and triggered a marginal bounce.
The change of direction in the pair was also favoured by the prevailing risk-on sentiment, which also put the Japanese currency under extra pressure.
There were no data releases in Japan due to the Mountain Day holiday.
If sellers keep pushing, USD/JPY should meet the next support at the 100-day SMA at 131.20, which precedes the so far August low at 130.39 (August 2) and the psychological 130.00 level. A drop below the latter is expected to put a potential test of the May low at 126.36 (May 24) back on the radar prior to the key 200-day SMA at 123.12. The initial up barrier, in the meantime, emerges at the August high at 135.58 (August 8) before the weekly top at 137.46 (July 27). The surpass of the latter could lead up to a visit to the post-BoJ peak at 138.87 (July 21) ahead of the 2022 high at 139.38 (July 13) and the round level at 140.00. The daily RSI hovers around the 41 zone.
Resistance levels: 135.58 135.79 137.42 (4H chart)
Support levels: 132.03 130.39 129.51 (4H chart)
-637958375494712912.png)
GBPUSD
GBP/USD traded in a tight range around Wednesday’s closing levels in the 1.2200 region despite the US dollar remaining at the mercy of the persistent selling pressure.
Indeed, sterling remained unable to capitalize on another negative session in the greenback amidst further improvement in the risk complex and rising UK 10y Gilt yields.
In the UK docket, the RICS House Price Balance rose 63% in July in what was the sole release on Thursday.
Further gains in cable need to clear the August high at 1.2293 (August 1) prior to the weekly peak at 1.2332 (June 27). If cleared, then the pair could attempt a visit to the weekly top at 1.2405 (June 16) ahead of the 100-day SMA at 1.2432. North from here emerges the 1.2666 level (May 27 high), which is deemed as the last defense before an assault of the psychological 1.3000 yardstick. On the flip side, sellers should meet initial support at the August low at 1.2002 (August 5) prior to the 2022 low at 1.1759 (July 14) and ahead of the 2020 low at 1.1409 (March 20). The daily RSI appears stable around the 57 area.
Resistance levels: 1.2276 1.2293 1.2332 (4H chart)
Support levels: 1.2056 1.2003 1.1963 (4H chart)
-637958375185180334.png)
AUDUSD
The unabated weakness in the greenback and the firmer note in the risk-linked galaxy encouraged AUD/USD to advance further north of the 0.7100 barrier and print new 2-month peaks near 0.7140 on Thursday.
In fact, the pair clinched the second consecutive daily gain and flirted with the important resistance at the 200-week SMA, today at 0.7125.
Collaborating with the upside bias in the pair, the commodity space kept the constructive pace for yet another session, including copper prices advancing to multi-week tops and another climb, albeit small, in prices of the tonne of iron ore.
The continuation of the uptrend in AUD/USD now targets the important 200-day SMA at 0.7150. Once cleared, spot should shift its focus to the June high at 0.7282 (June 3) prior to the weekly peak at 0.7458 (April 21). On the other hand, no support levels of note are expected until the August low at 0.6869 (August 5) before the 2022 low at 0.6681 (July 14). The breach of this region could pave the way for a move to the May 2020 low at 0.6372 (May 4) ahead of the weekly low at 0.6253 (April 21 2020). The daily RSI gathers fresh upside traction and stays close to 64.
Resistance levels: 0.7136 0.7194 0.7226 (4H chart)
Support levels: 0.6946 0.6884 0.6869 (4H chart)
-637958375811629851.png)
GOLD
Gold prices added to Wednesday’s pullback and recorded modest losses after another unsuccessful attempt to retake the $1,800 mark per ounce troy on Thursday.
The daily downtick in the precious metal came despite another retracement in the greenback, which forced the US Dollar Index (DXY) to revisit post-US CPI lows in the sub-105.00 region.
Also underpinning the decline in bullion, US yields extended the weekly corrective upside, particularly in the belly and the long end of the curve, all amidst the broad-based upbeat mood in the risk complex.
Bullion remains capped by the August top at $1,807 (August 10). The surpass of this level should encourage the yellow metal to visit the key 200-day SMA, today at $1,841, ahead of the June peak at $1,879 (June 13) and the April high at $1,998 (April 19). Bouts of weakness should prompt the metal to retreat to the August low at $1,754 (August 3) before the weekly low at $1,711 (July 27). If gold breaches the latter, then a test of the 2022 low at $1,680 (July 21) could return to the radar ahead of the 2021 low at $1,1676 (March 8) and the June 2020 low at $1,670 (June 5).
Resistance levels: $1,807 $1,814 $1,825 (4H chart)
Support levels: $1,783 $1,765 $1,757 (4H chart)
-637958376157665483.png)
CRUDE WTI
Prices of the West Texas Intermediate (WTI) extended the weekly recovery and clinched the second consecutive daily advance on the back of positive forecasts for crude oil demand for 2022 and 2023.
Indeed, in its monthly report, Paris-based International Energy Agency (IEA) raised its estimate for crude oil demand to 2.1 mbpd in 2022, citing further shift to oil from gas. The agency also expects the oil demand to surpass pre-pandemic levels in 2023 at 101.8 mbpd. The IEA, however, also left the door open to extra release of oil stock beyond October.
The continuation of the rebound motivated crude oil prices to trade at shouting distance from the always relevant 200-day SMA at $95.38, gaining already around 9% since last week’s low near the $87.00 mark per barrel (August 5).
Further buying interest could see the WTI revisit the key 200-day SMA, today at $95.38, in the near term ahead of the psychological $100.00 mark. Once surpassed, crude oil prices could move to the weekly peak at $101.87 (July 29) prior to another weekly high at $104.44 (July 19). Extra gains could pave the way for a retest of the July top at $111.42 (July 5) seconded by the weekly peak at $114.00 (June 29) and the June high at $123.66 (June 14). The resumption of the downtrend should put a visit to the August low at $87.03 (August 5) back on the radar prior to the 81.94 level (low January 24) and the 2022 low at $74.30 (January 3).
Resistance levels: $94.89 $96.55 $99.59 (4H chart)
Support levels: $91.23 $87.01 $86.74 (4H chart)
-637958376858789747.png)
DOW JONES
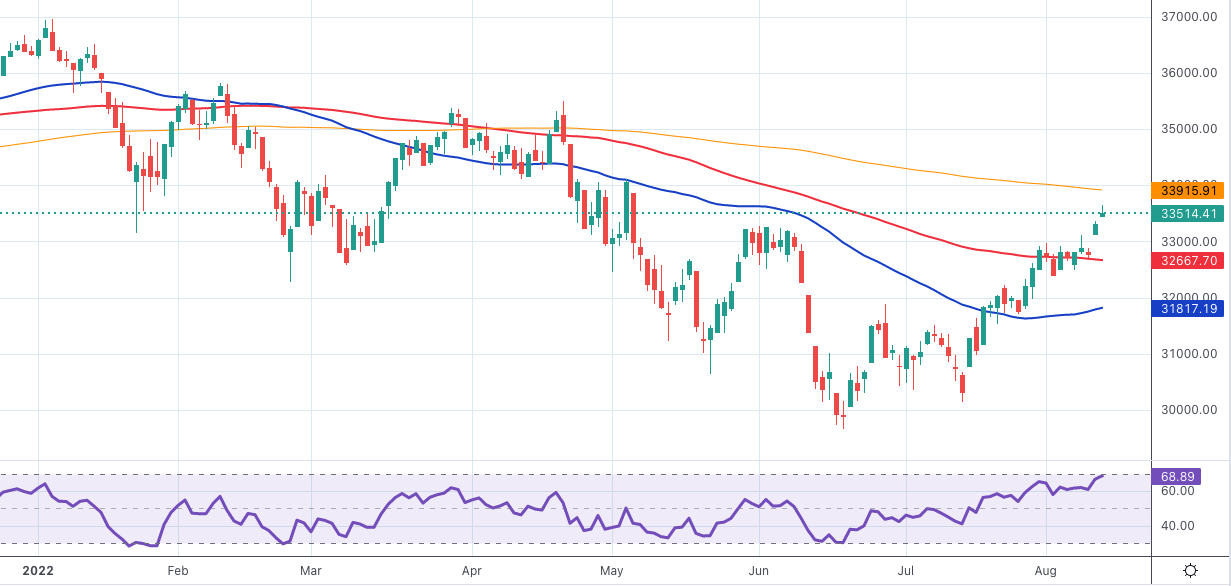
US equities extended the strong weekly rebound and traded in levels last seen back in early May.
Indeed, the Dow Jones rose 0.70% to 33,539, the S&P500 gained 0.63% to 4,236 and the tech reference Nasdaq Composite advanced 0.10% to 12,868.
The sentiment among investors improved further after US Producer Prices contracted 0.5% on a monthly basis, the first decline since June 2020, propping up further the perception that the Fed might slow down its pace of interest rate hikes. Supporting the above, weekly Claims also rose more than expected.
The Dow Jones now faces the next hurdle at the August high at 33,651 (August 11) prior to the key 200-day SMA at 33,915. Once cleared, the index could challenge the May peak at 34,117 (May 4) before the April top at 35,492 (April 21) and the February high at 35,824 (February 9). On the downside, the August low at 32,387 (August 2) precedes the weekly low at 31,705 (July 26) ahead of the July low at 30,143 (July 14). South from here turns up the 2022 low at 29,653 (June 17) prior to the 28,902 level (low November 12 2020) and the October 2020 low at 26,143 (October 30). The RSI flirts with the overbought territory near 69.
Top Performers: Walt Disney, Chevron, Dow
Worst Performers: J&J, McDonald’s, UnitedHealth
Resistance levels: 33,651 34,117 35,492 (4H chart)
Support levels: 32,387 31,705 30,143 (4H chart)
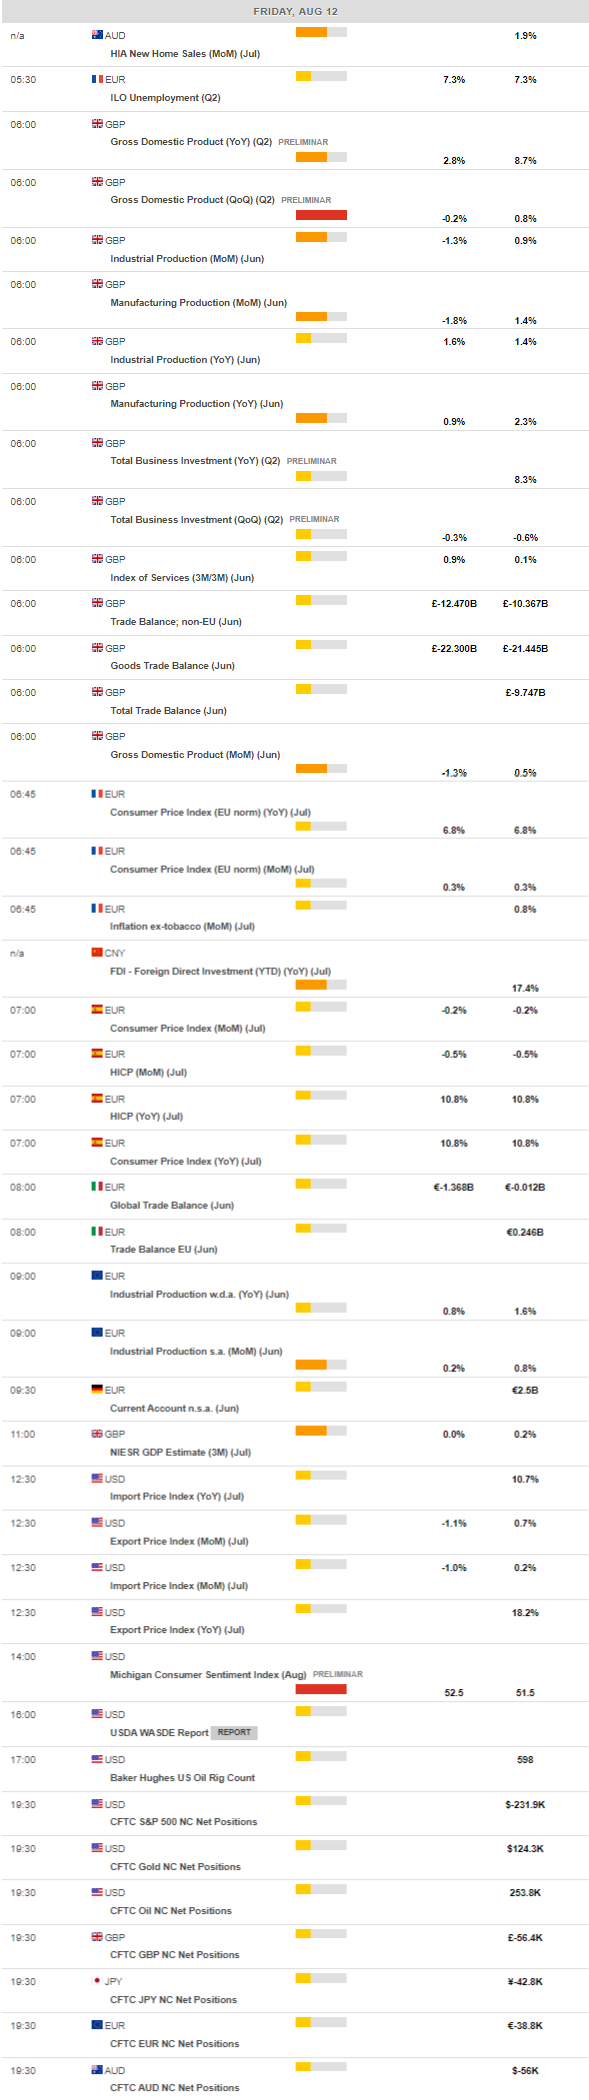
MACROECONOMIC EVENTS
All Information & Updates provided by:

All information relating to the financial markets available on this page has been prepared and issued by FXStreet (Forexstreet SL, Spain, Reg: B62498233) on the basis of publicly available information and all information believed to be reliable and does not conflict with Kuwaiti local laws, and all necessary care has been taken to before the company to ensure that the facts mentioned are correct from the source.
NCM Investment nor any of its directors or employees shall in any way be held responsible for the contents of this news, and the information contained on this page is intended only to provide clients with publicly available information and should not be construed as investment advice, report or analysis and/or constitute an offer or invitation to buy or sell financial instruments of any kind.
RISK WARNING: Forex and CFDs are highly risky leveraged products, as losses can exceed deposits. Please ensure you understand all the risks and take independent advice if necessary. NCM will segregate the clients based on the criteria of the regulator and its bylaws. NCM does not provide any advisory service; the material published does not constitute advice or a recommendation for a transaction in any financial instrument. NCM accepts no responsibility for any use of the content presented and any consequences of that use. Anyone acting on the information provided does so at their own risk.