
- Contact Us:
-

-

-

-


Daily Market Updates
15 Aug 2022
EURUSD
EUR/USD corrected markedly lower following four consecutive sessions with gains, returning to the 1.0240 zone on the back of the resumption of the bullish bias in the US dollar.
Some expected profit taking considering the recent strong advance to multi-week tops near 1.0370 in combination with fresh demand for the greenback sponsored the daily decline in spot. Despite Friday’s retracement, the pair kept intact the weekly gains after recording new 5-week peaks on August 10.
Friday’s negative performance in the pair came in tandem with fresh monthly highs in the German 10y Bund yields, which surpassed the 1.00% mark, and a modest pullback in US yields in the belly and the long end of the curve.
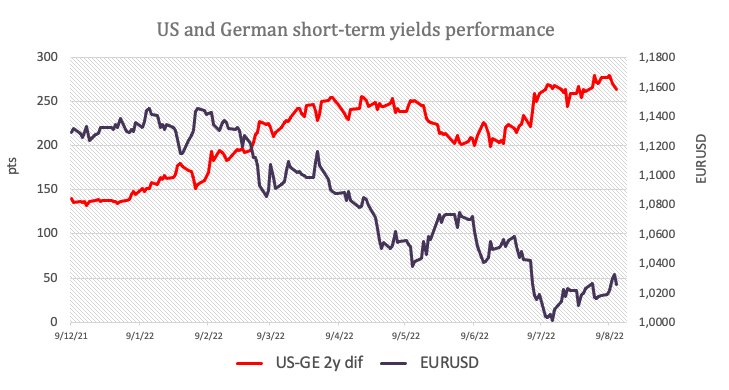
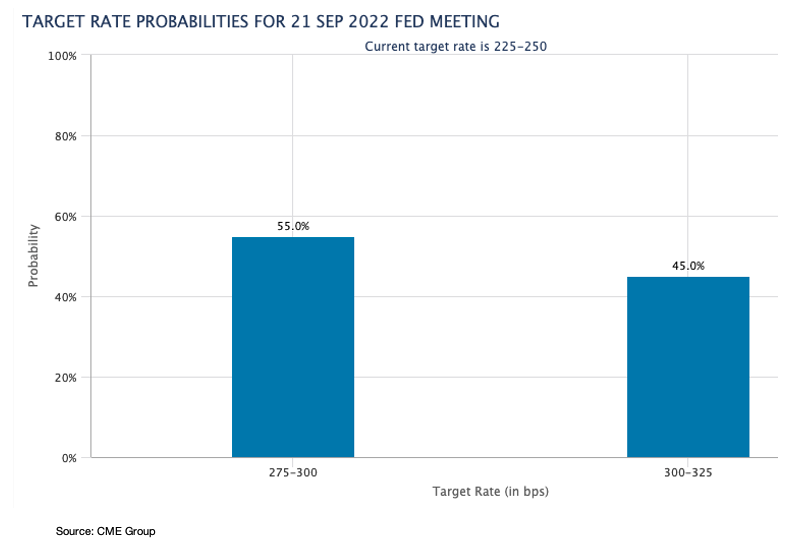
The pair’s weekly macro environment was dominated by the release of below-consensus US inflation figures for the month of July, which directly trimmed expectations of a 75 bps rate hike at the Fed’s September event, favouring a smaller move instead. On the latter, CME Group’s FedWatch Tool now sees the probability of a half point rate rise at more than 62% nearly doubling from a week ago.
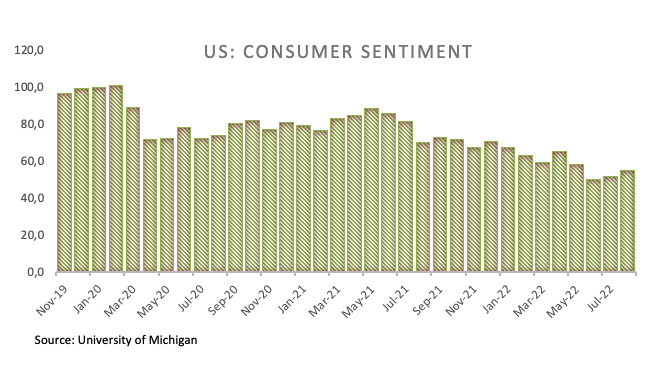
Looking at the euro docket, Industrial Production in the euro bloc expanded more than forecast 2.4% in the year to June. Across the pond, the flash U-Mich Index now sees Consumer Sentiment improving to 55.1 for the month of August.
Technicals around EUR/USD remain unchanged, with the next up barrier at the August high at 1.0368 (August 10) just ahead of the 6-month resistance line near 1.0380. If the pair clears the latter, it could pave the way for extra gains in the short-term horizon and with immediate target at the interim 100-day SMA at 1.0522 prior to the weekly top at 1.0615 (June 27). North from here turns up the June peak at 1.0773 (June 9) followed by the May high at 1.0786 (May 30). On the downside, the weekly low at 1.0096 (July 27) emerges as the initial contention before the parity level. The loss of this psychological support exposes a deeper decline to the 2022 low at 0.9952 (July 14) prior to the December 2002 low at 0.9859. The daily RSI runs out of steam and drops below 51.
Resistance levels: 1.0368 1.0448 1.0462 (4H chart)
Support levels: 1.0238 1.0222 1.0201 (4H chart)
-637960383802173965.png)
USDJPY
The resurrection of the greenback lent oxygen to USD/JPY and helped it clinch the second session in a row in the positive territory, this time falling short of the key 134.00 mark on Friday.
The negative performance of US yields in the 5y-10y band, however, removed some tailwinds from the daily upside in spot and limited daily gains somewhat.
On the political page, Japan’s PM Kishida is expected to convene a meeting to discuss rising food and energy prices on August 15.
In the Japanese calendar, Foreign Bond Investment rose to ¥827B in the week to August 6.
The continuation of the recovery in USD/JPY keeps targeting the August peak at 135.58 (August 8) ahead of the weekly high at 137.46 (July 27). If bulls push higher, then a test of the post-BoJ top at 138.87 (July 21) could re-emerge on the horizon before the 2022 peak at 139.38 (July 13) and the round level at 140.00. Conversely, bouts of weakness should meet initial support at the 100-day SMA at 131.32 prior to the August low at 130.39 (August 2), which is closely followed by the psychological 130.00 yardstick. The loss of this zone could spark a deeper retracement to the May low at 126.36 (May 24) ahead of the key 200-day SMA at 123.23. The daily RSI gains some traction and approaches 45.
Resistance levels: 133.89 135.58 135.72 (4H chart)
Support levels: 131.73 130.39 129.51 (4H chart)
-637960385430874883.png)
AUDUSD
AUD/USD was an exception amongst the riskier assets on Friday and managed to print the third consecutive daily advance north of the 0.7100 mark, all in an atmosphere dominated by the improved sentiment around the US dollar.
Indeed, the pair revisited the 0.7130 zone at the end of the week, an area coincident with the key 200-week SMA, or 2-month highs.
The upbeat mood in the buck also weighed on the commodity space, putting prices of the iron ore and copper under renewed downside pressure, therefore limiting the pair’s upside.
The Aussie docket was empty on Friday, leaving the publication of the RBA Minutes on August 16 as the next salient event.
The surpass of the August peak at 0.7136 (August 11) should motivate AUD/USD to challenge the key 200-day SMA at 0.7149. Beyond this level emerges the June top at 0.7282 (June 3) ahead of the weekly high at 0.7458 (April 21). Contrarily, if bears regain the initiative there is initial support at the 55-day SMA at 0.6960 prior to the August low at 0.6869 (August 5) and the 2022 low at 0.6681 (July 14). Extra weakness could then see the May 2020 low at 0.6372 (May 4) revisited before the weekly low at 0.6253 (April 21 2020). The daily RSI advances past 64.
Resistance levels: 0.7136 0.7194 0.7226 (4H chart)
Support levels: 0.6946 0.6897 0.6869 (4H chart)
-637960385817429664.png)
GOLD
Prices of bullion reversed two consecutive daily pullbacks and charted decent gains at the end of the week despite the resumption of the demand for the US dollar.
Price action around the ounce troy of the yellow metal finally managed to close above the key hurdle at $1,800 in a context unfavorable to the riskier assets, while the decline in US yields in the belly and the long end of the curve appears to have underpinned the metal.
Further support for gold emerged after flash readings from the U-Mich index showed 5 Year Inflation Expectations ticked higher to 3.0% in August (from 2.9%).
Further upside in gold is expected to face the initial up barrier at the August high at $1,807 (August 10) prior to the key 200-day SMA, today at $1,842, and before the June top at $1,879 (June 13). Above the latter, the metal could attempt a move to the April peak at $1,998 (April 19). Inversely, sellers initially target the August low at $1,754 (August 3) ahead of the weekly low at $1,711 (July 27). South from here emerges the 2022 low at $1,680 (July 21) before the 2021 low at $1,1676 (March 8) and the June 2020 low at $1,670 (June 5).
Resistance levels: $1,807 $1,814 $1,825 (4H chart)
Support levels: $1,783 $1,765 $1,756 (4H chart)
-637960386181771042.png)
CRUDE WTI
WTI prices seem to have met a tough hurdle around the $95.00 mark per barrel this week, an area also coincident with the key 200-day SMA.
Friday’s downtick in the commodity came after two daily gains in a row and followed renewed recession concerns, while the resumption of the activity in several oil and gas fields in the Gulf of Mexico after a leak forced these facilities to close on Thursday also added to the downside pressure.
The WTI managed to close the week with fair gains, although it kept navigating the third consecutive month in the negative territory.
Of note the past week, however, was the divergence in monthly reports from the OPEC+ and the IEA. Indeed, while the latter raised its demand outlook for the current year on the back of oil-gas switching, the cartel reduced its outlook citing recession concerns.
Finishing the weekly calendar, driller Baker Hughes reported US oil rig count went up by 3 in the week to August 12, taking the total active oil rigs to 601.
In case the recovery gathers a more serious traction, the WTI is expected to meet the next up barrier at the key 200-day SMA at $95.44 prior to the psychological $100.00 mark. The breakout of this important hurdle should lead up to a probable test of the weekly high at $101.87 (July 29) before another weekly top at $104.44 (July 19). Further up comes the July peak at $111.42 (July 5) ahead of the weekly high at $114.00 (June 29) and the June top at $123.66 (June 14). In the opposite direction, the August low at $87.03 (August 5) should hold the initial test ahead of the 81.94 level (low January 24) and the 2022 low at $74.30 (January 3).
Resistance levels: $95.04 $96.55 $99.59 (4H chart)
Support levels: $91.16 $87.01 $86.74 (4H chart)
-637960386963936100.png)
DOW JONES
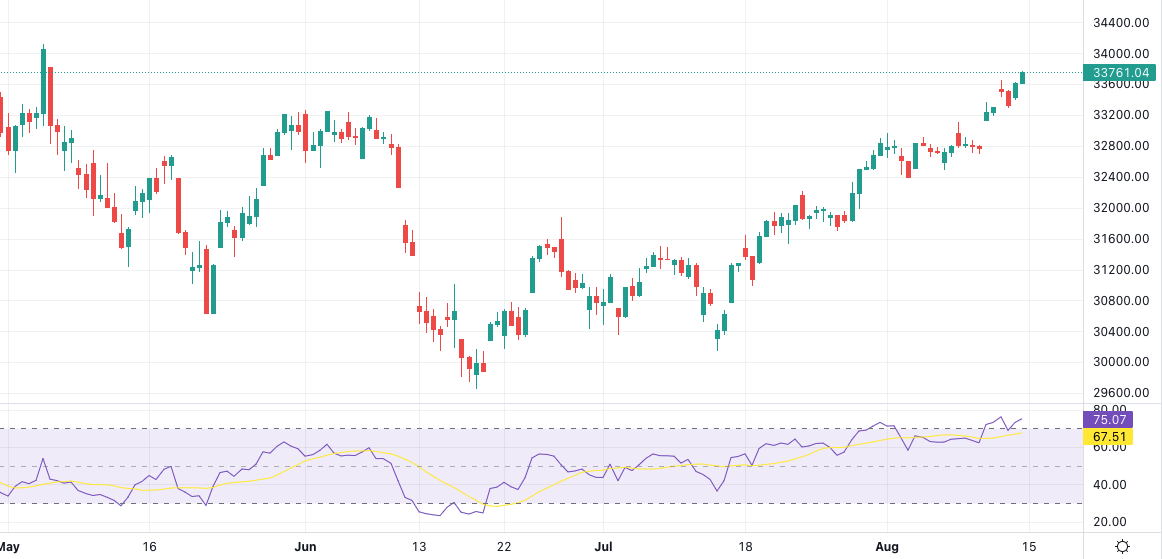
Equities tracked by the three major US stock indices navigated a “sea of green” on Friday, motivating these indices to extend the positive streak for the fourth consecutive week. Furthermore, all three indices ended at/near session highs.
The optimism among investors was underpinned by the rising perception that US inflation might have peaked – as per July’s CPI readings – which should in turn prompt the Fed to slow down its aggressive plans to tighten the monetary conditions.
On this, CME Group’s FedWatch Tool sees the probability of a 50 bps rate hike at the Fed’s September gathering at around 55%, from nearly 32% a week ago.
All in all, the Dow Jones gained 0.70% to 33,539, the S&P500 advanced 0.63% to 4,236 and the tech-heavy Nasdaq Composite rose 0.10% to 12,868.
No changes to the topside in the Dow Jones, which continues to target the August peak at 33,767 (August 11), which is closely followed by the key 200-day SMA at 33,904. If the index extends its march north, the next hurdle of relevance is expected to emerge at the May top at 34,117 (May 4) prior to the April high at 35,492 (April 21) and the February peak at 35,824 (February 9). In case bears regain the upper hand, the 100-day SMA at 32,656 should offer temporary support ahead of the August low at 32,387 (August 2). A deeper decline could see the weekly low at 31,705 (July 26) revisited prior to the July low at 30,143 (July 14). Extra losses should then dispute the 2022 low at 29,653 (June 17) ahead of the 28,902 level (low November 12 2020) and the October 2020 low at 26,143 (October 30). The RSI enters the overbought territory above 71.
Top Performers: Walt Disney, Merck&Co, Apple
Worst Performers: J&J, Amgen, Visa A
Resistance levels: 33,767 34,117 35,492 (4H chart)
Support levels: 32,650 32,489 32,387 (4H chart)
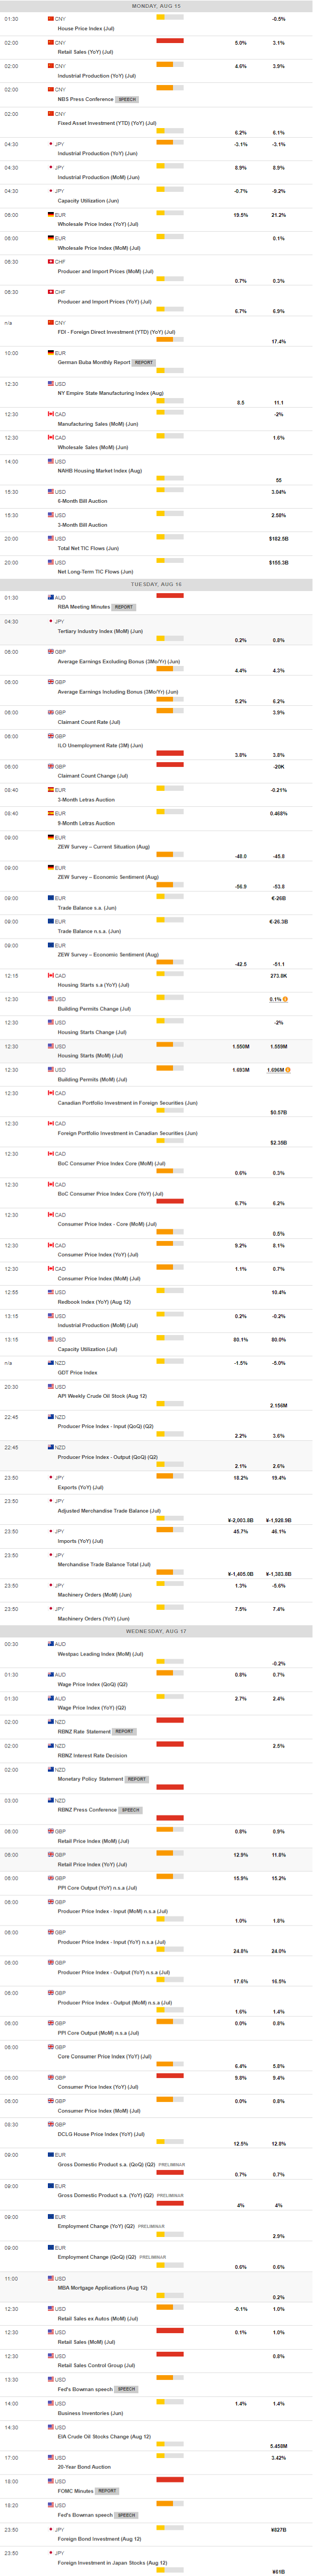
MACROECONOMIC EVENTS
All Information & Updates provided by:

All information relating to the financial markets available on this page has been prepared and issued by FXStreet (Forexstreet SL, Spain, Reg: B62498233) on the basis of publicly available information and all information believed to be reliable and does not conflict with Kuwaiti local laws, and all necessary care has been taken to before the company to ensure that the facts mentioned are correct from the source.
NCM Investment nor any of its directors or employees shall in any way be held responsible for the contents of this news, and the information contained on this page is intended only to provide clients with publicly available information and should not be construed as investment advice, report or analysis and/or constitute an offer or invitation to buy or sell financial instruments of any kind.
RISK WARNING: Forex and CFDs are highly risky leveraged products, as losses can exceed deposits. Please ensure you understand all the risks and take independent advice if necessary. NCM will segregate the clients based on the criteria of the regulator and its bylaws. NCM does not provide any advisory service; the material published does not constitute advice or a recommendation for a transaction in any financial instrument. NCM accepts no responsibility for any use of the content presented and any consequences of that use. Anyone acting on the information provided does so at their own risk.