
- Contact Us:
-

-

-

-


Daily Market Updates
16 Aug 2022
EURUSD
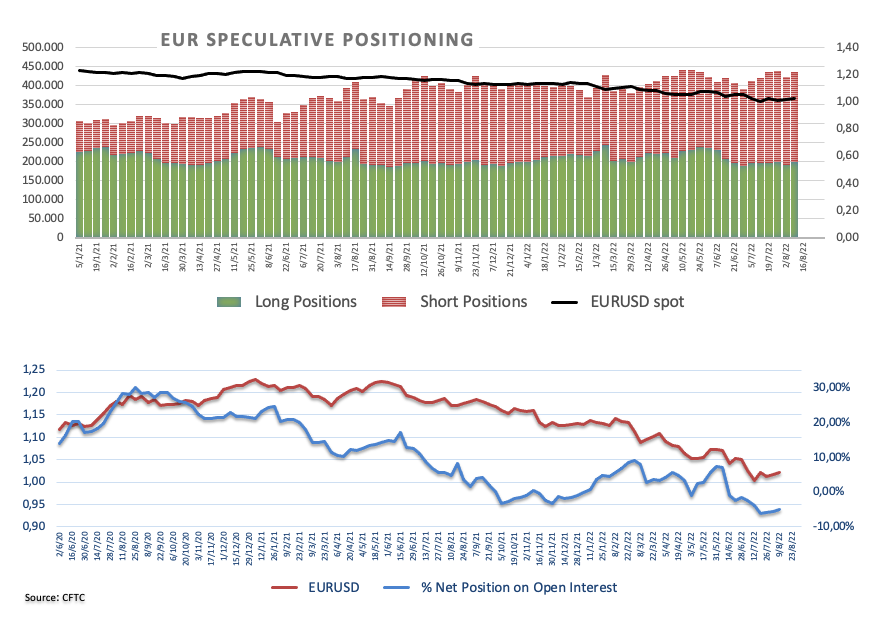
Further improvement in the sentiment surrounding the US dollar put once again the risk complex under pressure at the beginning of a new trading week, this time dragging EUR/USD to fresh multi-day lows in the 1.0170/65 band.
Chinese data released earlier in the Asian trading hours coupled with the small interest rate cut by the PBoC kept the appetite for the riskier assets subdued and motivated the US Dollar Index (DXY) to extend gains north of the 106.00 barrier, adding to Friday’s advance.
In the meantime, money markets in the US and Germany showed yields navigating on the defensive amidst the persistent risk-off environment.
From the speculators’ view, net shorts in the European currency retreated to 4-week lows in the week ended on August 9 as per the latest CFTC Positioning Report. Indeed, while risk aversion initially dominated the scenery in the period under scrutiny due to Pelosi’s trip to Taiwan, the later resurgence of the preference for the risk complex sponsored a recovery in spot.
There were no publications/events in Euroland on Monday, whereas the US docket showed the NAHB Index at 49 in August (from 55) and the NY Empire State Manufacturing Index at -31.3 in the same month (from 11.1).
A deeper decline in EUR/USD is expected to initially challenge the weekly low at 1.0122 (August 3) ahead of another weekly low at 1.0096 (July 27) and prior to the parity level. The breach of this key support should open the door to the 2022 low at 0.9952 (July 14) ahead of the December 2002 low at 0.9859. On the upside, the August peak at 1.0368 (August 10) emerges as the big magnet for bulls. This area is reinforced by the 6-month resistance and could spark sustained gains once cleared in a convincing fashion. Against that, the next target appears at the temporary 100-day SMA at 1.0514 before the weekly high at 1.0615 (June 27). The breakout of the latter could pave the way for a visit to the June top at 1.0773 (June 9) ahead of the May peak at 1.0786 (May 30). The daily RSI loses momentum and drops below 45.
Resistance levels: 1.0210 1.0368 1.0448 (4H chart)
Support levels: 1.0168 1.0141 1.0122 (4H chart)
-637961831408364047.png)
USDJPY
The re-emergence of the risk aversion lent extra legs to the demand for the safe haven yen, dragging USD/JPY back below the 133.00 mark at the beginning of the week, all in response to disappointing results from Chinese fundamentals reported earlier on Monday.
In addition, further weakness in US yields across the curve also favoured the appreciation of the Japanese currency.
In Japan, preliminary results saw the GDP Growth Rate expand 2.2% YoY in Q2 and 0.5% QoQ. Additionally, final figures noted the Industrial Production contracted at an annualized 2.8% in June.
USD/JPY seems somewhat consolidative and faces the next support at the weekly low at 131.73 (August 11) just ahead of the 100-day SMA at 131.41 and before the August low at 130.39 (August 2), which precedes the psychological 130.00 level. The breach of the latter could pave the way for a deeper drop to the May low at 126.36 (May 24) prior to the key 200-day SMA at 123.23. Occasional bullish attempts should meet immediate resistance at the August high at 135.58 (August 8) before the weekly peak at 137.46 (July 27). Further north emerges the post-BoJ top at 138.87 (July 21) seconded by the 2022 high at 139.38 (July 13) and the round level at 140.00. The daily RSI picks up further downside traction and approaches 43.
Resistance levels: 133.89 135.58 135.72 (4H chart)
Support levels: 132.55 131.73 130.39 (4H chart)
-637961833314454799.png)
GBPUSD
GBP/USD extended the leg lower for the third session in a row and revisited the 1.2050 region against the backdrop of the intense recovery in the US dollar along with the rising offered stance in the risk-linked galaxy.
In fact, poor results from the Chinese docket during early trade supported further the resurgence of the risk aversion, which in turn magnified the upside bias in the buck.
In line with the global debt markets, the UK 10y Gilt yields edged lower on Monday, although they still traded above the key 2.00% mark.
No releases in the UK calendar on Monday left all the attention to the release of key UK jobs report on Tuesday.
The maintenance of the selling bias could force GBP/USD to revisit the August low at 1.2002 (August 5) before the 2022 low at 1.1759 (July 14) and followed by the 2020 low at 1.1409 (March 20). Conversely, the August high at 1.2293 (August 1) emerges as the immediate up barrier seconded by the weekly peak at 1.2332 (June 27) and another weekly top at 1.2405 (June 16), which closely precedes the 100-day SMA at 1.2412. Up from here comes the 1.2666 level (May 27 high) ahead of the psychological 1.3000 yardstick. The daily RSI comes under pressure and slips back near 47.
Resistance levels: 1.2215 1.2249 1.2276 (4H chart)
Support levels: 1.2049 1.2003 1.1963 (4H chart)
-637961832877677286.png)
AUDUSD
AUD/USD corrected sharply lower and revisited the proximity of the key support at the 0.7000 mark in what was a poor start of the new trading week.
The sustained advance in the greenback in a context of renewed risk aversion weighed on the Aussie dollar and its risky peers on Monday, motivating the spot to retreat to new 3-day lows.
AUD also suffered the poor prints from the Chinese docket as well as the negative performance of the commodity universe, where prices of the tonne of iron ore extended the pullback for the third session in a row.
The next event of note in the Australian docket will be Tuesday’s publication of the RBA Minutes of the August meeting.
Further weakness is expected to meet the next temporary support at the 55-day SMA at 0.6957 ahead of the August low at 0.6869 (August 5). The breakdown of this level could lead up to a deeper decline to the 2022 low at 0.6681 (July 14) ahead of the May 2020 low at 0.6372 (May 4) and the weekly low at 0.6253 (April 21 2020). In the opposite direction, the immediate hurdle appears at the August peak at 0.7136 (August 11) just ahead of the key 200-day SMA at 0.7147. The surpass of this area exposes a potential move to the June high at 0.7282 (June 3) prior to the weekly top at 0.7458 (April 21). The daily RSI retreats to the sub-55 region, in line with the marked drop in spot.
Resistance levels: 0.7136 0.7194 0.7226 (4H chart)
Support levels: 0.7011 0.6946 0.6897 (4H chart)
-637961833914934781.png)
GOLD
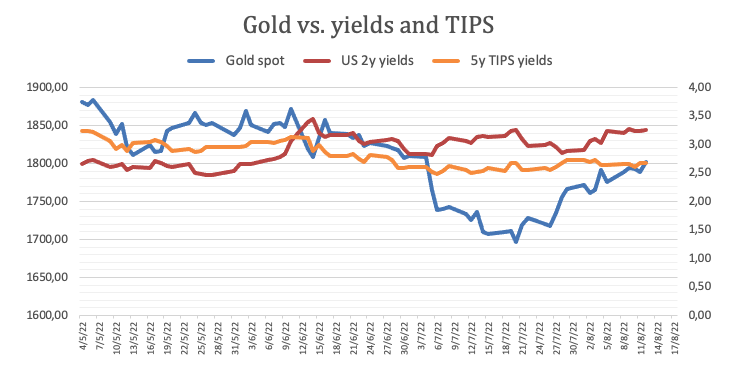
Gold prices retreated sharply to new multi-day lows near $1,770 on the back of the continuation of the upside momentum in the greenback, which motivated the US Dollar Index (DXY) to reclaim the 106.00 barrier and well north on Monday.
In fact, bullion started the session around Friday’s close near $1,800 per ounce troy, although those levels did not stick and the precious metal ended the session succumbing to the intense buying pressure in the dollar in a context dominated by the risk aversion.
However, declining US yields across the curve somewhat helped the precious metal to trim part of the daily losses.
In case the selling pressure in gold gathers extra steam, initial support appears at $1,773 (low August 15) ahead of the August low at $1,754 (August 3). Further south turns up the weekly low at $1,711 (July 27) seconded by the 2022 low at $1,680 (July 21) ahead of the 2021 low at $1,1676 (March 8) and the June 2020 low at $1,670 (June 5). On the flip side, there is an initial hurdle at the August peak at $1,807 (August 10) ahead of the key 200-day SMA at $1,842. The surpass of this region could open the door to a test of the June high at $1,879 (June 13) prior to the April top at $1,998 (April 19).
Resistance levels: $1,807 $1,814 $1,825 (4H chart)
Support levels: $1,773 $1,765 $1,756 (4H chart)
-637961834389429219.png)
CRUDE WTI
Prices of the West Texas Intermediate (WTI) traded well on the defensive and added to Friday’s decline on Monday, briefly recording new monthly lows in the sub-$87.00 region per barrel.
In fact, crude oil saw its sentiment deteriorate further after Monday’s results in Chinese fundamentals hinted at a potential slowdown of the economy, while the door for a US-Iran deal to revive the 2015 nuclear agreement opened further after Tehran said it will announce its position on the UN draft later on Monday.
Adding to the sour mood around the commodity, Saudi oil giant Aramco said it is ready to increase its oil output to its full capacity (12 mbpd) if asked by the government.
Crude oil remains under pressure and a drop below August low at $86.84 (August 15) could prompt the 81.94 level (low January 24) to emerge on the horizon ahead of the 2022 low at $74.30 (January 3). On the upside, the next hurdle remains at the key 200-day SMA at $95.49 before the psychological $100.00 mark. If the WTI breaks above the latter it could introduce a probable visit to the weekly peak at $101.87 (July 29) ahead of another weekly high at $104.44 (July 19) and the July top at $111.42 (July 5). North from here turns up the weekly peak at $114.00 (June 29) followed by the June high at $123.66 (June 14).
Resistance levels: $95.04 $96.55 $99.59 (4H chart)
Support levels: $86.82 $81.90 $77.82 (4H chart)
-637961835074960707.png)
DOW JONES
US equities tracked by the three major stock indices extended the optimism for yet another session and revisited levels last seen back in early May on Monday, entering at the same time their fifth consecutive week in the positive territory.
Gains in the tech sector coupled with the perception that inflation might have peaked and the Fed might not need to be as aggressive as initially planned when it comes to rate hikes lifted investors’ spirits on Monday and helped offset worries over a potential slowdown in the Chinese economy.
All in all, the Dow Jones rose 0.37% to 33,886, the S&P500 gained 0.24% to 4,290 and the tech reference Nasdaq Composite advanced 0.51% to 13,113.
The Dow Jones flirts with the key 200-day SMA just below the key 34,000 mark. Further upside could now challenge the May high at 34,117 (May 4) ahead of the April top at 35,492 (April 21) and the February peak at 35,824 (February 9). In opposition, there is an interim support at the 100-day SMA at 32,648 before the August low at 32,387 (August 2) and the 55-day SMA at 31,879. If breached, then the index could slip back further and revisit the weekly low at 31,534 (July 21) ahead of the July low at 30,143 (July 14). Down from here emerges the 2022 low at 29,653 (June 17) prior to the 28,902 level (low November 12 2020) and the October 2020 low at 26,143 (October 30). The RSI trespasses the overbought territory past 72.
Top Performers: Walt Disney, Visa A, Boeing
Worst Performers: Chevron, Dow, Merck&Co
Resistance levels: 33,954 34,117 35,492 (4H chart)
Support levels: 32,664150 32,489 32,387 (4H chart)
-637961836017212531.png)
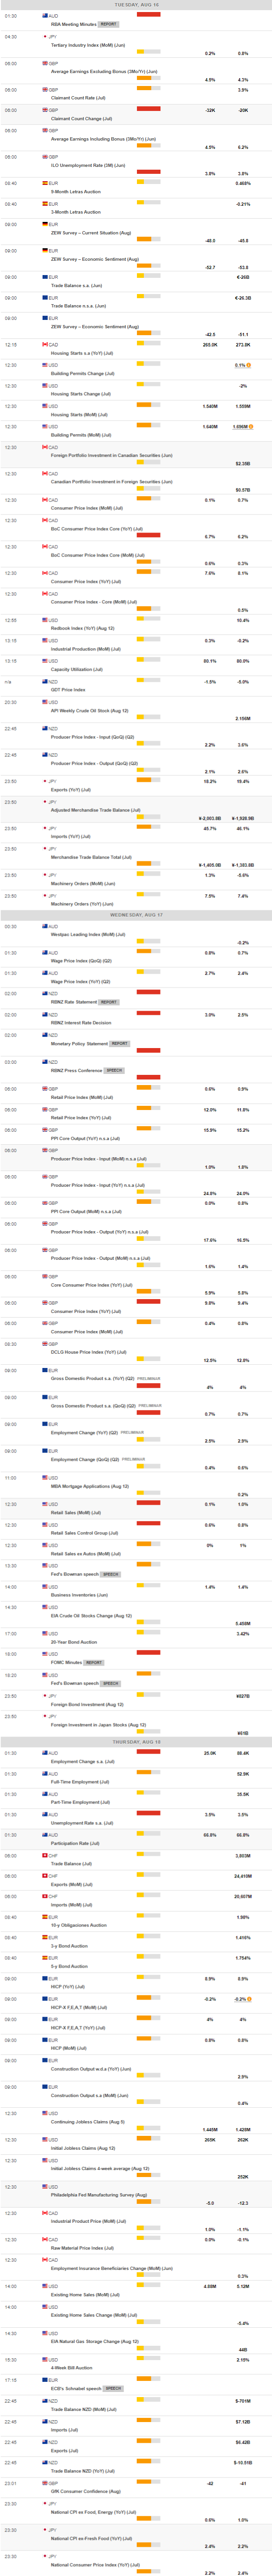
MACROECONOMIC EVENTS
All Information & Updates provided by:

All information relating to the financial markets available on this page has been prepared and issued by FXStreet (Forexstreet SL, Spain, Reg: B62498233) on the basis of publicly available information and all information believed to be reliable and does not conflict with Kuwaiti local laws, and all necessary care has been taken to before the company to ensure that the facts mentioned are correct from the source.
NCM Investment nor any of its directors or employees shall in any way be held responsible for the contents of this news, and the information contained on this page is intended only to provide clients with publicly available information and should not be construed as investment advice, report or analysis and/or constitute an offer or invitation to buy or sell financial instruments of any kind.
RISK WARNING: Forex and CFDs are highly risky leveraged products, as losses can exceed deposits. Please ensure you understand all the risks and take independent advice if necessary. NCM will segregate the clients based on the criteria of the regulator and its bylaws. NCM does not provide any advisory service; the material published does not constitute advice or a recommendation for a transaction in any financial instrument. NCM accepts no responsibility for any use of the content presented and any consequences of that use. Anyone acting on the information provided does so at their own risk.