
- Contact Us:
-

-

-

-


Daily Market Updates
17 Aug 2022
EURUSD
EUR/USD saw its decline accentuated and retreated to the 1.0120 region, as risk aversion ruled the sentiment in the first part of the day. The pair, however, regained composure later and rebounded to the vicinity of 1.0200, ending the session with decent gains on Tuesday,
In the meantime, the US Dollar Index (DXY) flirted with the boundaries of the 107.00 barrier, or 2-week highs, although it gave away almost all of those gains following the late pick up in the risk complex.
Also echoing the better mood in the riskier assets, US yields left behind the recent weakness and edged higher.
Furthermore, the risk complex regained the smile and managed to offset the recent weaker-than-expected prints from Chinese fundamentals, which eventually sponsored the resumption of the risk aversion as well as the demand for the buck.
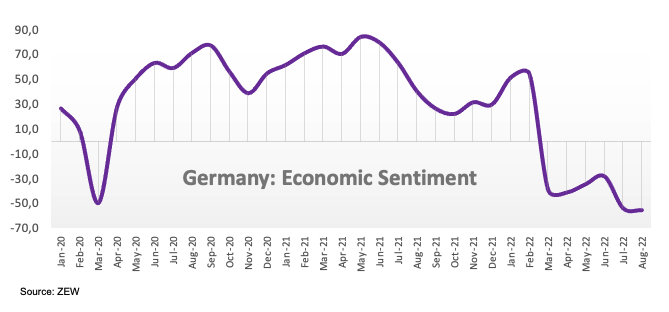
In the docket, the Economic Sentiment in both Germany and the broader Euroland gauged by the ZEW survey worsened to -55.3 and -54.9, respectively, in August. Still in the euro area, the trade deficit shrank a tad to €24.6B in June. In the US data space, Housing Starts contracted 9.6% MoM in July, or 1.446M units, and Building Permits contracted 1.3% from a month earlier, or 1.674M units. In addition, Industrial Production increased 0.6% MoM in July and 3.9% over the last twelve months.
The continuation of the offered bias in EUR/USD could drag the pair to the weekly low \ at 1.0096 (July 27) ahead of the parity level. The loss of this psychological support could expose a move to the 2022 low at 0.9952 (July 14) prior to the December 2002 low at 0.9859. Conversely, bulls continue to initially target the August high at 1.0368 (August 10), which coincides with the 6-month resistance line. Above this resistance area, the pair could extend the rebound further and confront the temporary 100-day SMA at 1.0504 ahead of the weekly peak at 1.0615 (June 27). Further north emerges the June top at 1.0773 (June 9) before the May high at 1.0786 (May 30). The daily RSI picks up some pace and approaches 45.
Resistance levels: 1.0204 1.0268 1.0324 (4H chart)
Support levels: 1.0124 1.0096 1.0006 (4H chart)
-637962690374730963.png)
USDJPY
USD/JPY rose sharply to 4-day highs and retested the 134.70 region, as the Japanese yen was the worst performer on Tuesday.
Indeed, the late pick up in the sentiment around the riskier assets along with the marked rebound in US yields across the curve seem to have been enough to ignite a strong rebound in the pair, which managed to partially recover the ground lost during last week’s sell-off.
In the Japanese calendar, the Tertiary Industry Index contracted at a monthly 0.2% in June.
In light of the recent price action, USD/JPY now faces the next hurdle at the interim 55-day SMA at 134.96 seconded by the August top at 135.58 (August 8) and the weekly high at 137.46 (July 27). The surpass of the latter could open the door to the post-BoJ peak at 138.87 (July 21) before by the 2022 high at 139.38 (July 13) and the round level at 140.00. On the downside, the weekly low at 131.73 (August 11) should hold the initial test prior to the 100-day SMA at 131.53 and the August low at 130.39 (August 2). South from here emerges the psychological 130.00 level ahead of the May low at 126.36 (May 24) and before the key 200-day SMA at 123.44. The daily RSI gathers some traction and approaches 50.
Resistance levels: 134.67 135.55 137.46 (4H chart)
Support levels: 132.55 131.73 130.39 (4H chart)
-637962692076479928.png)
GBPUSD
GBP/USD reversed three straight sessions with losses and trespassed once again the key barrier in the 1.2100 neighbourhood on Tuesday, always against the backdrop of the marked recovery in the risk-linked galaxy and the loss of momentum in the greenback.
The British pound traded on the positive foot and bounced off the proximity of 1.2000 following the lack of upside traction in the greenback and despite the UK labour market showing mixed results.
Indeed, the Unemployment Rate stayed put at 3.8% in June, while the Employment Change increased less than expected by 160K persons in May. Additional results saw the Claimant Count Change shrink by 10.5K people in July and the Average Hourly Earnings incl. Bonus expanded 5.1% 3Mo/Year in June.
Extra weakness could prompt GBP/USD to dispute the August low at 1.2002 (August 5), which once cleared it should pave the way for a deeper retracement to the 2022 low at 1.1759 (July 14) and the 2020 low at 1.1409 (March 20). On the flip side, there is a temporary hurdle at the 55-day SMA at 1.2152 prior to the August peak at 1.2293 (August 1). The continuation of the uptrend should put a potential visit to the weekly top at 1.2332 (June 27) back on the radar before another weekly high at 1.2405 (June 16). The latter now appears underpinned by the 100-day SMA at 1.2401. The surpass of this area of resistance unveils a probable test of the 1.2666 level (May 27 high) prior to the psychological 1.3000 mark. The daily RSI edges higher and pierces the 47 level.
Resistance levels: 1.2047 1.2148 1.2215 (4H chart)
Support levels: 1.2002 1.1963 1.1889 (4H chart)
-637962691645242594.png)
AUDUSD
AUD/USD added to the negative start of the trading week and dropped to 4-day lows in the sub-0.7000 region, where some decent support appears to have turned up.
Indeed, the initial strength in the greenback coupled with persevering risk aversion and concerns surrounding Chinese fundamentals weighed on the Aussie dollar and kept the pair’s price action depressed for the second session in a row.
Further downside also came from the mixed performance of commodities, where copper prices partially reversed the recent weakness vs. the continuation of the downtrend in prices of the tonne of iron ore.
No impact on AUD from the publication of the RBA Minutes, which showed a hawkish tone after members expected inflation to peak later in 2022, while additional steps toward normalizing the monetary conditions remain on the table in the next months, albeit not on a predetermined path.
In case sellers remain in control in the near term, AUD/USD faces the next support at the weekly low at 0.6991 (August 16) ahead of the 55-day SMA at 0.6954. The breakdown of this level exposes the August low at 0.6869 (August 5) prior to the 2022 low at 0.6681 (July 14). Further down appears the May 2020 low at 0.6372 (May 4) followed by the weekly low at 0.6253 (April 21 2020). The immediate up barrier aligns at the August high at 0.7136 (August 11), which precedes the always-important 200-day SMA at 0.7145. Once cleared, the June top at 0.7282 (June 3) could re-emerge on the horizon ahead of the weekly peak at 0.7458 (April 21). The daily RSI eases a tad to the sub-54 zone.
Resistance levels: 0.7136 0.7194 0.7226 (4H chart)
Support levels: 0.6991 0.6946 0.6906 (4H chart)
-637962692395460758.png)
GOLD
Prices of the ounce troy of gold lost further ground and retreated to multi-session lows in the $1,770 region on turnaround Tuesday.
The late recovery in the risk complex in combination with the decent bounce in US yields across the curve kept the non-yielder metal under pressure and forced it to extend the bearish note in the first half of the week.
Moving forward, bullion could face bouts of volatility in the next hours in light of the publication of the FOMC Minutes late on Wednesday, where members’ views of the next steps regarding the Fed’s normalization process are expected to be in the centre of the debate.
The August low at $1,754 (August 3) now emerges as the next contention of note in case gold bears push harder. A deeper retracement could expose a visit to the weekly low at $1,711 (July 27) prior to the 2022 low at $1,680 (July 21) and the 2021 low at $1,1676 (March 8), which is closely followed by the June 2020 low at $1,670 (June 5). In the opposite direction, the August high at $1,807 (August 10) emerges as the immediate hurdle ahead of the 100- and 200-day SMAs at $1,834 and $1,841, respectively. If the precious metal leaves behind the latter it could then challenge the June top at $1,879 (June 13) ahead of the April peak at $1,998 (April 19).
Resistance levels: $1,807 $1,814 $1,825 (4H chart)
Support levels: $1,771 $1,765 $1,754 (4H chart)
-637962692738388962.png)
CRUDE WTI
WTI prices remained depressed and dropped further south of the $87.00 mark per barrel to clinch new lows in levels last seen in late January on Tuesday.
Price action around crude oil is predicted to remain prudent in light of persevering chatter around a potential slowdown in China and the progress of the US-EU-Iran talks to revive the 201y nuclear deal.
It is worth recalling that a positive outcome of the latter should see around 1 mbpd of Iranian crude oil return to the markets.
Later on Tuesday, the API will report on the US crude oil supplies in the week to August 12.
Prices of the WTI risk a deeper decline if they break below the August low at $86.84 (August 15). Against that, a test of the 81.94 level (low January 24) could return to the traders’ radar in the near term and spark a drop to the 2022 low at $74.30 (January 3). On the contrary, the immediate up barrier aligns at the weekly high at $95.04 (August 11) just before the key 200-day SMA at $95.52. Further north comes the psychological $100.00 mark prior to the weekly top at $101.87 (July 29) and another weekly peak at $104.44 (July 19). The surpass of this level could open the door to the July high at $111.42 (July 5) ahead of the weekly top at $114.00 (June 29) and the June peak at $123.66 (June 14).
Resistance levels: $90.63 $95.04 $96.55 (4H chart)
Support levels: $86.10 $81.90 $77.82 (4H chart)
-637962693454221629.png)
DOW JONES
Equities tracked by the Dow Jones extended the ongoing rally and briefly surpassed the key 34,000 mark for the first time since late April on Tuesday.
The move higher in the index came on the back of the positive performance from the retail sector. That, plus the perception the inflation might have peaked added to the upbeat sentiment surrounding the index.
All in all, the Dow Jones gained 0.86% to 34,202, the S&P500 rose 0.35% to 4,311 and the tech-heavy Nasdaq Composite retreated 0.10% to 13,114.
A sustained advance past the 200-day SMA at 33,889 should lend further legs to the Dow Jones and motivate it to dispute the April high at 35,492 (April 21) followed by the February top at 35,824 (February 9). On the other hand, the 100-day SMA at 32,645 offers temporary contention ahead of the August low at 32,387 (August 2) and the 55-day SMA at 31,904. The loss of this level could pave the way for a deeper retracement to the weekly low at 31,534 (July 21) before the July low at 30,143 (July 14) and the 2022 low at 29,653 (June 17). The RSI extends the move into the overbought territory, this time beyond 73.
Top Performers: Walmart, Home Depot, Walgreen Boots
Worst Performers: Salesforce.com, Visa A, 3M
Resistance levels: 34,209 35,492 35,824 (4H chart)
Support levels: 32,639 32,387 31,705 (4H chart)
-637962693825527185.png)
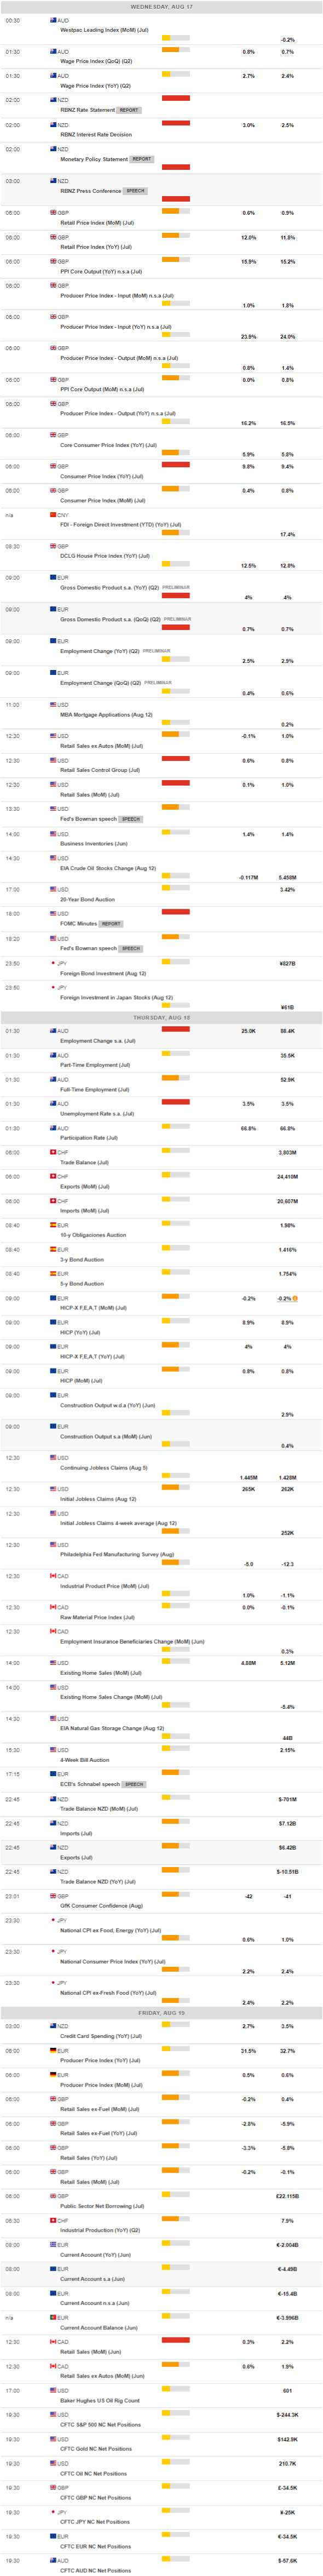
MACROECONOMIC EVENTS
All Information & Updates provided by:

All information relating to the financial markets available on this page has been prepared and issued by FXStreet (Forexstreet SL, Spain, Reg: B62498233) on the basis of publicly available information and all information believed to be reliable and does not conflict with Kuwaiti local laws, and all necessary care has been taken to before the company to ensure that the facts mentioned are correct from the source.
NCM Investment nor any of its directors or employees shall in any way be held responsible for the contents of this news, and the information contained on this page is intended only to provide clients with publicly available information and should not be construed as investment advice, report or analysis and/or constitute an offer or invitation to buy or sell financial instruments of any kind.
RISK WARNING: Forex and CFDs are highly risky leveraged products, as losses can exceed deposits. Please ensure you understand all the risks and take independent advice if necessary. NCM will segregate the clients based on the criteria of the regulator and its bylaws. NCM does not provide any advisory service; the material published does not constitute advice or a recommendation for a transaction in any financial instrument. NCM accepts no responsibility for any use of the content presented and any consequences of that use. Anyone acting on the information provided does so at their own risk.