
- Contact Us:
-

-

-

-


Daily Market Updates
18 Aug 2022
EURUSD
EUR/USD charted decent gains near the 1.0200 zone following the loss of momentum in the greenback, particularly in the wake of the publication of the FOMC Minutes.
On the latter, the dollar shed ground and US yields retreated from daily highs after FOMC members unanimously favoured a 75 bps rate hike in July. In addition, some participants saw the hazard the Fed could tighten its policy more than needed. Members also noted that the health of the labour market is supportive of an economic activity stronger than that reflected in Q2, and therefore opened the door to some revision. Still on the Minutes, participants agreed that there was little evidence that inflationary pressures were subsiding, while the pace of further hikes and the extent of the tightening process remained data/risk dependent.
Following the release of the FOMC Minutes, CME Group’s FedWatch Tool now places the probability of a 50 bps rate hike in September at more than 57% vs. nearly 43% when it comes to a 75 bps raise.
In the US calendar, MBA Mortgage Applications contracted 2.3% in the week to August 12, while Retail Sales came in flat on a monthly basis in July and Business Inventories increased at a monthly 1.4% in June.
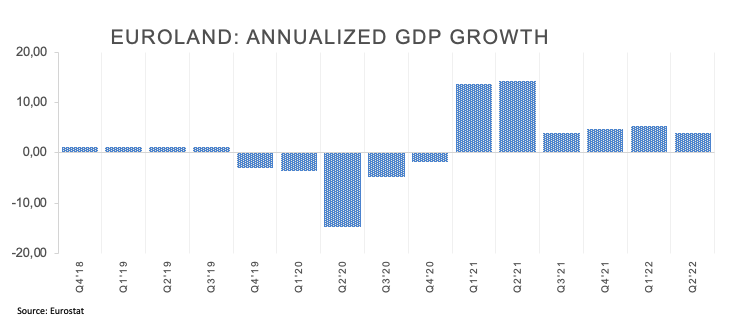
In the euro docket, another revision of Q2 GDP Growth Rate now expects the economy to expand 3.9% over the last twelve months, a tad below the previous reading at 4.0%.
If EUR/USD breaches the weekly low at 1.0096 (July 27) it could see its losses accelerate to the parity level ahead of the 2022 low at 0.9952 (July 14), which precedes the December 2002 low at 0.9859. Oppositely, there is a temporary hurdle at the 55-day SMA at 1.0332 prior to the August peak at 1.0368 (August 10), a region coincident with the 6-month resistance line. Once the pair clears this zone, it should be able to extend the recovery to the interim 100-day SMA at 1.0495 prior to the weekly top at 1.0615 (June 27). The surpass of this level exposes the June high at 1.0773 (June 9) prior to the May peak at 1.0786 (May 30). The daily RSI ticks a tad higher near 47.
Resistance levels: 1.0198 1.0268 1.0324 (4H chart)
Support levels: 1.0122 1.0096 1.0006 (4H chart)
-637963586580804063.png)
USDJPY
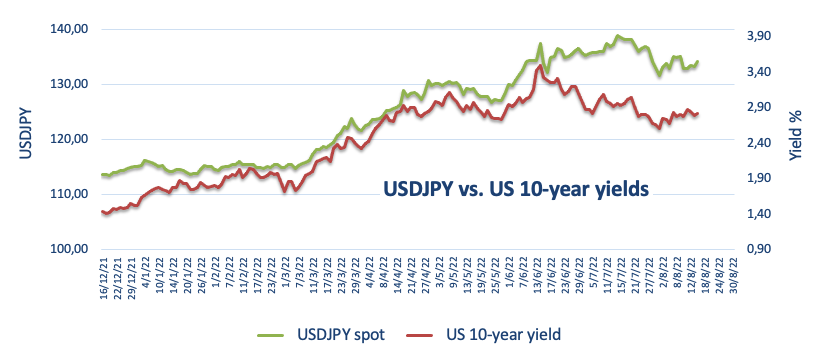
USD/JPY added to Tuesday’s gains and flirted with August tops well north of the 135.00 yardstick midweek.
In fact, the upbeat tone in the greenback and further gains in US yields across the curve bolstered the second consecutive session with gains in the pair, which has so far advanced four out of the last five days.
In Japan, the trade deficit widened to ¥1436.8B in July and Machinery Orders expanded 6.5% from a year earlier in June.
USD/JPY seems ready to confront the August high at 135.58 (August 8), which precedes the weekly peak at 137.46 (July 27) ahead of the post-BoJ top at 138.87 (July 21). The breakout of the latter could pave the way for a move to the 2022 high at 139.38 (July 13) just prior to the round level at 140.00. On the other hand, there is initial support at the weekly low at 131.73 (August 11) followed by the August low at 130.39 (August 2), which is deemed as the last defense for an assault of the psychological 130.00 mark. The loss of this level exposes a deeper decline to the May low at 126.36 (May 24) prior to the key 200-day SMA at 123.54. The daily RSI extends the upside to the vicinity of 52.
Resistance levels: 135.49 135.58 137.46 (4H chart)
Support levels: 133.90 132.55 131.73 (4H chart)
-637963587532232626.png)
GBPUSD
GBP/USD resumed the downtrend and returned to the sub-1.2100 region on the back of the resurgence of the buying pressure in the greenback on Wednesday.
Despite the US Dollar Index (DXY) trimming its daily gains after the publication of the FOMC Minutes, cable remained on the defensive and stuck below the 1.2100 mark.
Indeed, the British pound initially managed to climb as high as the 1.2140/45 band soon in the wake of higher-than-expected UK inflation figures for the month of July, although that bullish attempt ran out of steam and cable eventually succumbed to the upside pressure in the dollar.
Following the unexpected rise in UK inflation, markets now appear to have started to pencil in around 200 bps rate hikes by the BoE by May 2023.
Back to the UK docket, inflation figures tracked by the headline CPI rose 10.1% in the year to July and 0.6% vs. the previous month. The Core CPI – which excludes food and energy costs – also surprised to the upside and gained 6.2% YoY.
GBP/USD appears to have moved into a consolidative phase. The breach of the August low at 1.2002 (August 5) could open the door to a probable visit to the 2022 low at 1.1759 (July 14) ahead of the 2020 low at 1.1409 (March 20). In the opposite direction, the August high at 1.2293 (August 1) should offer initial resistance prior to the weekly peak at 1.2332 (June 27) and another weekly top at 1.2405 (June 16). The proximity of the 100-day SMA at 1.2391 also reinforces the latter. Beyond this region, a visit to the 1.2666 level (May 27 high) could return to the traders’ radar before the psychological 1.3000 mark. The daily RSI debilitates to the 47 region.
Resistance levels: 1.2142 1.2215 1.2276 (4H chart)
Support levels: 1.2002 1.1963 1.1889 (4H chart)
-637963587159578504.png)
AUDUSD
AUD/USD dropped for the third session in a row to multi-day lows in the 0.6910 region on Wednesday.
Once again, the solid performance of the US dollar impacted on the high-beta currencies and commodities, forcing the spot to intensify its decline and exacerbate the rejection from recent monthly tops past the 0.7100 hurdle.
Data wise Down Under, the Westpac Leading Index contracted 0.2% MoM in July and the Wage Price Index expanded 2.6% YoY in the April-June period and 0.7% vs. the previous quarter.
Further losses in AUD/USD carry the potential to revisit the August low at 0.6869 (August 5) ahead of the 2022 low at 0.6681 (July 14). The loss of the latter could prompt the May 2020 low at 0.6372 (May 4) to re-emerge on the horizon prior to the weekly low at 0.6253 (April 21 2020). On the flip side, the August peak at 0.7136 (August 11) appears as the immediate hurdle closely followed by the 200-day SMA at 0.7143. The break above this important region could allow for a move higher to the June high at 0.7282 (June 3) before the weekly top at 0.7458 (April 21). The daily RSI tumbles to the proximity of 48.
Resistance levels: 0.7040 0.7136 0.7194 (4H chart)
Support levels: 0.6910 0.6869 0.6802 (4H chart)
-637963587864180596.png)
GOLD
Gold prices tumbled further and retreated to new 2-week lows in the $1,760 region on Wednesday, printing at the same time the third consecutive daily retracement.
Bullion shed further ground in response to the resumption of the uptrend in the greenback, which encouraged the US Dollar Index (DXY) to trade closer to the 107.00 hurdle.
In addition, another positive performance of US yields across the curve also put the metal under heightened pressure and collaborated with the weekly leg lower.
Prices of the ounce troy of gold traded at shouting distance from the August low at $1,754 (August 3). If the yellow metal surpasses that level, then it could attempt a test of the weekly low at $1,711 (July 27) ahead of the 2022 low at $1,680 (July 21) and the 2021 low at $1,1676 (March 8), which stands just before the June 2020 low at $1,670 (June 5). The initial up barrier turns up at the August peak at $1,807 (August 10) seconded by the 100- and 200-day SMAs at $1,832 and $1,841, respectively. Beyond this zone, the June high at $1,879 (June 13) could resurface on the horizon prior to the April top at $1,998 (April 19).
Resistance levels: $1,782 $1,807 $1,814 (4H chart)
Support levels: $1,759 $1,711 $1,680 (4H chart)
-637963588160355958.png)
CRUDE WTI
Prices of the American reference for the sweet light crude oil reversed three sessions in a row closing with losses on Wednesday, briefly managing to climb just above the $89.00 mark per barrel just to give away some ground afterwards.
Indeed, prices of the WTI shrugged off part of the recent weakness and bounces off levels last traded back in late January after the EIA reported that US crude oil inventories shrank more than expected by 7.056M barrels in the week to August 12 and supplies at Cushing increased by 0.192M barrels.
Also collaborating with the upside in the commodity, signs of a stronger demand emerged in response to another noticeable drop in gasoline stockpiles, this time by 4,642M barrels according to the EIA’s report.
However, crude oil stayed prudent and closely followed any development from the Iran-West negotiations to revive the Tehran 2015 nuclear deal, which could pump in the markets around 1 mbpd of Iranian oil.
Prices of the WTI remain depressed and face the next support at the August low at $85.74 (August 16) ahead of the 81.94 level (low January 24). The breakdown of the latter exposes the round level at $80.00 before a move to the 2022 low at $74.30 (January 3). Conversely, any bullish attempt should meet the initial hurdle at the weekly top at $95.04 (August 11), which remains propped up by key 200-day SMA at $95.54. Up from here aligns the psychological $100.00 level before the weekly high at $101.87 (July 29) and another weekly top at $104.44 (July 19). In case the rebound gets more serious, then a probable visit to the July high at $111.42 (July 5) could return to the radar prior to the weekly peak at $114.00 (June 29) and the June top at $123.66 (June 14).
Resistance levels: $89.13 $90.63 $95.04 (4H chart)
Support levels: $85.72 $81.90 $77.82 (4H chart)
-637963588835044713.png)
DOW JONES
Equities measured by the three major US stock indices traded on the defensive and trimmed further the recent multi-session advance on the back of the resumption of the pessimism in the retail sector, particularly following disappointing prints from July’s Retail Sales.
In addition, daily gains in the dollar in combination with higher US yields also put stocks under pressure and sustained the daily leg lower.
Against that, the Dow Jones lost 0.25% to 34,072, the S&P500 retreated 0.39% to 4,288 and the tech benchmark Nasdaq Composite dropped 0.86% to 12,989.
The Dow Jones now need to surpass the August top at 34,281 (August 16) to allow for a probable visit to the April peak at 35,492 (April 21) ahead of the February high at 35,824 (February 9). The initial down barrier, in the meantime, emerges at the 200-day SMA at 33,880 seconded by the 100-day SMA at 32,640. The breach of this level should put the August low at 32,387 (August 2) back on the radar prior to the 55-day SMA at 31,923 and the weekly low at 31,534 (July 21). Down from here emerges the July low at 30,143 (July 14) before the 2022 low at 29,653 (June 17). The RSI remains in the overbought territory past 73.
Top Performers: Merck&Co, Chevron, Apple
Worst Performers: Boeing, Walgreen Boots, 3M
Resistance levels: 34,281 35,492 35,824 (4H chart)
Support levels: 32,633 32,387 31,705 (4H chart)
-637963589167560060.png)
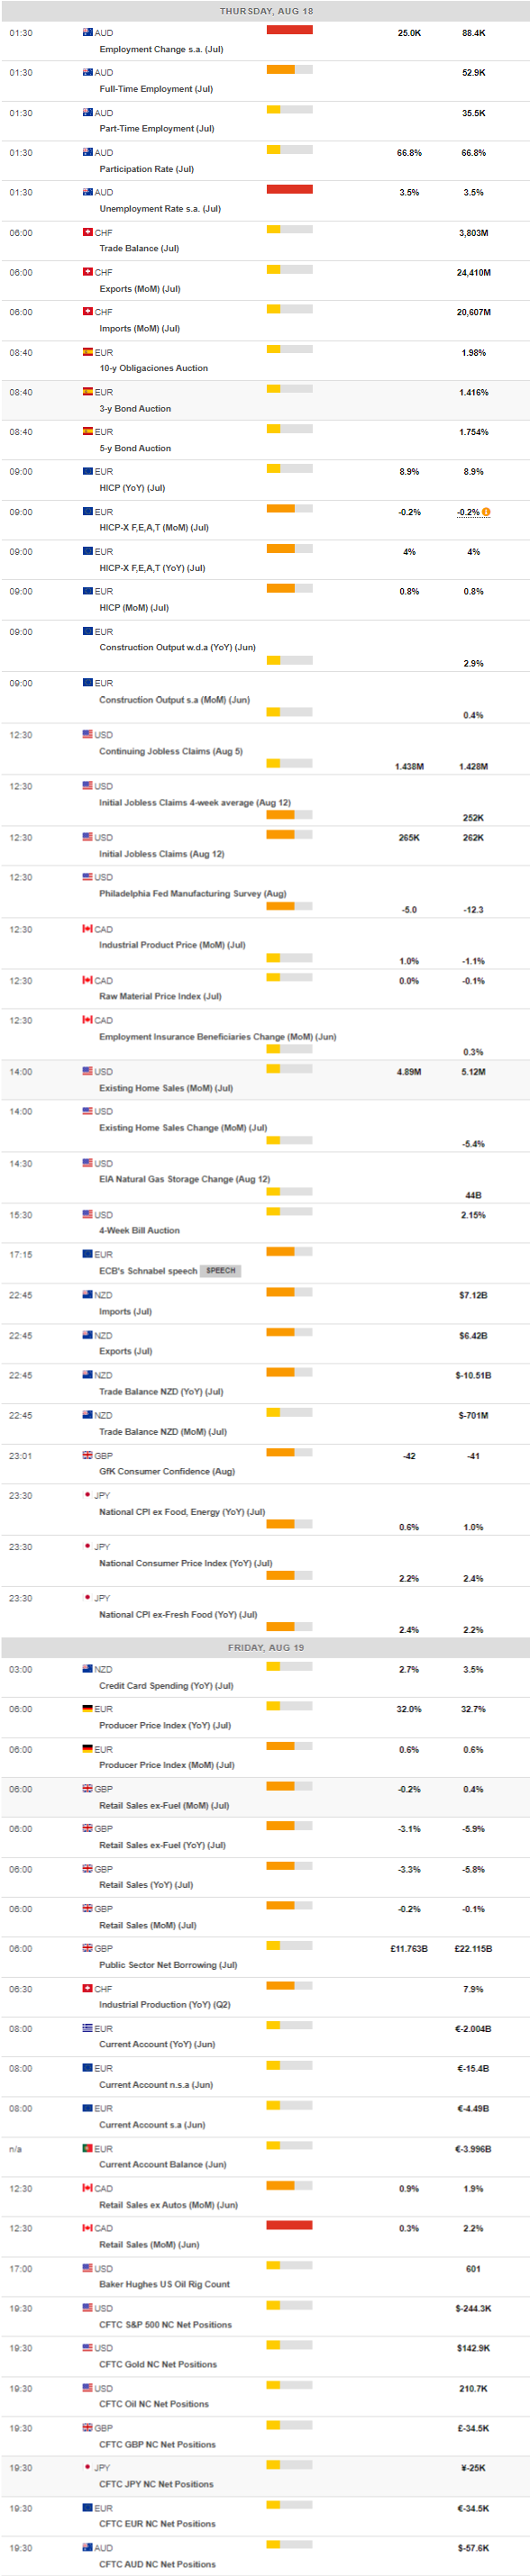
MACROECONOMIC EVENTS
All Information & Updates provided by:

All information relating to the financial markets available on this page has been prepared and issued by FXStreet (Forexstreet SL, Spain, Reg: B62498233) on the basis of publicly available information and all information believed to be reliable and does not conflict with Kuwaiti local laws, and all necessary care has been taken to before the company to ensure that the facts mentioned are correct from the source.
NCM Investment nor any of its directors or employees shall in any way be held responsible for the contents of this news, and the information contained on this page is intended only to provide clients with publicly available information and should not be construed as investment advice, report or analysis and/or constitute an offer or invitation to buy or sell financial instruments of any kind.
RISK WARNING: Forex and CFDs are highly risky leveraged products, as losses can exceed deposits. Please ensure you understand all the risks and take independent advice if necessary. NCM will segregate the clients based on the criteria of the regulator and its bylaws. NCM does not provide any advisory service; the material published does not constitute advice or a recommendation for a transaction in any financial instrument. NCM accepts no responsibility for any use of the content presented and any consequences of that use. Anyone acting on the information provided does so at their own risk.