
- Contact Us:
-

-

-

-


Daily Market Updates
19 Aug 2022
EURUSD
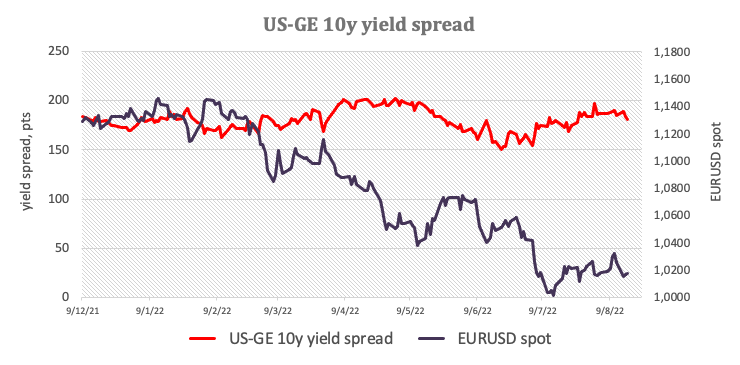
EUR/USD plummeted to new monthly lows and revisited the area last seen in mid-July around 1.0080 on Thursday, all in response to the abrupt move higher in the greenback.
Indeed, the US Dollar Index (DXY) finally left the 107.00 mark quite convincingly and advanced to multi-week highs despite the corrective downside in US yields across the curve. In the German cash markets, instead, the German 10y Bund yields extended the recent recovery to the 1.15% region, up for the third session in a row.
The acute bounce in the greenback followed comments from San Francisco Fed M.Daly, who deemed as appropriate either a 50 bps or a 75 bps rate hike at the next Fed meeting in September.
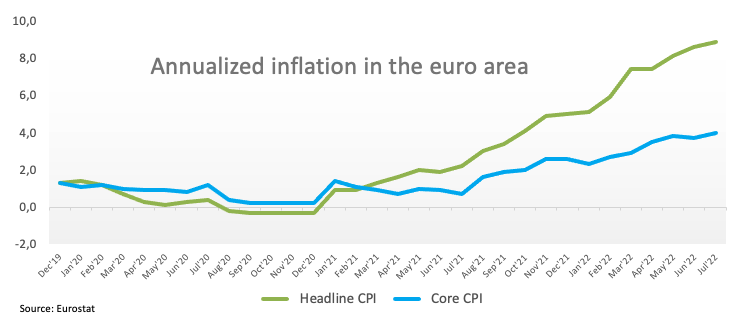
In the euro calendar final inflation figures in the Euroland saw the CPI rise 8.9% YoY in July and 0.1% from a month earlier. In addition, the Core CPI rose 4.0% YoY.
Following the release of final inflation figures, ECB’s Board member I.Schnabel said that inflation concerns have not alleviated, while her colleague M.Kazaks opened the door to extra rate hikes.
In the US, Initial Claims rose by 250K in the week to August 13 and the Philly Fed Manufacturing Index surprised to the upside at 6.2 for the month of August. In addition, the CB Leading Index contracted at a monthly 0.4% in July and Existing Home Sales dropped 5.9% MoM also in July, or 4.81M units.
In case bulls regain the upper hand in EUR/USD, there is a temporary hurdle at the 55-day SMA at 1.0320 prior to the August high at 1.0368 (August 10). The surpass of this level exposes a probable move to the interim 100-day SMA at 1.0485 ahead of the weekly peak at 1.0615 (June 27). Beyond the latter comes the June top at 1.0773 (June 9) seconded by the May high at 1.0786 (May 30). In the opposite direction, the weekly low at 1.0096 (July 27) offers decent contention before the parity level. If cleared, then the pair could drop to the 2022 low at 0.9952 (July 14) just ahead of the December 2002 low at 0.9859. The daily RSI tumbles to the sub-40 area.
Resistance levels: 1.0202 1.0268 1.0324 (4H chart)
Support levels: 1.0079 1.0006 0.9952 (4H chart)
-637964473594875298.png)
USDJPY
USD/JPY extended Wednesday’s advance and flirted with the 136.00 mark against the backdrop of the fierce bounce in the greenback and in spite of declining US yields across the curve.
Indeed, the dollar left behind the 107.00 yardstick and moved to 4-week highs when tracked by the US Dollar Index (DXY) pari passu with investors’ assessment of the recently published FOMC Minutes (Wednesday) as well as comments from FOMC’s Daly.
In the Japanese docket, Foreign Bond Investment rose ¥1152.4B in the week to August 13.
USD/JPY now targets the August top at 135.90 (August 18) ahead of the weekly high at 137.46 (July 27). The breakout of this level opens the door to the post-BoJ peak at 138.87 (July 21) before the 2022 top at 139.38 (July 13) and just ahead of the round level at 140.00. On the flip side, the weekly low at 131.73 (August 11) should hold the initial test reinforced by the 100-day SMA at 131.80. South from here emerges the August low at 130.39 (August 2) before the psychological 130.00 mark. Extra losses could see the May low at 126.36 (May 24) revisited ahead of the key 200-day SMA at 123.54. The daily RSI rebounds past the 55 level.
Resistance levels: 135.90 137.46 137.95 (4H chart)
Support levels: 134.64 133.90 132.55 (4H chart)
-637964474709724930.png)
GBPUSD
GBP/USD remained under pressure and navigated well into the negative territory, returning to an area last seen back in mid-July near 1.1920 on Thursday.
Cable’s price action largely mimicked that of the rest of the riskier assets, all against the backdrop of the violent move higher in the US dollar, which clinched new multi-week highs above 107.00 the figure when tracked by the US Dollar Index (DXY).
The British pound remained unable to grab any support from the current recovery in the UK 10y Gilt yields, which advanced to levels last seen back in late June around 2.35%.
There were no data releases in the UK calendar on Thursday.
GBP/USD broke below the side-lined theme and extended the drop well south of the 1.2000 mark and now exposes a probable visit to the 2022 low at 1.1759 (July 14) ahead of the 2020 low at 1.1409 (March 20). Inversely, there is an interim barrier at the 55-day SMA at 1.2134 followed by the August peak at 1.2293 (August 1) and the weekly top at 1.2332 (June 27). The surpass of the latter exposes the 100-day SMA at 1.2380 before another weekly high at 1.2405 (June 16). Above this area comes the 1.2666 level (May 27 peak) prior to the psychological 1.3000 mark. The daily RSI loses ground and revisits 38.
Resistance levels: 1.2079 1.2142 1.2215 (4H chart)
Support levels: 1.1922 1.1889 1.1759 (4H chart)
-637964474378450342.png)
AUDUSD
AUD/USD quickly faded the earlier climb to the 0.6970 region on Thursday.
Indeed, the Aussie dollar added to the ongoing leg lower and dragged AUD/USD back to the 0.6900 neighbourhood, where some initial support seems to have emerged.
The daily drop in the pair came amidst another firm uptick in the US Dollar Index (DXY) - which finally managed to break above the key barrier at the 107.00 yardstick - in tandem with a corrective downside in US yields and the poor session in the commodity space.
In Oz, the labour market report saw the Employment Change drop by 40.9K persons in July and the Unemployment Rate retreated to 3.4% in the same period.
In case AUD/USD breaches the weekly low at 0.6899, it could then extend the bearish bias to the August low at 0.6869 (August 5) prior to the 2022 low at 0.6681 (July 14). Down from here comes the May 2020 low at 0.6372 (May 4) seconded by the weekly low at 0.6253 (April 21 2020). On the other hand, the August high at 0.7136 (August 11) looks underpinned by the 200-day SMA at 0.7141. Once cleared, spot could challenge the June top at 0.7282 (June 3) ahead of the weekly peak at 0.7458 (April 21). The daily RSI loses ground and breaches 46.
Resistance levels: 0.6969 0.7040 0.7136 (4H chart)
Support levels: 0.6899 0.6869 0.6802 (4H chart)
-637964475054778645.png)
GOLD
Prices of the ounce troy of gold depreciated further and reached the fourth consecutive daily pullback on Thursday, this time approaching the $1,750 region and losing around $50 since Monday.
The sharp rebound in the greenback put the yellow metal under extra downside pressure at a time when declining US yield could not limit the decline in the precious metal either.
Back to the greenback, the US Dollar Index (DXY) saw its upside exacerbated after San Francisco Fed M.Daly advocated for a 50 bps or 75 bps at the September event, prompting the index to quickly surpass monthly highs and hit 4-week tops in the 107.50/55 band.
Further weakness in gold could now test the weekly low at $1,711 (July 27) prior to the round level at $1,700 and ahead of the 2022 low at $1,680 (July 21). Down from here emerges the 2021 low at $1,1676 (March 8) closely followed by the June 2020 low at $1,670 (June 5). On the other hand, the immediate hurdle of note appears at the August high at $1,807 (August 10) prior to the 100- and 200-day SMAs at $1,831 and $1,841, respectively. North from here comes the June top at $1,879 (June 13) ahead of the April high at $1,998 (April 19).
Resistance levels: $1,772 $1,782 $1,807 (4H chart)
Support levels: $1,751 $1,711 $1,680 (4H chart)
-637964475811129459.png)
CRUDE WTI
Crude oil prices traded in a positive fashion and lifted the barrel of the West Texas Intermediate (WTI) to fresh 3-day highs past the $91.00 mark on Thursday.
In fact, prices rose nearly 5% as traders continued to assess the marked drop in US crude oil inventories (-7.056M barrels) in the week to August 12, as per the EIA’s report on Wednesday. The sharp reduction of supplies came amidst a record of crude oil exports, while the equally strong drop in gasoline supplies also suggested that demand stays healthy.
Headwinds to further gains in crude oil prices remain from the Iran-West talks to revive the 2015 Tehran nuclear agreement, which could see around 1 mbpd of oil return to the market, alleviating at the same time the current tight supply conditions and therefore putting prices under downside pressure.
Later on Friday, driller Baker Hughes will report on the weekly US oil rig count in the week to August 19.
Further rebound in prices of the WTI continues to target the weekly high at $95.04 (August 11) just ahead of the key 200-day SMA at $95.57. If the WTI breaks above this level, it could allow a potential visit to the psychological $100.00 mark prior to the weekly peak at $101.87 (July 29) and another weekly top at $104.44 (July 19). Further upside could put the July high at $111.42 (July 5) back on the radar before the weekly top at $114.00 (June 29) and the June peak at $123.66 (June 14). On the contrary, the August low at $85.74 (August 16) is expected to offer initial contention prior to the 81.94 level (low January 24). The breach of this region could pave the way for a move to the round level at $80.00 ahead of the 2022 low at $74.30 (January 3).
Resistance levels: $91.28 $95.04 $95.76 (4H chart)
Support levels: $85.72 $81.90 $77.82 (4H chart)
-637964476479142554.png)
DOW JONES
US equities traded in a mixed fashion on Thursday, as the Dow Jones dropped 0.19% to 33,918, while the S&P500 and the tech-heavy Nasdaq Composite rose 0.13% to 4,279 and 0.21% to 12,954, respectively.
In fact, stocks kept the erratic performance on Thursday, as market participants continued to assess Wednesday’s FOMC Minutes amidst a stronger dollar and diminishing US yields across the curve.
The continuation of the rally in the Dow Jones faces the next hurdle at the August high at 34,281 (August 16). Once cleared, the index could attempt a visit to the April top at 35,492 (April 21) prior to the February peak at 35,824 (February 9). On the downside, sellers should meet the initial contention at the 200-day SMA at 33,87-0 followed by the 100-day SMA at 32,630. Further losses are expected to prompt the August low at 32,387 (August 2) to re-emerge on the horizon before the 55-day SMA at 31,938 and the weekly low at 31,534 (July 21). The loss of the latter could lead up to a test of the July low at 30,143 (July 14) prior to the 2022 low at 29,653 (June 17). The RSI eases from the overbought territory and drops below 70.
Top Performers: Cisco, Chevron, Intel
Worst Performers: Walgreen Boots, Verizon, JP Morgan
Resistance levels: 34,281 35,492 35,824 (4H chart)
Support levels: 32,623 32,387 31,705 (4H chart)
-637964476903488419.png)
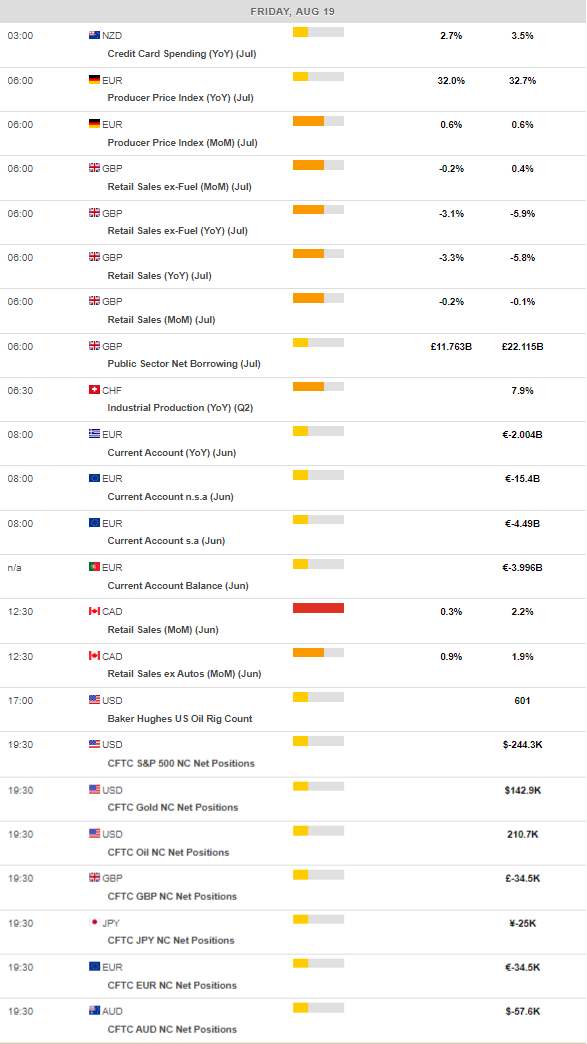
MACROECONOMIC EVENTS
All Information & Updates provided by:

All information relating to the financial markets available on this page has been prepared and issued by FXStreet (Forexstreet SL, Spain, Reg: B62498233) on the basis of publicly available information and all information believed to be reliable and does not conflict with Kuwaiti local laws, and all necessary care has been taken to before the company to ensure that the facts mentioned are correct from the source.
NCM Investment nor any of its directors or employees shall in any way be held responsible for the contents of this news, and the information contained on this page is intended only to provide clients with publicly available information and should not be construed as investment advice, report or analysis and/or constitute an offer or invitation to buy or sell financial instruments of any kind.
RISK WARNING: Forex and CFDs are highly risky leveraged products, as losses can exceed deposits. Please ensure you understand all the risks and take independent advice if necessary. NCM will segregate the clients based on the criteria of the regulator and its bylaws. NCM does not provide any advisory service; the material published does not constitute advice or a recommendation for a transaction in any financial instrument. NCM accepts no responsibility for any use of the content presented and any consequences of that use. Anyone acting on the information provided does so at their own risk.