
- Contact Us:
-

-

-

-


Daily Market Updates
22 Aug 2022
EURUSD
EUR/USD prolonged the bearish move and reached fresh lows near 1.0030 at the end of the week, revisiting an area last traded back in mid-July.
The persistent move higher in the greenback encouraged the US Dollar Index (DXY) to flirt with multi-week peaks past the 108.00 mark on the back of the recent change of heart among investors, hawkish messages from Fed’s rate setters and higher US yields across the curve.
The abrupt upside in the dollar allowed the index to reverse the previous week’s pullback and regain the upper hand in a context dominated by hawkish Fedspeak amidst the broader debate involving the quantity of the next rate hike at the September event and how likely the Fed’s normalization process could impact on the real economy.
A few minor releases in the euro docker saw German Producer Prices rise more than estimated in July at 5.3% inter-month and 37.2% from a year earlier. In the euro area, the Current Account left behind the previous deficit and posted a €3.24B surplus in June.
Nothing scheduled data wise across the pond other than the speech by Richmond Fed T.Barkin (2024 voter, centrist).
EUR/USD extended the correction from August tops near 1.0370 and now faces immediate contention at the August low at 1.0031 (August 19) just ahead of the parity level. Below the latter comes the 2022 low at 0.9952 (July 14) prior to the December 2002 low at 0.9859. On the flip side, there is interim resistance at the 55-day SMA at 1.0308 before the August top at 1.0368 (August 10). Once cleared, the pair could dispute the interim 100-day SMA at 1.0475 prior to the weekly high at 1.0615 (June 27). Further north aligns the June peak at 1.0773 (June 9) seconded by the May top at 1.0786 (May 30). The daily RSI loses further ground and breaches 37.
Resistance levels: 1.0177 1.0202 1.0268 (4H chart)
Support levels: 1.0031 1.0006 0.9952 (4H chart)
-637966481949340340.png)
USDJPY
USD/JPY climbed to fresh tops north of the 137.00 hurdle on Friday in what was the fourth daily advance in a row in the pair.
Friday’s continuation of the upside bias in spot was once again underpinned by the strong momentum in the dollar as well as the equally intense rebound in yields across the Atlantic, where the belly and the long end reclaimed levels last seen several weeks ago.
Interesting session in the Japanese docket, where the Inflation Rate climbed 2.6% YoY in July 2.4% when it comes to the Core Inflation Rate. Further results saw the Inflation Rate Ex-Food and Energy rise 1.2% vs. July 2021.
USD/JPY clinched a new August high at 137.22 (August 19). Beyond this level the pair could revisit the weekly peak at 137.46 (July 27) prior to the post-BoJ peak at 138.87 (July 21). The breakout of this level could motivate a test of the 2022 top at 139.38 (July 13) to start shaping up before the round level at 140.00. Inversely, there is an interim support at the 100-day SMA at 131.95 prior to the weekly low at 131.73 (August 11). The loss of this level should open the door to the August low at 130.39 (August 2), which precedes the psychological 130.00 yardstick. Down from here, the May low at 126.36 (May 24) could be retested before the key 200-day SMA at 123.77. The daily RSI extends the bounce to the vicinity of the 60 level.
Resistance levels: 137.22 137.46 137.95 (4H chart)
Support levels: 135.53 134.64 133.90 (4H chart)
-637966482658446765.png)
GBPUSD
There was no respite for the decline in the British pound, and the riskier assets in general, on Friday.
Indeed, GBP/USD extended the march south and decisively broke below the 1.1800 mark to print fresh 5-week lows in the 1.1790 region at the end of the week.
Another show of strength in the greenback propelled the US Dollar Index (DXY) to multi-week highs past the 108.00 mark, helped at the same time by extra improvement in US yields and hawkish Fedspeak.
Speaking about yields, another uptick in the UK 10y Gilts yields saw the 2.45% area revisited for the first time since late June.
Poor results from the UK calendar also added to the prevailing weakness around the quid after Consumer Confidence tracked by Gfk worsened to -44 for the current month and headline Retail Sales contracted 3.4% in the year to July and 3.0% when excluding Fuel. In addition, Public Sector Net Borrowing shrink to £4.1B in July.
The breach of the 1.1800 mark has opened the door to a deeper pullback in GBP/USD. Against that, the next support of note emerges at the 2022 low at 1.1759 (July 14) prior to the 2020 low at 1.1409 (March 20). On the upside, the 55-day SMA at 1.2122 is expected to offer temporary resistance seconded by the August high at 1.2293 (August 1). The surpass of the latter could pave the way for a visit to the weekly peak at 1.2332 (June 27) ahead of the 100-day SMA at 1.2366 and another weekly top at 1.2405 (June 16). Extra gains should put a test of the 1.2666 level (May 27 peak) back on the radar ahead of the psychological 1.3000 level. The daily RSI plummets to the 33 region.
Resistance levels: 1.2037 1.2079 1.2142 (4H chart)
Support levels: 1.1791 1.1759 1.1638 (4H chart)
-637966482315443488.png)
AUDUSD
AUD/USD completed a full week trading in the negative territory and ended Friday’s session south of the 0.6900 support, recording at the same time new lows for the month of August.
Further upside pressure in the greenback weighed once again on the risk complex and forced the Aussie dollar to fully fade the monthly rally to the 0.7135/40 band recorded during the first half of the month.
The commodity space, in the meantime, traded in a mixed fashion, with the price of copper and the iron ore printing marginal gains.
There were no data releases in Australia on Friday, leaving all the attention to Tuesday’s publication of flash PMIs for the month of August.
AUD/USD clinched a new August low at 0.6859 (August 5). If the latter is cleared, then the focus of attention is expected to gyrate to the 2022 low at 0.6681 (July 14) ahead of the May 2020 low at 0.6372 (May 4) and the weekly low at 0.6253 (April 21 2020). On the contrary, the 100-day SMA should offer an initial barrier at 0.7054 ahead of the August peak at 0.7136 (August 11), which is closely followed by the 200-day SMA at 0.7139. Beyond the latter appears the June high at 0.7282 (June 3) before the weekly top at 0.7458 (April 21). The daily RSI prolongs the downside to the 42 area.
Resistance levels: 0.6915 0.6969 0.7040 (4H chart)
Support levels: 0.6859 0.6802 0.6681 (4H chart)
-637966482973938819.png)
GOLD
Gold prices dropped to 3-week lows in the sub-$1,750 zone per ounce troy at the end of the week, losing ground uninterruptedly since Monday. Bullion thus gave away all the gains recorded in the first half of the month, coming under renewed downside pressure after briefly surpassing the critical resistance zone around $1,800 on August 12 and 15.
The vigorous rebound in the US dollar remained supported by hawkish Fedspeak and kept the yellow metal depressed throughout the week, while the firmer tone in US yields also collaborated with the daily retracement on Friday.
A deeper decline in gold prices carries the potential to confront the weekly low at $1,711 (July 27) just followed by the round level at $1,700. If bullion breaks below the latter, it could extend the retracement to the 2022 low at $1,680 (July 21) prior to the 2021 low at $1,1676 (March 8) and the June 2020 low at $1,670 (June 5). Contrarily, occasional bullish attempts could test the 55-day SMA at $1,781 ahead of the August peak at $1,807 (August 10). The surpass of this zone should put the 100- and 200-day SMAs at $1,829 and $1,840 back on the radar ahead of the June high at $1,879 (June 13) and the April top at $1,998 (April 19).
Resistance levels: $1,758 $1,772 $1,782 (4H chart)
Support levels: $1,745 $1,711 $1,680 (4H chart)
-637966483291995846.png)
CRUDE WTI
Prices of the American reference for the sweet light crude oil ended the week with shy losses below the key $90.00 mark per barrel following two consecutive daily advances.
In fact, traders gave away part of the previous gains following renewed concerns over demand destruction – despite the strong drop in weekly US crude oil inventories - while the progress of the Iran-West negotiations to revive the 2015 Tehran nuclear deal also added to the downbeat mood around the commodity.
In addition, the unabated rally in the US dollar put the commodity universe under further downside pressure, helped at the same time by prospects of further Fed tightening and market chatter regarding a potential US recession.
In the docket, driller Baker Hughes said the US oil rig count remained unchanged at 601 US total active oil rigs in the week to August 19.
Extra upside in the WTI remains capped by the weekly top at $95.04 (August 11), which appears also propped up by the key 200-day SMA at $95.61. The breakout of this region could spark extra gains to the psychological $100.00 mark ahead of the weekly high at $101.87 (July 29) and another weekly peak at $104.44 (July 19). North from here comes the July high at $111.42 (July 5) prior to the weekly top at $114.00 (June 29) and the June peak at $123.66 (June 14). Bears, in the meantime, should look to revisit the August low at $85.74 (August 16) ahead of the 81.94 level (low January 24). A deeper drop could see the round level at $80.00 revisited before the 2022 low at $74.30 (January 3).
Resistance levels: $92.08 $95.04 $95.76 (4H chart)
Support levels: $88.34 $85.72 $81.90 (4H chart)
-637966483914300008.png)
DOW JONES
Equities tracked by the three major US stock indices ended the week on the back foot, although they managed well to maintain the positive ground on a monthly basis.
US stocks suffered once again the hawkish bias from Fed speakers throughout the week, who highlighted the need to keep tightening the monetary policy while at the same time warned against the probability that a more restrictive stance could trigger a slowdown in the economy.
According to CME Group’s FedWatch Tool, the probability of a 50 bps rate hike in September is now at nearly 60% vs. around 41% when it comes to a 75 bps raise.
The stronger dollar coupled with higher US yields across the curve also weighed on the sentiment on Friday.
Bulls continue to target the August top at 34,281 (August 16). If the Dow surpasses this level, then it could open the door to a potential visit to the April peak at 35,492 (April 21) ahead of the February high at 35,824 (February 9). In the opposite direction, the 100-day SMA at 32,618 is expected to offer interim and initial support prior to the August low at 32,387 (August 2) and the 55-day SMA at 31,955. The breach of the latter should prompt the weekly low at 31,534 (July 21) to emerge on the horizon seconded by the July low at 30,143 (July 14) and the 2022 low at 29,653 (June 17). The RSI drops further and approaches 64.
Top Performers: J&J, Merck&Co, UnitedHealth
Worst Performers: Boeing, JP Morgan, Nike
Resistance levels: 34,281 35,492 35,824 (4H chart)
Support levels: 33,627 32,613 32,387 (4H chart)
-637966484247034077.png)
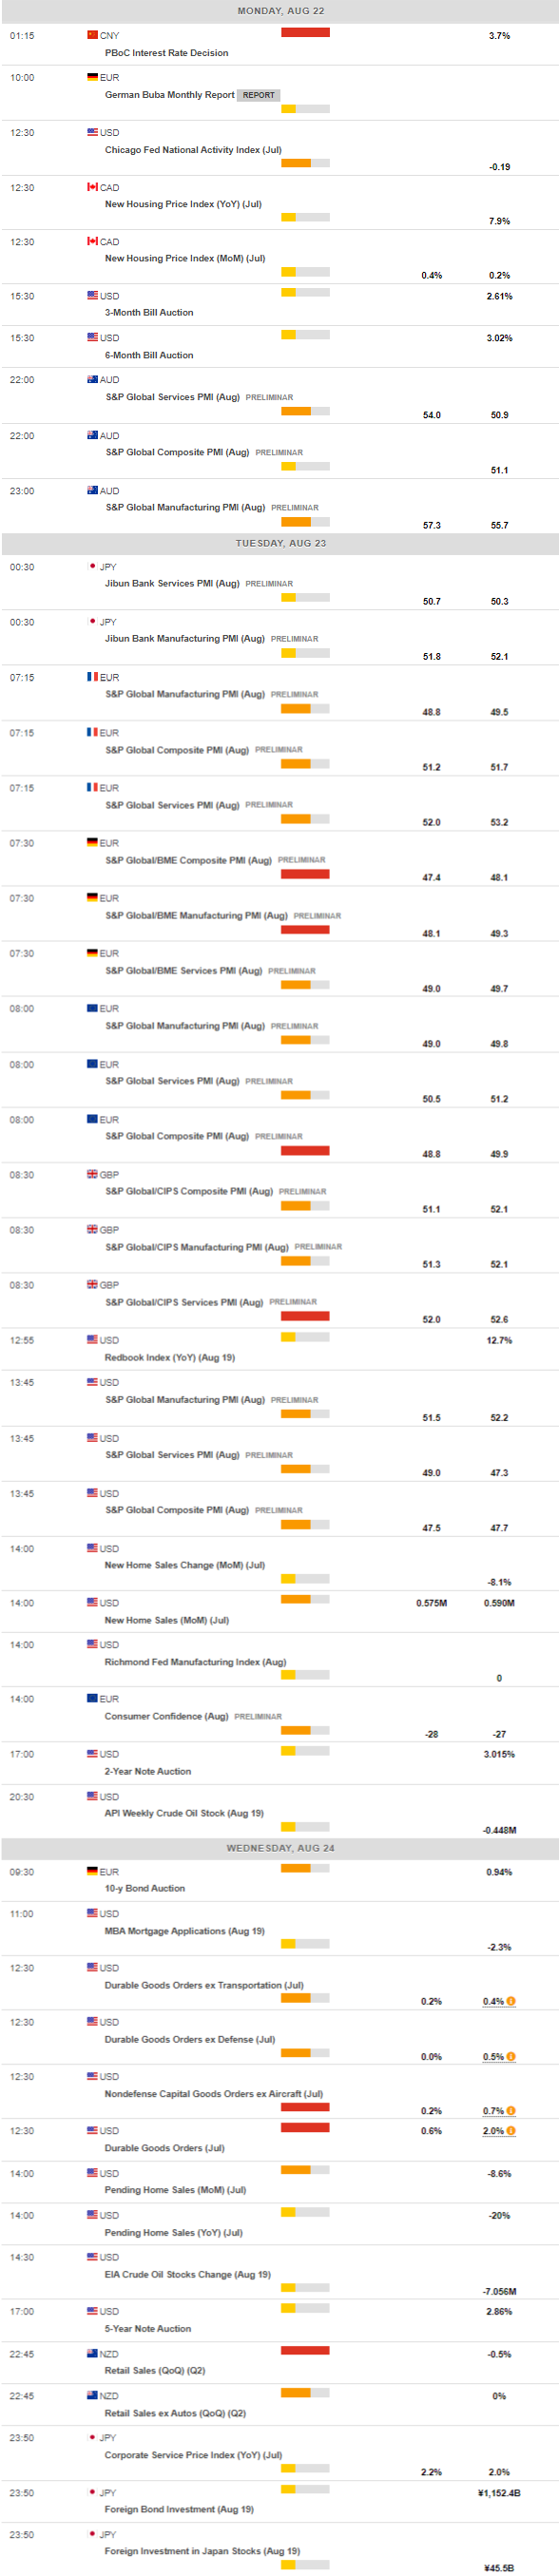
MACROECONOMIC EVENTS
All Information & Updates provided by:

All information relating to the financial markets available on this page has been prepared and issued by FXStreet (Forexstreet SL, Spain, Reg: B62498233) on the basis of publicly available information and all information believed to be reliable and does not conflict with Kuwaiti local laws, and all necessary care has been taken to before the company to ensure that the facts mentioned are correct from the source.
NCM Investment nor any of its directors or employees shall in any way be held responsible for the contents of this news, and the information contained on this page is intended only to provide clients with publicly available information and should not be construed as investment advice, report or analysis and/or constitute an offer or invitation to buy or sell financial instruments of any kind.
RISK WARNING: Forex and CFDs are highly risky leveraged products, as losses can exceed deposits. Please ensure you understand all the risks and take independent advice if necessary. NCM will segregate the clients based on the criteria of the regulator and its bylaws. NCM does not provide any advisory service; the material published does not constitute advice or a recommendation for a transaction in any financial instrument. NCM accepts no responsibility for any use of the content presented and any consequences of that use. Anyone acting on the information provided does so at their own risk.