
- Contact Us:
-

-

-

-


Daily Market Updates
23 Aug 2022
EURUSD
EUR/USD came under renewed downside pressure and recorded new cycle lows in the 0.9930/25 band, extending the breach of the psychological parity level at the beginning of the week and returning to an area last seen in December 2002.
As usual, extra selling in the European currency – and the rest of its risky peers – came alongside investors’ adjustment of the Fed’s probable next move when it comes to rate hikes, all in a week dominated by the release of US inflation figures tracked by the PCE and the Jackson Hole Symposium in the second half of the week.
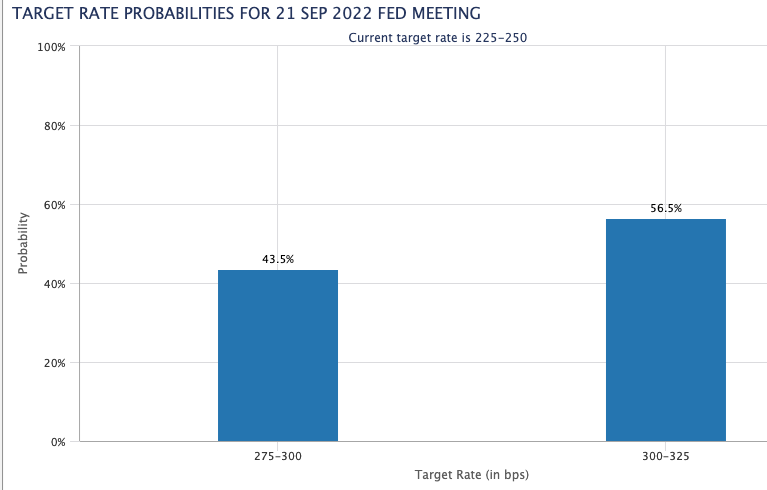
On the latter, CME Group’s FedWatch Tool now sees the probability of a 75 bps rate raise at around 55% vs. 45% when it comes to a 50 bps hike at the September event.
The strong performance in the greenback was also bolstered by another uptick in US yields across the curve, which saw the 10y note returning to the area above the 3.0%.
Also weighing on the single currency appeared disheartening comments from the Bundesbank, suggesting the increasing likelihood that the German economy could enter recession and that inflation could peak above 10%.
Nothing to write home about regarding data releases, as the Chicago Fed National Activity Index was the sole release on both sides of the ocean, improving to 0.27 (from -0.25) for the month of July.
If EUR/USD now breaks below the 2022 low at 0.9927 (July 14) it could expose the December 2002 low at 0.9859. Inversely, there is a minor hurdle at 1.0202 (August 17 high) followed by the temporary 55-day SMA at 1.0295 and the August peak at 1.0368 (August 10). Beyond the latter aligns the 100-day SMA at 1.0465 before the weekly high at 1.0615 (June 27). The daily RSI grinds lower and trades close to the 32 zone.
Resistance levels: 1.0046 1.0095 1.0170 (4H chart)
Support levels: 0.9927 0.9859 0.9685 (4H chart)
-637967883695284118.png)
USDJPY
USD/JPY prolonged the upbeat momentum for yet another session and clinched new 5-week peaks in the 137.60/65 band on Monday. The pair therefore recorded the fifth consecutive session with gains and entered the second straight week into the positive territory.
Further buying pressure in the greenback combined with the continuation of the recovery in US yields across the curve and lifted spot well north of the 137.00 barrier and allaying the way for a probable revisit to the round level at 138.00 sooner rather than later.
-637967887215480604.png)
The Japanese docket was empty on Monday, leaving all the attention to Tuesday’s release of usual preliminary figures for the PMIs for the current month.
Another day, another top for USD/JPY. Extra strength in the pair now targets the round level at 138.00 ahead the post-BoJ high at 138.87 (July 21). Further north emerges the 2022 peak at 139.38 (July 13) prior to the round level at 140.00. On the downside, the 55-day SMA at 135.35 should offer temporary contention ahead of the 100-day SMA at 132.097. Below this level, a test of the weekly low at 131.73 (August 11) could start shaping up before the August low at 130.39 (August 2), which is closely followed by the psychological 130.00 mark. A deeper pullback could see the May low at 126.36 (May 24) revisited ahead of the key 200-day SMA at 123.88. The daily RSI regains extra ground and trades closer to 62.
Resistance levels: 137.64 137.97 138.87 (4H chart)
Support levels: 136.69 135.58 134.64 (4H chart)
-637967885899648621.png)
GBPUSD
In line with the rest of the risk-associated universe, the sentiment around the British pound soured further at the beginning of the week and this forced GBP/USD to extend the leg lower well below 1.1800 the figure to new YTD lows near 1.1740.
Indeed, the sterling depreciated further on the back of the relentless move higher in the greenback, which surpassed the 109.00 mark to record new multi-week tops when gauged by the US Dollar Index (DXY).
The sharp decline in cable came in tandem with fresh 2-month highs in the UK 10y Gilt yields, which re-tested the 2.52% area on Monday.
The UK docket was empty ahead of the release of the advanced Manufacturing and Services PMIs for the month of August due on Tuesday.
GBP/USD now faces immediate contention at the 2022 low at 1.1741 (July 14) ahead of the 2020 low at 1.1409 (March 20). On the flip side, the initial up barrier comes at the 55-day SMA at 1.2108 prior to the August peak at 1.2293 (August 1) and the weekly top at 1.2332 (June 27). The surpass of this level could open the door to the 100-day SMA at 1.2352 before another weekly high at 1.2405 (June 16). North from here appears the 1.2666 level (May 27 peak) before the psychological 1.3000 yardstick. The daily RSI approaches the oversold territory around 32.
Resistance levels: 1.1836 1.1925 1.2033 (4H chart)
Support levels: 1.1741 1.1638 1.1445 (4H chart)
-637967885635697460.png)
AUDUSD
AUD/USD attempted a bull run to the 0.6930 region soon after the PBoC cut its 5y and 1y LPR earlier in the session, an area coincident with the 55-day SMA. The bullish attempt, however, did not stick and motivated the pair to eventually succumb to the persevering bid bias in the greenback.
Also collaborating with the downside in spot came a negative performance in the commodity space, where prices of both copper and iron ore remained on the defensive.
The commodity space, in the meantime, traded in a mixed fashion, with the price of copper and the iron ore printing marginal gains.
Next on tap in the Australian calendar will be the flash PMIs for the month of August due on Tuesday.
In case AUD/USD breaks below the August low at 0.6859 (August 19), the next support of note is then expected to turn up at the 2022 low at 0.6681 (July 14) prior to the May 2020 low at 0.6372 (May 4) and the weekly low at 0.6253 (April 21 2020). Contrarily, the 100-day SMA at 0.7047 still emerges as the initial hurdle followed by the August high at 0.7136 (August 11), which appears propped up by the 200-day SMA. The breakout of this level should open the door to a move to the June top at 0.7282 (June 3) ahead of the weekly peak at 0.7458 (April 21). The daily RSI extends the drop to the vicinity of 42.
Resistance levels: 0.6928 0.6969 0.7040 (4H chart)
Support levels: 0.6859 0.6802 0.6681 (4H chart)
-637967886330642379.png)
GOLD
Prices of the precious metal retreated further and printed new 4-week lows near $1,730 per ounce troy at the beginning of the week.
In fact, extra gains in the greenback sustained further another multi-week top in the US Dollar Index (DXY), this time reclaiming the 109.00 barrier amidst the further adjustment by investors to the Fed tightening plans.
Also putting bullion under extra pressure, US yields extended the rebound along with the rest of the global debt markets.
The break of the August low at $1,727 (August 22) could spark a deeper retracement to the weekly low at $1,711 (July 27) ahead of the round level at $1,700. Further south appears the 2022 low at $1,680 (July 21) ahead of the 2021 low at $1,1676 (March 8) and the June 2020 low at $1,670 (June 5). On the other hand, the initial up barrier comes at the 55-day SMA at $1,779 prior to the August high at $1,807 (August 10). Once cleared, bullion could challenge the 100- and 200-day SMAs at $1,827 and $1,839, respectively, before the June peak at $1,879 (June 13) and the April top at $1,998 (April 19).
Resistance levels: $1,749 $1,758 $1,772 (4H chart)
Support levels: $1,727 $1,711 $1,680 (4H chart)
-637967886836217867.png)
CRUDE WTI
WTI prices kept the recent side-lined trading unchanged on Monday, with the upper end clearly limited by the $92.00 region per barrel.
In fact, crude oil prices alternated gains with losses, as traders continued to adjust to the prospects for further tightening by the Federal Reserve and the perspective of a potential economic slowdown and the impact on the demand for the commodity.
In addition, jitters surrounding weaker fundamentals in China also weighed on the investors’ sentiment, as well as a probable positive outcome from the Iran-West talks to revive the 2015 nuclear deal. Surrounding this latter idea and in light of the sharp correction in prices in the last weeks, Saudi Arabia threatened to cut its oil output, although traders remained skeptical to these announcements so far.
As usual, the API and the EIA will report on the US crude oil supplies for the week ended on August 19.
Prices of the WTI still face the next hurdle at the weekly high at $95.04 (August 11), an area reinforced by the key 200-day SMA at $95.65. The surpass of the latter exposes a move to the psychological $100.00 level prior to the weekly peak at $101.87 (July 29) and another weekly top at $104.44 (July 19). Further up aligns the July high at $111.42 (July 5) ahead of the weekly peak at $114.00 (June 29) and the June top at $123.66 (June 14). The next down barrier now emerges at the August low at $85.74 (August 16) followed by the 81.94 level (low January 24). The breach of this zone could lead up to a visit to the round level at $80.00 prior to the 2022 low at $74.30 (January 3).
Resistance levels: $91.03 $92.08 $95.04 (4H chart)
Support levels: $86.26 $85.72 $81.90 (4H chart)
-637967887863296923.png)
DOW JONES
Equities started the week on the back foot and added to Friday’s pullback, dragging all three major US indices to fresh multi-day lows.
In fact, concerns surrounding an aggressive rate path by the Federal Reserve weighed on investors’ mood and kept buyers at bay at the beginning of the week in a cautious context ahead of the Jackson Hole Symposium at the end of the week and the key speech by Chief Powell on Friday.
Indeed, speculation of a large rate hike at the FOMC’s September event has resurfaced as of late in the wake of the hawkish plethora from several Fed’s policy makers in past sessions. On this, market participants now seem to favour a 75 bps rate raise next month.
Another solid session in the greenback and US yields also hurt stocks at the beginning of the week.
A deeper pullback in the Dow Jones could revisit the 100-day SMA at 32,597 ahead of the August low at 32,387 (August 2) and the 55-day SMA at 31,954. The loss of this level could put a test of the weekly low at 31,534 (July 21) back on the radar prior to the July low at 30,143 (July 14) and the 2022 low at 29,653 (June 17). In case bulls regain the upper hand, the immediate significant resistance emerges at the 200-day SMA at 33,843 seconded by the August high at 34,281 (August 16). Beyond this zone, the index could open the door to a visit to the April top at 35,492 (April 21) before the February peak at 35,824 (February 9). The RSI drops markedly to the 54 area.
Top Performers: J&J, Procter&Gamble, Verizono
Worst Performers: Intel, Salesforce.com, Walt Disney
Resistance levels: 34,281 35,492 35,824 (4H chart)
Support levels: 33,066 32,604 32,387 (4H chart)
-637967888188688951.png)
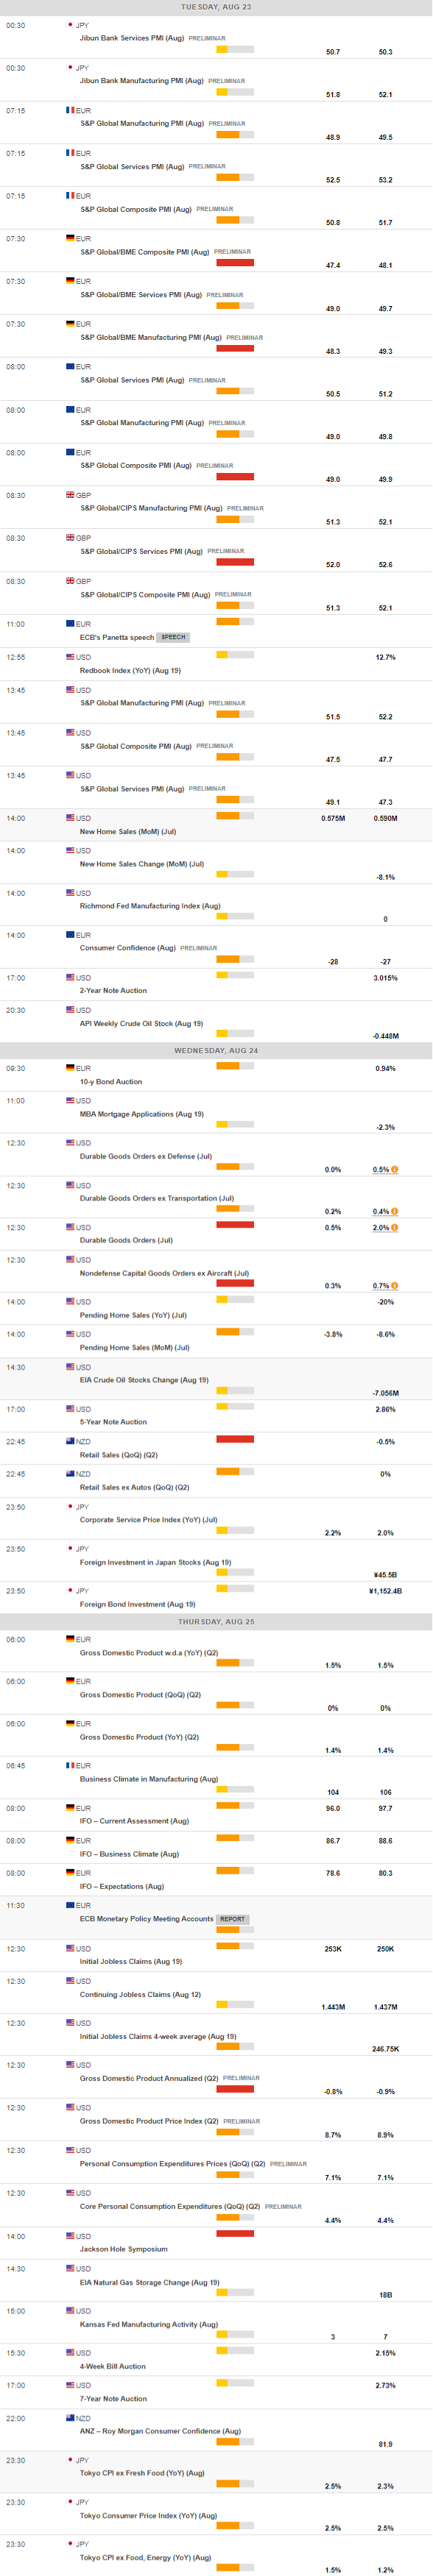
MACROECONOMIC EVENTS
All Information & Updates provided by:

All information relating to the financial markets available on this page has been prepared and issued by FXStreet (Forexstreet SL, Spain, Reg: B62498233) on the basis of publicly available information and all information believed to be reliable and does not conflict with Kuwaiti local laws, and all necessary care has been taken to before the company to ensure that the facts mentioned are correct from the source.
NCM Investment nor any of its directors or employees shall in any way be held responsible for the contents of this news, and the information contained on this page is intended only to provide clients with publicly available information and should not be construed as investment advice, report or analysis and/or constitute an offer or invitation to buy or sell financial instruments of any kind.
RISK WARNING: Forex and CFDs are highly risky leveraged products, as losses can exceed deposits. Please ensure you understand all the risks and take independent advice if necessary. NCM will segregate the clients based on the criteria of the regulator and its bylaws. NCM does not provide any advisory service; the material published does not constitute advice or a recommendation for a transaction in any financial instrument. NCM accepts no responsibility for any use of the content presented and any consequences of that use. Anyone acting on the information provided does so at their own risk.