
- Contact Us:
-

-

-

-


Daily Market Updates
24 Aug 2022
EURUSD
Another day, another low in EUR/USD. Indeed, this time the pair tumbled to fresh lows in an area last visited in December 2002 just below the 0.9900 level on turnaround Tuesday. The downtick, however, was reversed later in the session, as the greenback gave away the daily gains following poor results from advanced PMIs and housing data.
Initially on Tuesday, further strength in the greenback encouraged the US Dollar Index (DXY) to flirt with cycle peaks just below the 109.30 region, always on the back of firm expectations of further Fed’s tightening, while higher US yields also underpinned the move higher in the index.
Mixed results from flash PMIs in the core euro area sponsored an ephemeral bounce off lows in spot, a move that was later reinforced by weaker-than-estimated US readings.
On another front, ECB’s Board member F.Panetta was on the wires suggesting that the likelihood of a recession in the region remains on the rise while he also noted that the central bank may need to adjust the stance of the monetary policy further.
In the euro calendar, the advanced Manufacturing PMI in Germany came at 49.8 for the month of August, while it receded to 49.0 in France and 49.7 in the broader Euroland. Regarding the Services sector, flash results came at 48.2, 51.0 and 50.2, respectively. Additionally, preliminary figures from the European Commission expect the Consumer Confidence in the euro area to improve to -24.9 in the current month.
-637968770428105850.png)
Across the Atlantic, flash Manufacturing PMI is seen at 51.3 and 44.1 when it comes to the Services gauge. Further results saw New Home Sales contract 12.6% MoM in July, or 0.511M units.
EUR/USD now faces the next support at the 2022 low at 0.9899 (August 23) ahead of the December 2002 low at 0.9859. Further south emerges the October 2002 low at 0.9685 (October 21) prior to the September 2002 low at 0.9608 (September 17). Contrarily, there is a minor up barrier at 1.0202 (August 17 high) seconded by the interim 55-day SMA at 1.0281 and the August top at 1.0368 (August 10). The surpass of this level should open the door to the 100-day SMA at 1.0456 ahead of the weekly peak at 1.0615 (June 27). The daily RSI rebounds to the 35 area.
Resistance levels: 1.0017 1.0046 1.0095 (4H chart)
Support levels: 0.9899 0.9859 0.9685 (4H chart)
-637968762492999954.png)
USDJPY
USD/JPY faded the initial move to fresh 4-week tops around 137.70 in response to the abrupt U-turn in the greenback and a mild loss of momentum in US yields across the curve on Tuesday.
Indeed, the greenback traded just pips below the 2022 high near 109.30 earlier in the session, as expectations for further tightening by the Federal Reserve appeared all but abated for yet another session. Those gains in the buck, however, were quickly eroded after disappointing results from flash PMIs and the housing sector.
In the meantime, US yields in the belly of the curve moved within a tight range, although they managed well to keep the trade above the key 3.0% mark.
In Japan, flash figures saw the Jibun Bank Manufacturing PMI at 51 in August (from 52.1) and the Jibun Bank Services PMI at 49.2 (from 50.3).
Immediately to the upside in USD/JPY comes the August high at 137.70 (August 23) ahead of the round level at 138.00. A move higher could open the door to the post-BoJ top at 138.87 (July 21) seconded by the 2022 peak at 139.38 (July 13) and the round level at 140.00. On the contrary, there is initial support at the 55-day SMA at 135.45 before the 100-day SMA at 132.23. Down from here emerges a probable visit to the weekly low at 131.73 (August 11) prior to the August low at 130.39 (August 2), which precedes the psychological 130.00 yardstick. South from here, a move to the May low at 126.36 (May 24) could return to the radar before the key 200-day SMA at 124.00. The daily RSI loses some traction and retreats to the sub-58 zone.
Resistance levels: 137.70 137.97 138.87 (4H chart)
Support levels: 136.69 135.58 134.64 (4H chart)
-637968764602814214.png)
GBPUSD
GBP/USD managed to gather fresh upside traction not before hitting new 2022 lows in the 1.1720/15 band on Tuesday, levels last seen back in March 2020, the onset of the coronavirus pandemic.
Indeed, cable back-pedaled the initial decline and ended the session with decent gains after reclaiming the area above 1.1800 the figure on Tuesday, leaving at the same time four consecutive sessions with losses.
Further upside pressure in the greenback as well as firmer US yields kept the US Dollar Index (DXY) well bid earlier in the session and motivated it to climb to levels just short of the 2022 peak near 109.30 recorded on July 14.
The positive price action around the British pound came in tandem with another uptick in the UK 10y Gilt yields, this time advancing past the 2.60% region to fresh multi-week tops.
In the UK, preliminary figures expect the Manufacturing PMI to retreat to 46.0 in August (from 52.1) and the Services PMI to ease a tad to 52.5 (from 52.6). In addition, the CBI Industrial Trend Orders worsened to -7 in August (from 8).
Further downside in GBP/USD needs to clear the 2022 low at 1.1716 (August 23) to allow for a probable drop to the 2020 low at 1.1409 (March 20). Occasional bullish attempts, in the meantime, are expected to meet interim hurdle at the 55-day SMA at 1.2093 ahead of the August high at 1.2293 (August 1) seconded by the weekly top at 1.2332 (June 27). Beyond the latter, cable could advance to the 100-day SMA at 1.2339 prior to another weekly peak at 1.2405 (June 16). The breakout of this region could put the 1.2666 level (May 27 peak) back on the radar before the psychological 1.3000 level. The daily RSI gathers pace and approaches the 37 level.
Resistance levels: 1.1877 1.1925 1.2029 (4H chart)
Support levels: 1.1716 1.1638 1.1445 (4H chart)
-637968763745027056.png)
AUDUSD
AUD/USD left behind Monday’s “doji-like” session and advanced to 3-day highs after retaking the key 0.6900 barrier and beyond on turnaround Tuesday.
The sharp reversion of the greenback forced the US Dollar Index (DXY) to abandon the area of cycle highs and refocus instead on the 108.00 neighbourhood following discouraging readings from advanced PMIs and New Home Sales, all morphing into fresh legs to the Aussie dollar.
The mixed performance in the commodity universe also limited the upside in the pair, despite prices of the iron ore and copper edged higher.
Data wise Down Under, flash Manufacturing PMI is seen at 54.5 in August (from 55.7) and the Services PMI is expected at 49.6 (from 50.9).
AUD/USD printed a new August low at 0.6856 (August 23). The breakdown of this level could prompt the 2022 low at 0.6681 (July 14) to re-emerge on the horizon ahead of the May 2020 low at 0.6372 (May 4) and the weekly low at 0.6253 (April 21 2020). Inversely, there is an interim hurdle at the 55-day SMA at 0.6925 followed by the psychological 0.7000 mark and the 100-day SMA at 0.7040. Further north emerges the August high at 0.7136 (August 11), which remains underpinned by the 200-day SMA. The continuation of the rebound could see the June high at 0.7282 (June 3) revisited prior to the weekly top at 0.7458 (April 21). The daily RSI picks up pace and reaches the 48 level.
Resistance levels: 0.6963 0.7040 0.7136 (4H chart)
Support levels: 0.6856 0.6802 0.6681 (4H chart)
-637968765384912176.png)
GOLD
Gold rose to 2-day highs and climbed beyond the $1,750 level soon after US data releases disappointed expectations on Tuesday.
Indeed, the US Dollar Index (DXY) quickly abandoned the area of cycle highs and returned to the negative territory in response to lower-than-expected flash PMIs readings and poor US housing data.
In addition, the U-turn in US yields also combined with the above and lent much needed oxygen to the precious metal.
Extra recovery in gold now targets the 55-day SMA at $1,777 ahead of the August top at $1,807 (August 10). The breakout of this level opens the door to a visit to the 100- and 200-day SMAs at $1,825 and $1,839, respectively, prior to the June high at $1,879 (June 13) and the April peak at $1,998 (April 19). On the flip side, immediate contention appears at the August low at $1,727 (August 22) could spark a deeper retracement to the weekly low at $1,711 (July 27) before the round level at $1,700. The drop below this level could put the 2022 low at $1,680 (July 21) back on the radar before the 2021 low at $1,1676 (March 8) and the June 2020 low at $1,670 (June 5).
Resistance levels: $1,754 $1,772 $1,782 (4H chart)
Support levels: $1,727 $1,711 $1,680 (4H chart)
-637968766777495703.png)
CRUDE WTI
Prices of the American benchmark for the sweet light crude oil rose to multi-session highs past the $94.00 mark per barrel on Tuesday.
The strong advance in the commodity came in response to OPEC+ comments, particularly from Saudi Arabia, hinting at the probability that the cartel could cut its oil output in the event of a positive outcome from the Iran-West negotiations to revive the 2015 Tehran nuclear deal.
It is worth recalling that such a scenario could see around 1 mbpd of Iranian crude oil return to the markets.
Also bolstering the upbeat mood surrounding the commodity, the situation in Libya threatens to derail into further turmoil, while the CPC terminal in the Black Sea is expected to face at least a month of disruptions due to repairs.
Later in the NA session, the API will report on US crude oil stockpiles in the week to August 19.
Further advance in prices of the WTI should face the immediate up barrier at the weekly top at $95.04 (August 11), an area also propped up by the key 200-day SMA at $95.72. If the commodity clears this region, it could then confront the psychological $100.00 mark ahead of the weekly high at $101.87 (July 29) and another weekly peak at $104.44 (July 19). The breakout of the latter could prompt the July top at $111.42 (July 5) to re-emerge on the horizon before the weekly high at $114.00 (June 29) and the June peak at $123.66 (June 14). In the opposite direction, the August low at $85.74 (August 16) should offer decent contention seconded by the 81.94 level (low January 24). South from here comes the round level at $80.00 ahead of the 2022 low at $74.30 (January 3).
Resistance levels: $94.19 $95.04 $96.55 (4H chart)
Support levels: $86.26 $85.72 $81.90 (4H chart)
-637968768365973624.png)
DOW JONES
US equities traded in a choppy fashion on turnaround Tuesday, as investors evaluated the possibility that the Fed could not be as aggressive as planned when it comes to hiking rates, all following Tuesday’s release of disheartening PMIs figures as well as poor results from the US housing sector.
In addition, the cautious note among traders is expected to prevail for the time being ahead of the key speech by Chief Powell at the Jackson Hole Symposium on Friday.
All in all, the Dow Jones retreated 0.32% to 32,960, the S&P500 declined 0.02% to 4,136 and the tech benchmark Nasdaq Composite advanced 0.20% to 12,408.
If the Dow Jones accelerates losses, it could retest the 100-day SMA at 32,573 prior to the August low at 32,387 (August 2) and the 55-day SMA at 31,953. A drop below the latter should expose the weekly low at 31,534 (July 21) ahead of the July low at 30,143 (July 14) and the 2022 low at 29,653 (June 17). The initial up barrier now appears at the key 200-day SMA at 33,827 before the August top at 34,281 (August 16). If the index clears this level, it could then put a potential test of the April peak at 35,492 (April 21) back on the traders’ radar before the February high at 35,824 (February 9). The RSI extends the retracement to the 50 region.
Top Performers: Chevron, Caterpillar, Dow
Worst Performers: Procter&Gamble, Home Depot, UnitedHealth
Resistance levels: 34,281 35,492 35,824 (4H chart)
Support levels: 32,858 32,570 32,387 (4H chart)
-637968768945862674.png)
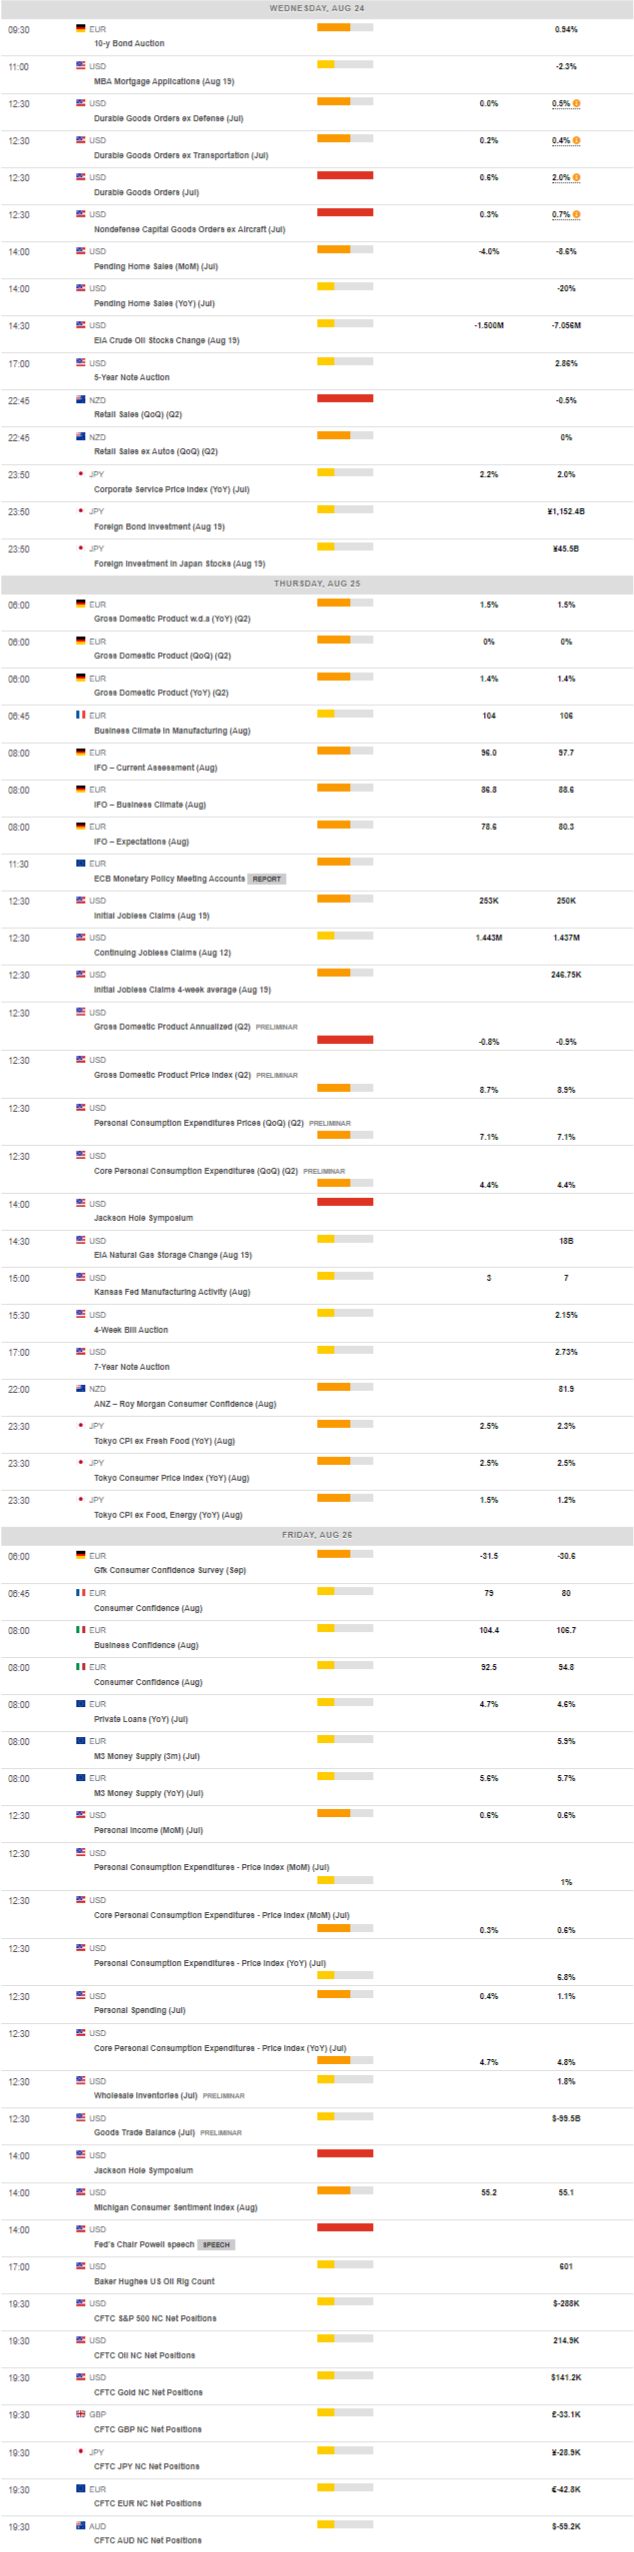
MACROECONOMIC EVENTS
All Information & Updates provided by:

All information relating to the financial markets available on this page has been prepared and issued by FXStreet (Forexstreet SL, Spain, Reg: B62498233) on the basis of publicly available information and all information believed to be reliable and does not conflict with Kuwaiti local laws, and all necessary care has been taken to before the company to ensure that the facts mentioned are correct from the source.
NCM Investment nor any of its directors or employees shall in any way be held responsible for the contents of this news, and the information contained on this page is intended only to provide clients with publicly available information and should not be construed as investment advice, report or analysis and/or constitute an offer or invitation to buy or sell financial instruments of any kind.
RISK WARNING: Forex and CFDs are highly risky leveraged products, as losses can exceed deposits. Please ensure you understand all the risks and take independent advice if necessary. NCM will segregate the clients based on the criteria of the regulator and its bylaws. NCM does not provide any advisory service; the material published does not constitute advice or a recommendation for a transaction in any financial instrument. NCM accepts no responsibility for any use of the content presented and any consequences of that use. Anyone acting on the information provided does so at their own risk.