
- Contact Us:
-

-

-

-


Daily Market Updates
25 Aug 2022
EURUSD
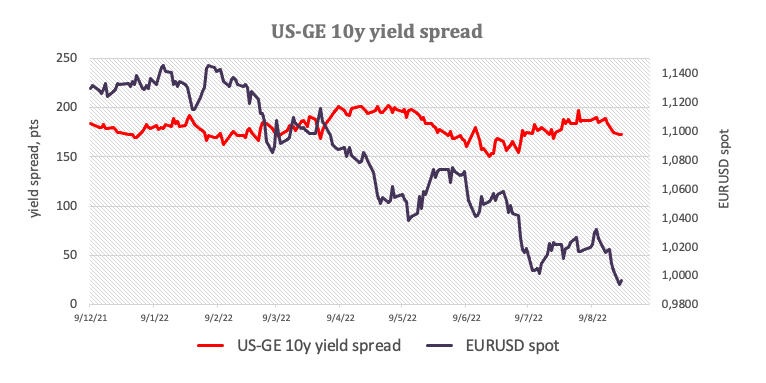
EUR/USD attempted a move to the key parity region in the wake of another disappointing results from the US housing sector. However, that move was short-lived and the pair quickly returned to the 0.9950/60 band, down smalls for the day.
The resumption of the bearish trend in spot came as usual in response to the firm buying interest surrounding the greenback, which has accentuated in past weeks on the back of hawkish rhetoric from Fed’s rate setters and interrupted at the same time by weaker-than-expected readings in the US docket, which in turn reignited recession concerns.
Speaking about the Fed, the likelihood of a 50 bps and 75 bps rate hike next month appears equilibrated according to CME Group’s FedWatch Tool, giving the upcoming PCE release and Powell’s speech at the Jackson Hole Symposium more relevance.
In the US and German money markets, the recent uptrend in yields remained firm amidst rising prudence in light of the upcoming key events towards the end of the week.
There were no data releases in the euro docket on Wednesday, whereas the US calendar saw MBA Mortgage Applications contract 1.2% in the week to August 19, Durable Goods Orders come flat MoM in July and Pending Home Sales shrink 19.9% YoY also in July.
Extra weakness in EUR/USD continues to target the 2022 low at 0.9899 (August 23), while a breach of this level should put the December 2002 low at 0.9859 back on the radar ahead of the October 2002 low at 0.9685 (October 21) and the September 2002 low at 0.9608 (September 17). In the opposite direction, bulls face a minor hurdle at the 1.0202 level (August 17 high) ahead of the temporary 55-day SMA at 1.0267 and the August top at 1.0368 (August 10). Beyond the latter comes the 100-day SMA at 1.0446 prior to the weekly peak at 1.0615 (June 27). The daily RSI appears stable near 34.
Resistance levels: 1.0018 1.0046 1.0095 (4H chart)
-637969659303382570.png)
USDJPY
USD/JPY regained some composure and managed to close Wednesday’s session with modest gains near the 137.00 barrier, extending at the same time the bounce off Tuesday’s lows around 135.80.
The recovery in US yields following the initial absence of traction along with the noticeable rebound in the greenback put the Japanese yen under downside pressure and favoured the resumption of the bid bias in the pair.
So far, US yields kept underpinning the uptrend in the pair, always on the back of firm prospects of further Fed’s tightening as well as the expected hawkish message from Chief Powell at his speech at the Jackson Hole Symposium later in the week.
The Japanese calendar was empty on Wednesday, leaving Thursday’s Foreign Bond Investment figures as the next data release of note.
The topside in USD/JPY remains unchanged, with the August high at 137.70 (August 23) emerging as the next hurdle of relevance prior to the round level at 138.00. Above this level appears the post-BoJ top at 138.87 (July 21) followed by the 2022 peak at 139.38 (July 13) and the round level at 140.00. On the flip side, the weekly low at 135.80 should hold the initial test just ahead of the 55-day SMA at 135.49. The loss of the latter exposes a drop to the 100-day SMA at 132.35 prior to the weekly low at 131.73 (August 11) and the August low at 130.39 (August 2), which is closely followed by the psychological 130.00 mark. The daily RSI improves a little to the area around 59.
Resistance levels: 137.70 137.97 138.87 (4H chart)
Support levels: 135.80 135.64 134.64 (4H chart)
-637969656167631121.png)
GBPUSD
Same as the rest of the risk-associated assets, the sterling left behind Tuesday’s advance vs. the greenback and dragged GBP/USD back to the negative territory in the sub-1.1800 region on Wednesday.
Indeed, cable resumed the downside as the US dollar quickly forgot about the previous day’s pullback, motivating the US Dollar Index (DXY) to retest the area just above 109.00 helped by the solid pace in US yields.
In the UK debt market, instead, UK 10y Gilt yields extended the uptrend further north of the 2.70% level, an area last traded back in mid-June.
No news in the UK docket left the attention to Thursday’s yearly results from Car Production and the CBI Distributive Trends.
If bears regain the initiative, GBP/USD should face immediate contention at the 2022 low at 1.1716 (August 23). The breakdown of this level is not expected to meet any significant support until the 2020 low at 1.1409 (March 20). Conversely, the weekly high at 1.1878 emerges as the initial minor hurdle followed by the 55-day SMA at 1.2080 and the August top at 1.2293 (August 1). Extra upside from here targets the 100-day SMA at 1.2327 ahead of the weekly high at 1.2405 (June 16). Once cleared, the 1.2666 level (May 27 top) could emerge on the horizon ahead of the psychological 1.3000 yardstick. The daily RSI loses traction and breaches 35.
Resistance levels: 1.1878 1.1925 1.2029 (4H chart)
Support levels: 1.1716 1.1638 1.1445 (4H chart)
-637969655347392601.png)
AUDUSD
AUD/USD set aside two consecutive daily advances and resumed the downtrend on Wednesday, as the greenback carried on with the ongoing strong uptrend and motivated the US Dollar Index (DXY) to briefly trespass the 109.00 zone.
Indeed, the continuation of the move higher in the dollar undermined the sentiment in the risk complex and put the commodity space under renewed pressure. On the latter, copper prices grinded lower, while another uptick in prices of the tonne of iron ore failed to lend some legs to the Aussie dollar.
It is worth recalling that prices of the iron ore rebounded nicely on Tuesday and extended that move on Wednesday following the interest rate cut by the PBoC early on Tuesday to prop up the property market.
Absent data releases in the Australian calendar for the rest of the week, the focus of attention should shift to the publication of advanced Retail Sales for the month of July due on Monday.
Immediately to the downside for AUD/USD comes the August low at 0.6856 (August 23), which exposes a move to the 2022 low at 0.6681 (July 14) in case that level is breached. South from here emerges the May 2020 low at 0.6372 (May 4) prior to the weekly low at 0.6253 (April 21 2020). On the contrary, the weekly high at 0.6963 (August 23) should offer minor resistance before the psychological 0.7000 level and the 100-day SMA at 0.7035. If the pair breaks above this zone, it could pave the way for a probable visit to the August top at 0.7136 (August 11) just ahead of the 200-day SMA. Further gains should target the June peak at 0.7282 (June 3) before the weekly high at 0.7458 (April 21). The daily RSI comes under pressure near 46.
Resistance levels: 0.6963 0.7040 0.7136 (4H chart)
Support levels: 0.6856 0.6802 0.6681 (4H chart)
-637969657687786225.png)
GOLD
Prices of the ounce troy of the precious metal prolonged Tuesday’s advance and managed to surpass the $1,750 level, recording marginal gains for the day.
Once again, the continuation of the upside momentum in the dollar in combination with another positive performance of US yields across the curve put bullion under renewed downward pressure and limited the upside potential on Wednesday.
The yellow metal is predicted to remain under the microscope in light of the start of the Jackson Hole Symposium on Thursday and the speech by Fed’s Powell on Friday, which according to current consensus, is seen coming on the hawkish side, just in line with recent Fedspeak.
If gold accelerates losses, it could see the August low at $1,727 (August 22) retested in the near term ahead of the weekly low at $1,711 (July 27) and the round level at $1,700. The breach of the latter should open the door to the 2022 low at $1,680 (July 21) ahead of the 2021 low at $1,1676 (March 8) and the June 2020 low at $1,670 (June 5). Bouts of strength, on the other hand, need to surpass the 55-day SMA at $1,775 to confront the August high at $1,807 (August 10) prior to the 100- and 200-day SMAs at $1,823 and $1,838, respectively. Above this region comes the June top at $1,879 (June 13) seconded by the April peak at $1,998 (April 19).
Resistance levels: $1,755 $1,772 $1,782 (4H chart)
Support levels: $1,727 $1,711 $1,680 (4H chart)
-637969658107321308.png)
CRUDE WTI
Prices of the WTI extended the march north for the third consecutive session and flirted with the key 200-day SMA north of the $95.00 mark per barrel on Wednesday.
In fact, daily gains in crude oil appeared again bolstered by record US exports of crude oil and oil products to Asia and Europe, as the energy crunch in these two continents continued to aggravate, as per the latest report by the EIA.
In the meantime, traders continue to gauge the prospects for a potential economic slowdown in response to the Fed’s tightening plans coupled with a probable positive outcome from the Iran-West talks regarding the 2015 nuclear deal.
In addition, the agency reported a 3.282M barrels drop in US crude oil inventories in the week to August 19, while supplies at Cushing rose by 0.426M barrels and gasoline stockpiles shrank by 0.027M barrels.
A convincing surge above the 200-day SMA at $95.78 could see the barrel of the WTI revisit the psychological $100.00 mark prior to the weekly high at $101.87 (July 29) and another weekly top at $104.44 (July 19). If the commodity clears this level, then the July peak at $111.42 (July 5) could return to the traders’ radar ahead of the weekly high at $114.00 (June 29) and the June top at $123.66 (June 14). On the other hand, immediate contention emerges at the August low at $85.74 (August 16) prior to the 81.94 level (low January 24). A deeper drop could retest the round level at $80.00 before the 2022 low at $74.30 (January 3).
Resistance levels: $95.30 $96.55 $101.87 (4H chart)
Support levels: $90.59 $86.26 $85.72 (4H chart)
-637969659386758452.png)
DOW JONES
Equities partially reversed the recent weakness and advanced modestly midweek on the back of the rebound in the tech sector and amidst the broad-based cautiousness ahead of the Jackson Hole Symposium later in the week.
Indeed, investors kept the prudent trade ahead of the speech by Chief Powell on Friday against the backdrop of persistent speculation over the size of September's rate hike and the omnipresent spectre of a recession.
Against that, the Dow Jones gained 0.03% to 32,920, the S&P500 advanced 0.16% to 4,135 and the tech-heavy Nasdaq Composite rose 0.38% to 12,428.
The so far weekly decline in the Dow Jones appears to have halted just ahead of the 32,800 area. However, a breach of the weekly low at 32,828 (August 24) could spark a test of the 100-day SMA at 32,555 ahead of the August low at 32,387 (August 2) and the 55-day SMA at 31,952. The loss of this area could prompt the weekly low at 31,534 (July 21) to resurface on the horizon before the July low at 30,143 (July 14) and the 2022 low at 29,653 (June 17). Just the opposite, the index needs to clear the key 200-day SMA at 33,810 to allow for the continuation of the uptrend to the August high at 34,281 (August 16) followed by the April top at 35,492 (April 21) and the February peak at 35,824 (February 9). The RSI hovers around the 50 area so far.
Top Performers: Salesforce.com, Walt Disney, Boeing
Worst Performers: Dow, Walgreen Boots, Caterpillar
Resistance levels: 34,281 35,492 35,824 (4H chart)
Support levels: 32,550 32,387 31,705 (4H chart)
-637969659849244461.png)
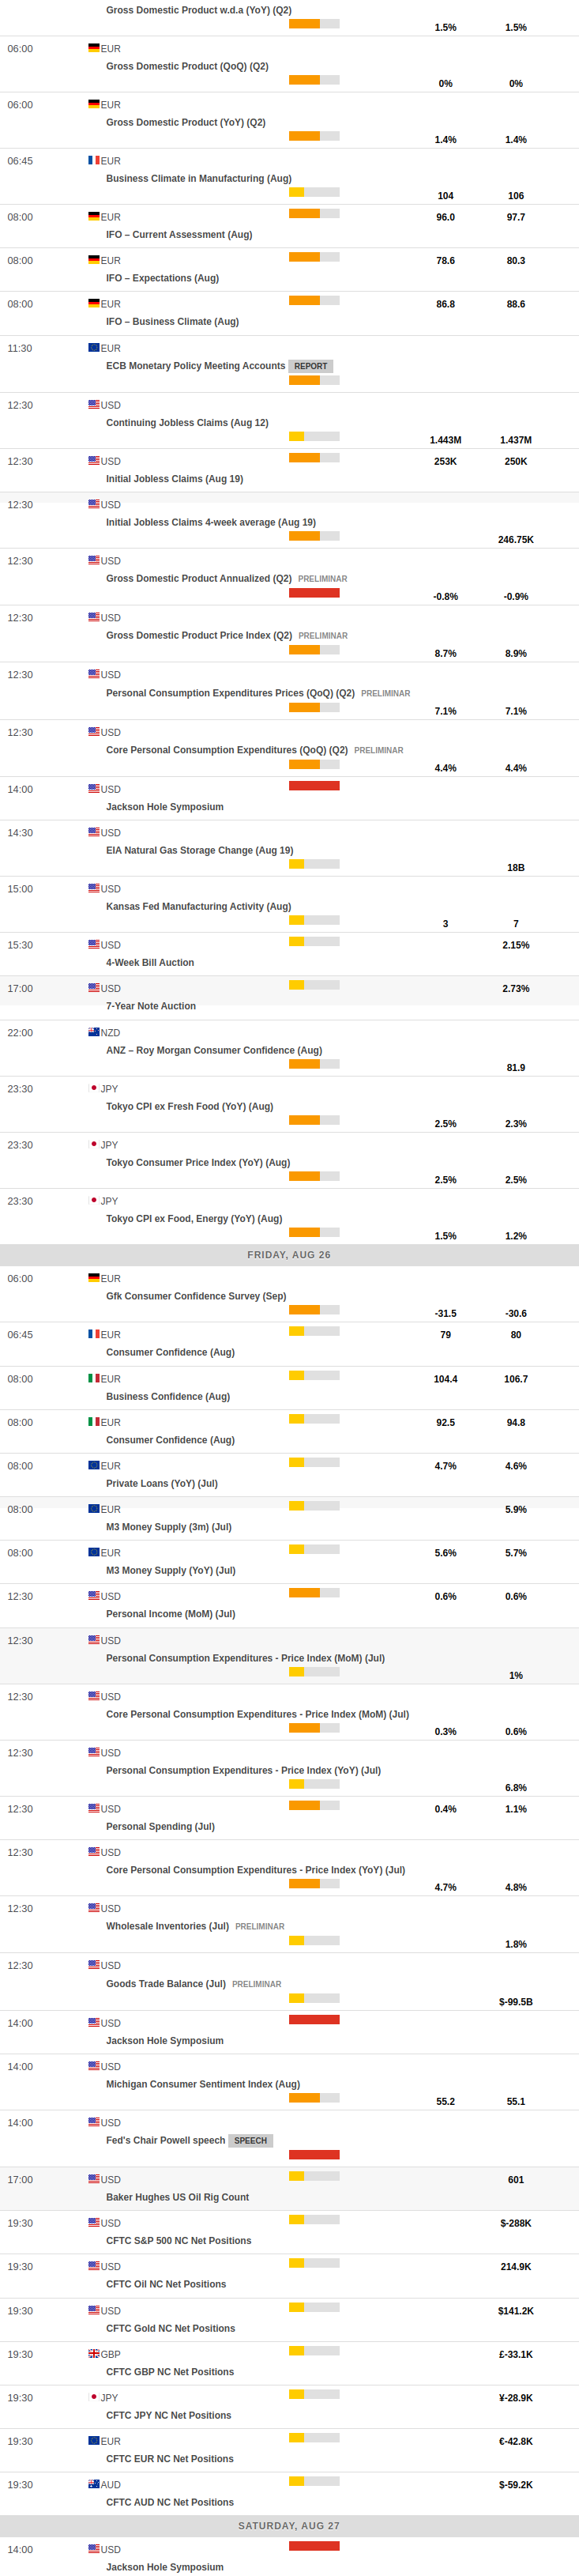
MACROECONOMIC EVENTS
All Information & Updates provided by:

All information relating to the financial markets available on this page has been prepared and issued by FXStreet (Forexstreet SL, Spain, Reg: B62498233) on the basis of publicly available information and all information believed to be reliable and does not conflict with Kuwaiti local laws, and all necessary care has been taken to before the company to ensure that the facts mentioned are correct from the source.
NCM Investment nor any of its directors or employees shall in any way be held responsible for the contents of this news, and the information contained on this page is intended only to provide clients with publicly available information and should not be construed as investment advice, report or analysis and/or constitute an offer or invitation to buy or sell financial instruments of any kind.
RISK WARNING: Forex and CFDs are highly risky leveraged products, as losses can exceed deposits. Please ensure you understand all the risks and take independent advice if necessary. NCM will segregate the clients based on the criteria of the regulator and its bylaws. NCM does not provide any advisory service; the material published does not constitute advice or a recommendation for a transaction in any financial instrument. NCM accepts no responsibility for any use of the content presented and any consequences of that use. Anyone acting on the information provided does so at their own risk.