
- Contact Us:
-

-

-

-


Daily Market Updates
26 Aug 2022
EURUSD
EUR/USD managed to finally surpass the parity threshold and advanced to the 1.0030 region, where some initial resistance seems to have turned up on Thursday. The daily advance, however, was quickly reversed and spot retreated to the 0.9950/60 band, where it held ground amidst marginal gains.
The broad-based improvement in the appetite for the risk galaxy underpinned the move higher in the European currency, which was also helped by the recent announcements from the PBoC regarding extra stimulus and the mild offered bias in the buck.
On the latter, the US Dollar Index (DXY) prolonged the weekly correction and revisited the 108.00 neighbourhood just a couple of sessions after flirting with nearly 2-decade peaks around 109.30.
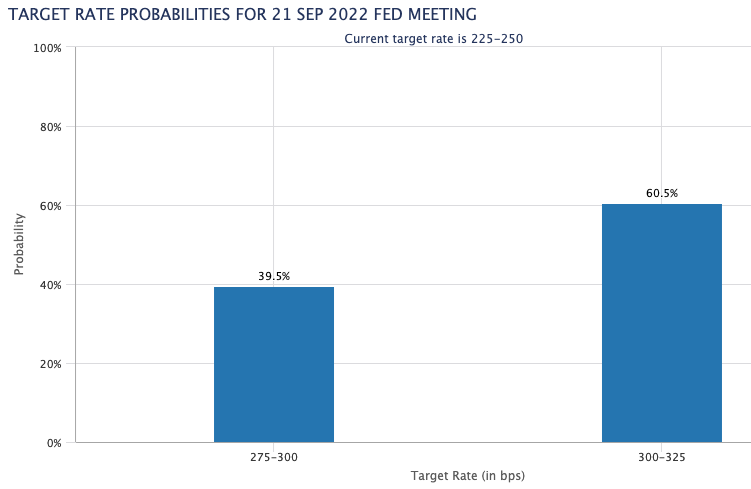
The loss of momentum in the dollar came in tandem with investors pricing in a 75 bps rate hike by the Fed at its meeting next month, while a hawkish message from Chief Powell at his speech at the Jackson Hole Symposium on Friday seemed also incorporated in investors’ expectations.
No meaningful reaction in the single currency after the ECB Accounts suggested that the risk surrounding longer-term inflation expectations being unanchored is on the rise.
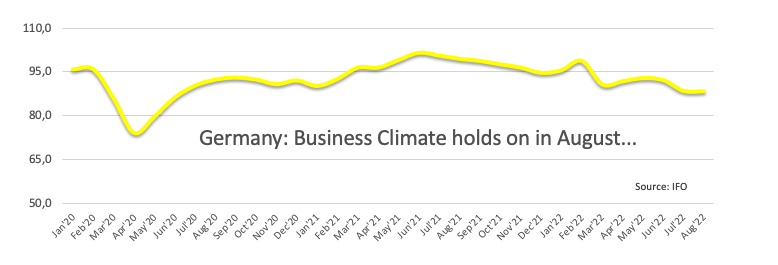
In the euro docket, final figures of the GDP Growth Rate showed the German economy expanded 1.7% YoY in the April-June period and 0.1% vs. the previous quarter. Still in Germany, the Business Climate measured by the IFO Institute eased a tad to 88.5 in August (from 88.6). In France, the Business Confidence receded to 104 in the current month (from 106).
In the US data space, another revision of the Q2 GDP Growth Rate expected the economy to have contracted 0.6% QoQ, while additional results saw Initial Claims rising by 243K in the week to August 20.
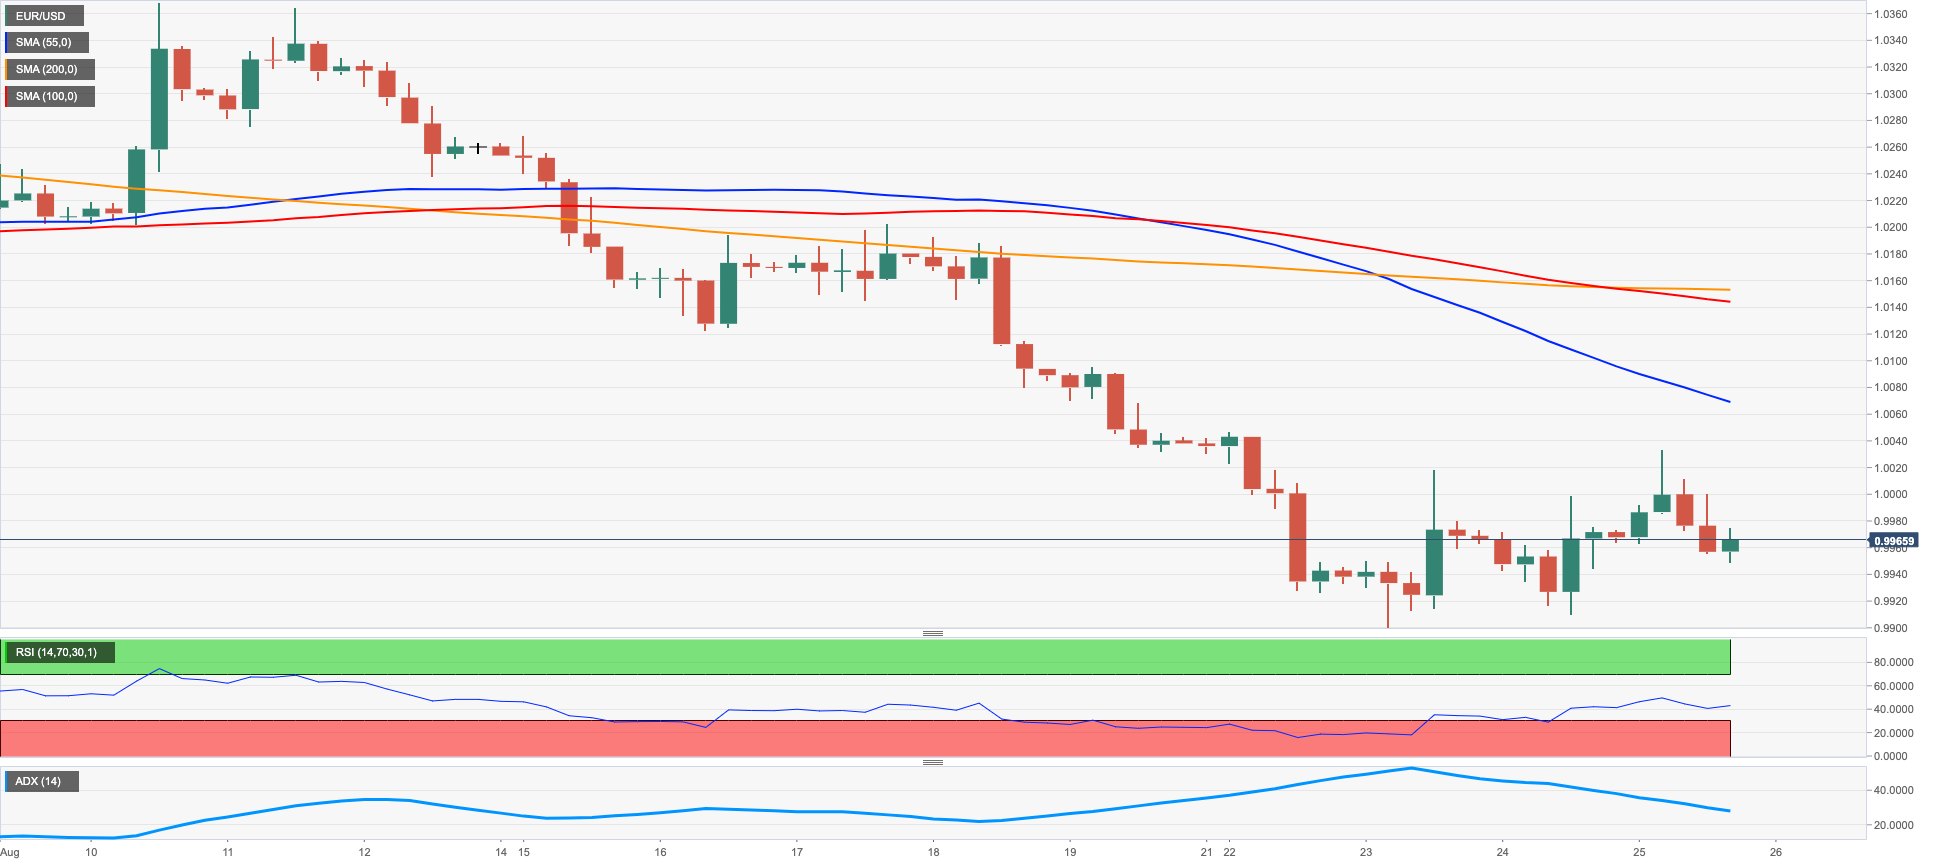
In case bulls decide to push harder, EUR/USD now faces the immediate hurdle at 1.0033 (August 25 high) ahead of the 1.0202 level (August 17 top). The break above this area exposes the interim 55-day SMA at 1.0256 ahead of the August peak at 1.0368 (August 10). Further up aligns the 100-day SMA at 1.0437 before the weekly high at 1.0615 (June 27). On the contrary, the 2022 low at 0.9899 (August 23) emerges as the key magnet for bears prior to the December 2002 low at 0.9859. A deeper drop could prompt the October 2002 low at 0.9685 (October 21) to emerge on the horizon ahead of the September 2002 low at 0.9608 (September 17). The daily RSI rises marginally above 35.
Resistance levels: 1.0033 1.0046 1.0095 (4H chart)
Support levels: 0.9899 0.9859 0.9685 (4H chart)
USDJPY
USD/JPY set aside Wednesday’s daily advance and corrected lower to the 136.30 region on Thursday, where bears met significant resistance for the time being.
The renewed downside bias in the pair came in response to the resumption of the sentiment in the risk complex and the loss of momentum in the greenback. Also collaborating with the daily decline in spot appeared the corrective downtick in US yields across the curve, which appeared to have taken a breather in light of the recent strong advance.
News from the BoJ noted member Nakamura saying domestic inflation could accelerate in response to higher energy and fuel costs, although it is expected to slow down afterwards. He also ruled out the start of a hiking cycle by the BoJ for the time being and advocated for the continuation of the current easing stance.
In the Japanese calendar, Foreign Bond Investment shrank to ¥79.2B in the week to August 20.
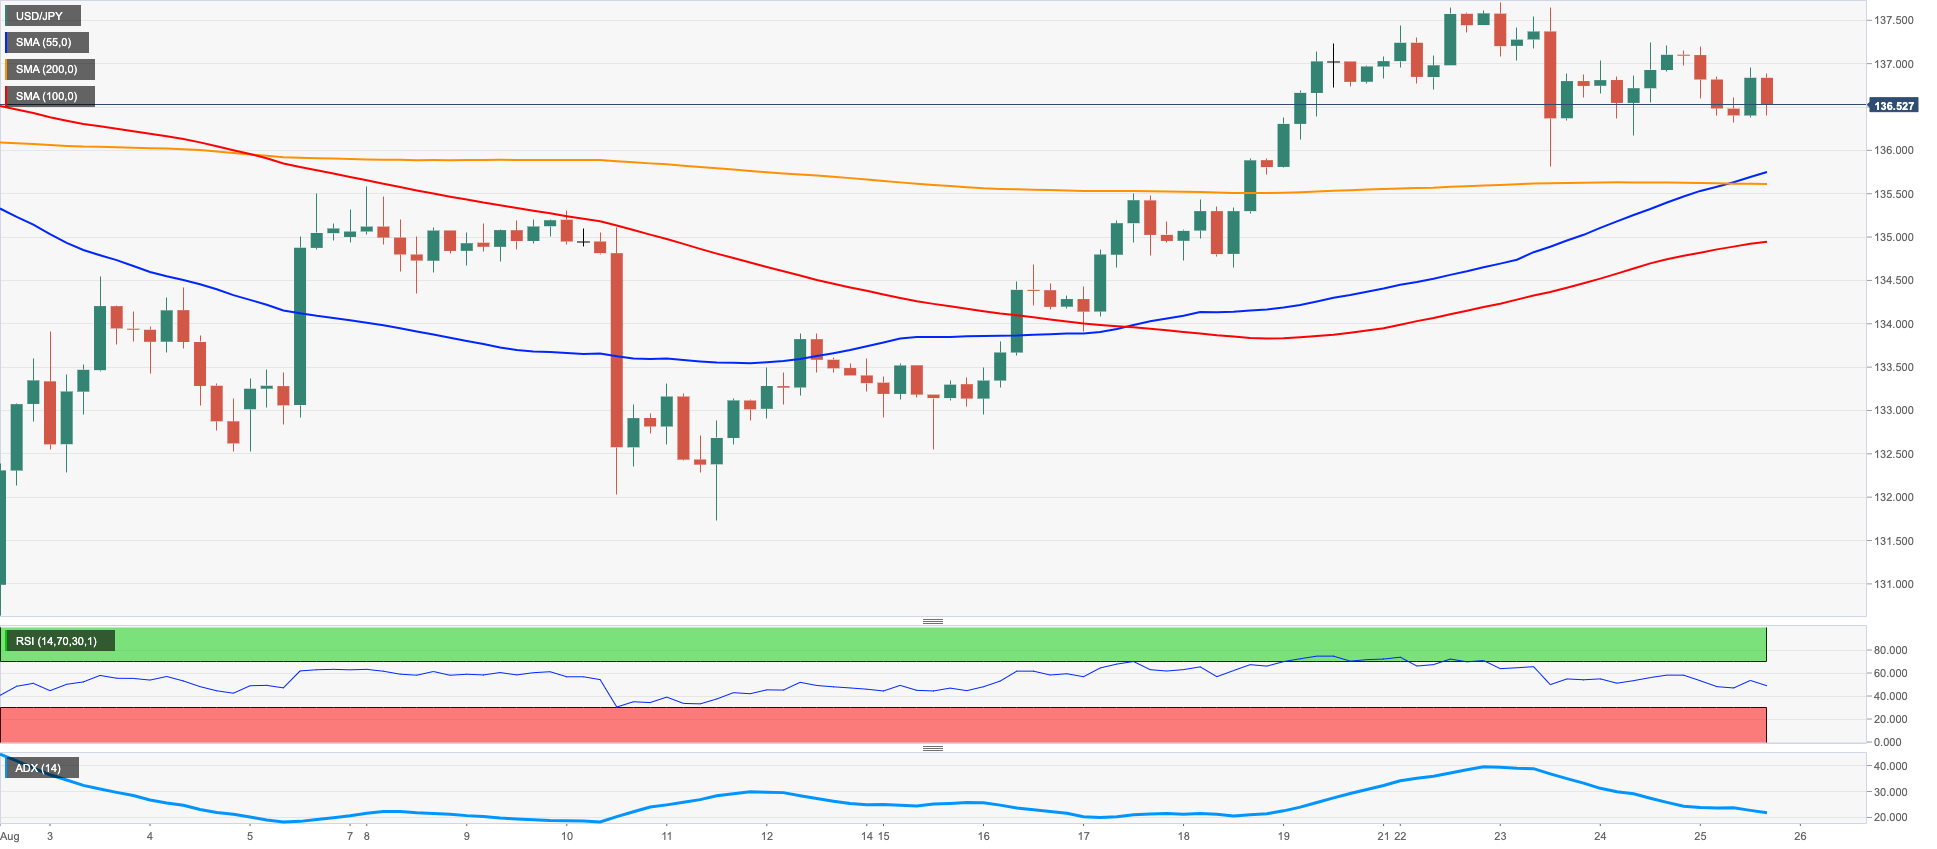
USD/JPY seems stuck within an incipient consolidation in the upper end of the range. The breakout of the August high at 137.70 (August 23) should put the round level at 138.00 back on the radar prior to the post-BoJ top at 138.87 (July 21). The surpass of the latter could pave the way for a move to the 2022 peak at 139.38 (July 13) seconded by the round level at 140.00. Inversely, there is an initial contention at the weekly low at 135.80, which appears reinforced by the 55-day SMA at 135.53. A drop from here could target the 100-day SMA at 132.48 ahead of the weekly low at 131.73 (August 11) and the August low at 130.39 (August 2), all preceding the psychological 130.00 level. The daily RSI deflates to the sub-56 region.
Resistance levels: 137.24 137.70 137.97 (4H chart)
Support levels: 136.19 135.80 134.64 (4H chart)
GBPUSD
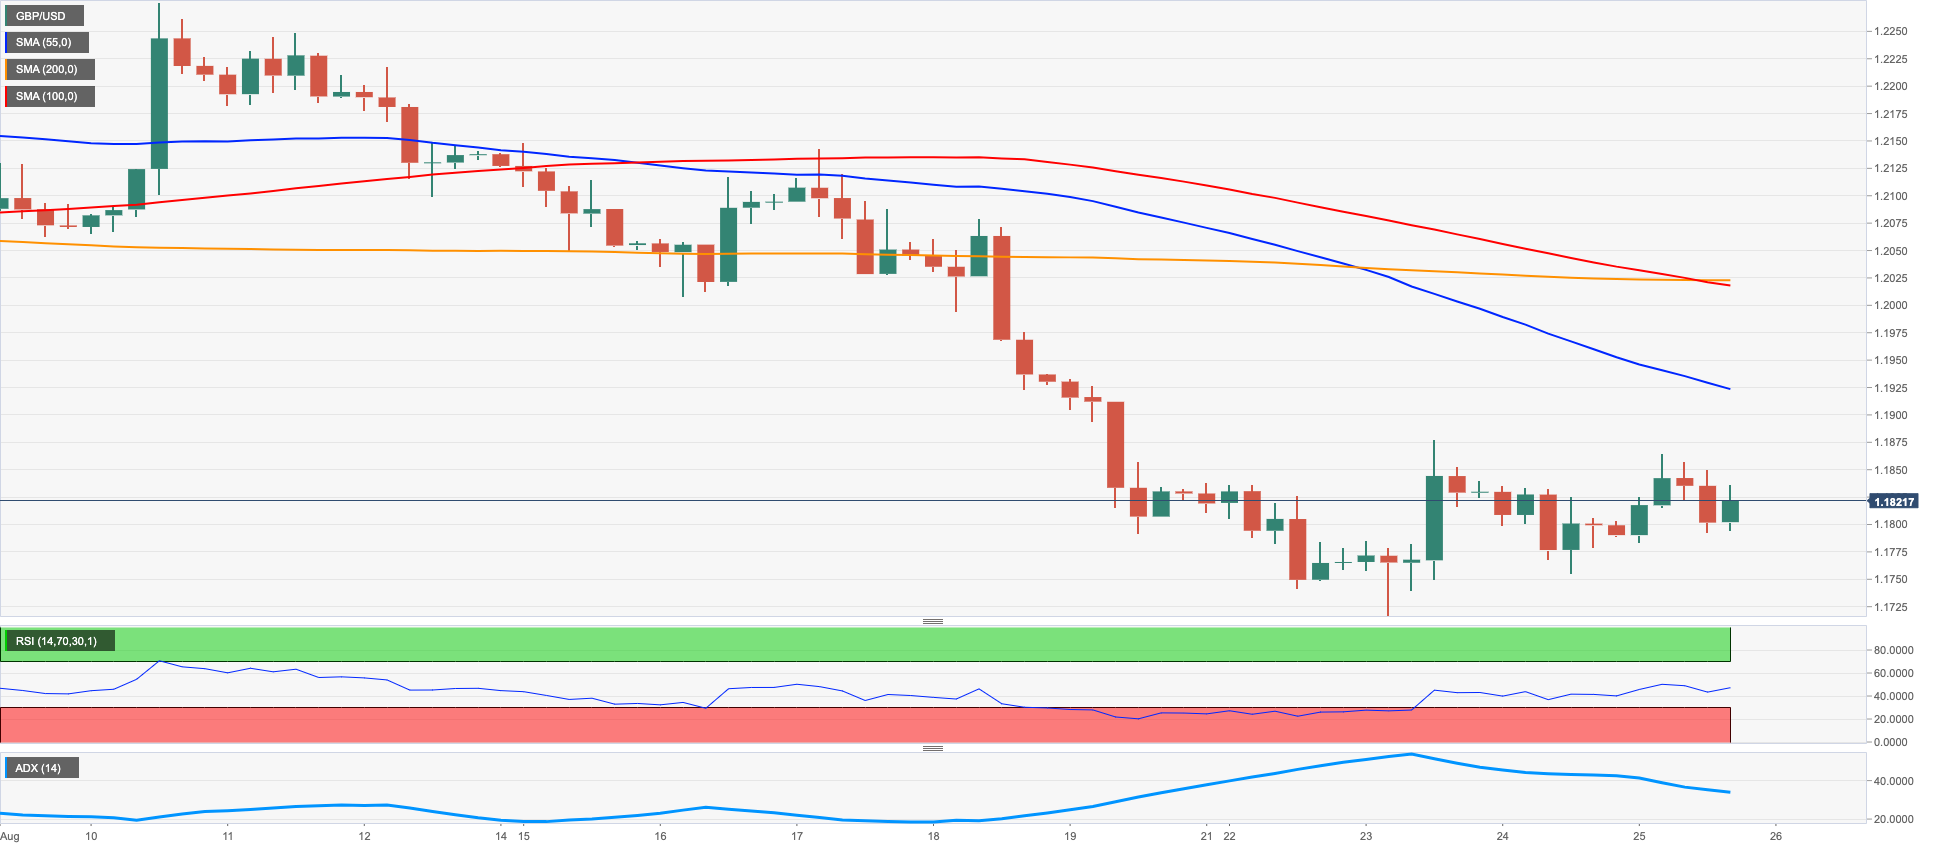
GBP/USD extended the erratic performance so far on Thursday and regained the area beyond 1.1800 the figure against the backdrop of dwindling upside momentum surrounding the greenback.
The daily uptick in cable came amidst a corrective drop in the UK 10y Gilt yields for the first time after seven consecutive daily advances, including fresh tops in an area last seen in mid-June around 2.70% (August 24).
In the UK calendar, Car Production expanded 8.6% in the year to July and the CBI Distributive Trends deteriorated to -7 in August (from -4).
GBP/USD could find some upside relief if it clears the weekly high at 1.1878 (August 23). Against that, the temporary 55-day SMA at 1.2068 should pop up next ahead of the August top at 1.2293 (August 1) and the 100-day SMA at 1.2315. Further north appears the weekly peak at 1.2405 (June 16) prior to the 1.2666 level (May 27 high), which should introduce a potential visit to the psychological 1.3000 mark in case it is cleared. In the opposite direction, the 2022 low at 1.1716 (August 23) is expected to offer solid support before the 2020 low at 1.1409 (March 20). The daily RSI improves further and trespasses 38.
Resistance levels: 1.1864 1.1878 1.2018 (4H chart)
Support levels: 1.1716 1.1638 1.1445 (4H chart)
AUDUSD
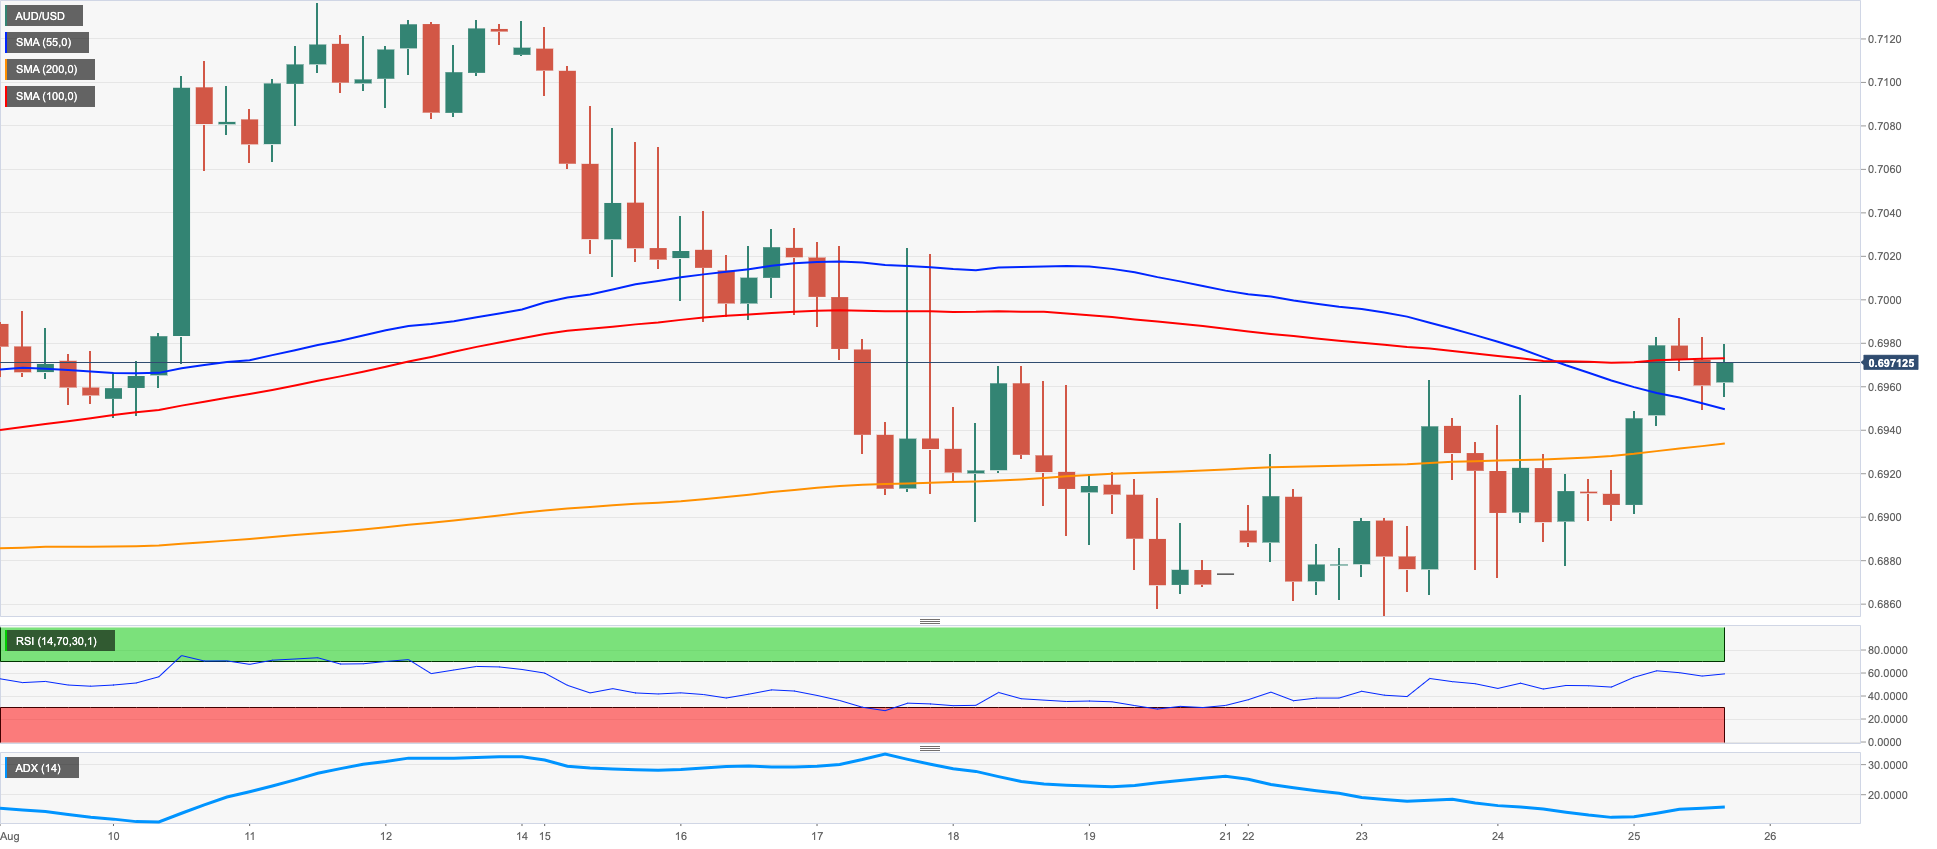
AUD/USD rose to multi-session highs in levels just shy of the psychological 0.7000 hurdle on Thursday, just to shed part of that move later in the session.
The renewed selling mood in the greenback allowed spot and the rest of the risk-associated universe to shrug off part of the recent weakness and chart decent gains ahead of the key Jackson Hole Symposium.
A marginal decline in the AGB 10y yields and mixed activity in the commodity galaxy – where both copper and iron ore edged higher - completed the scenario for the Aussie dollar on Thursday.
No releases Down Under on Thursday left the attention to Monday’s preliminary Retail Sales for the month of July.
If AUD/USD manages to clear the psychological 0.7000 hurdle, it could then attempt to confront the 100-day SMA at 0.7030 prior to the August high at 0.7136 (August 11), which remains propped up by the 200-day SMA, today at 0.7131. The surpass of this region could lead up to a potential visit to the June top at 0.7282 (June 3) ahead of the weekly peak at 0.7458 (April 21). Contrarily, the August low at 0.6856 (August 23) emerges as the next support of note before the 2022 low at 0.6681 (July 14). If breached, then the May 2020 low at 0.6372 (May 4) could return to the traders’ radar prior to the weekly low at 0.6253 (April 21 2020). The daily RSI advances past the 52 level.
Resistance levels: 0.6991 0.7040 0.7136 (4H chart)
Support levels: 0.6926 0.6856 0.6802 (4H chart)
GOLD
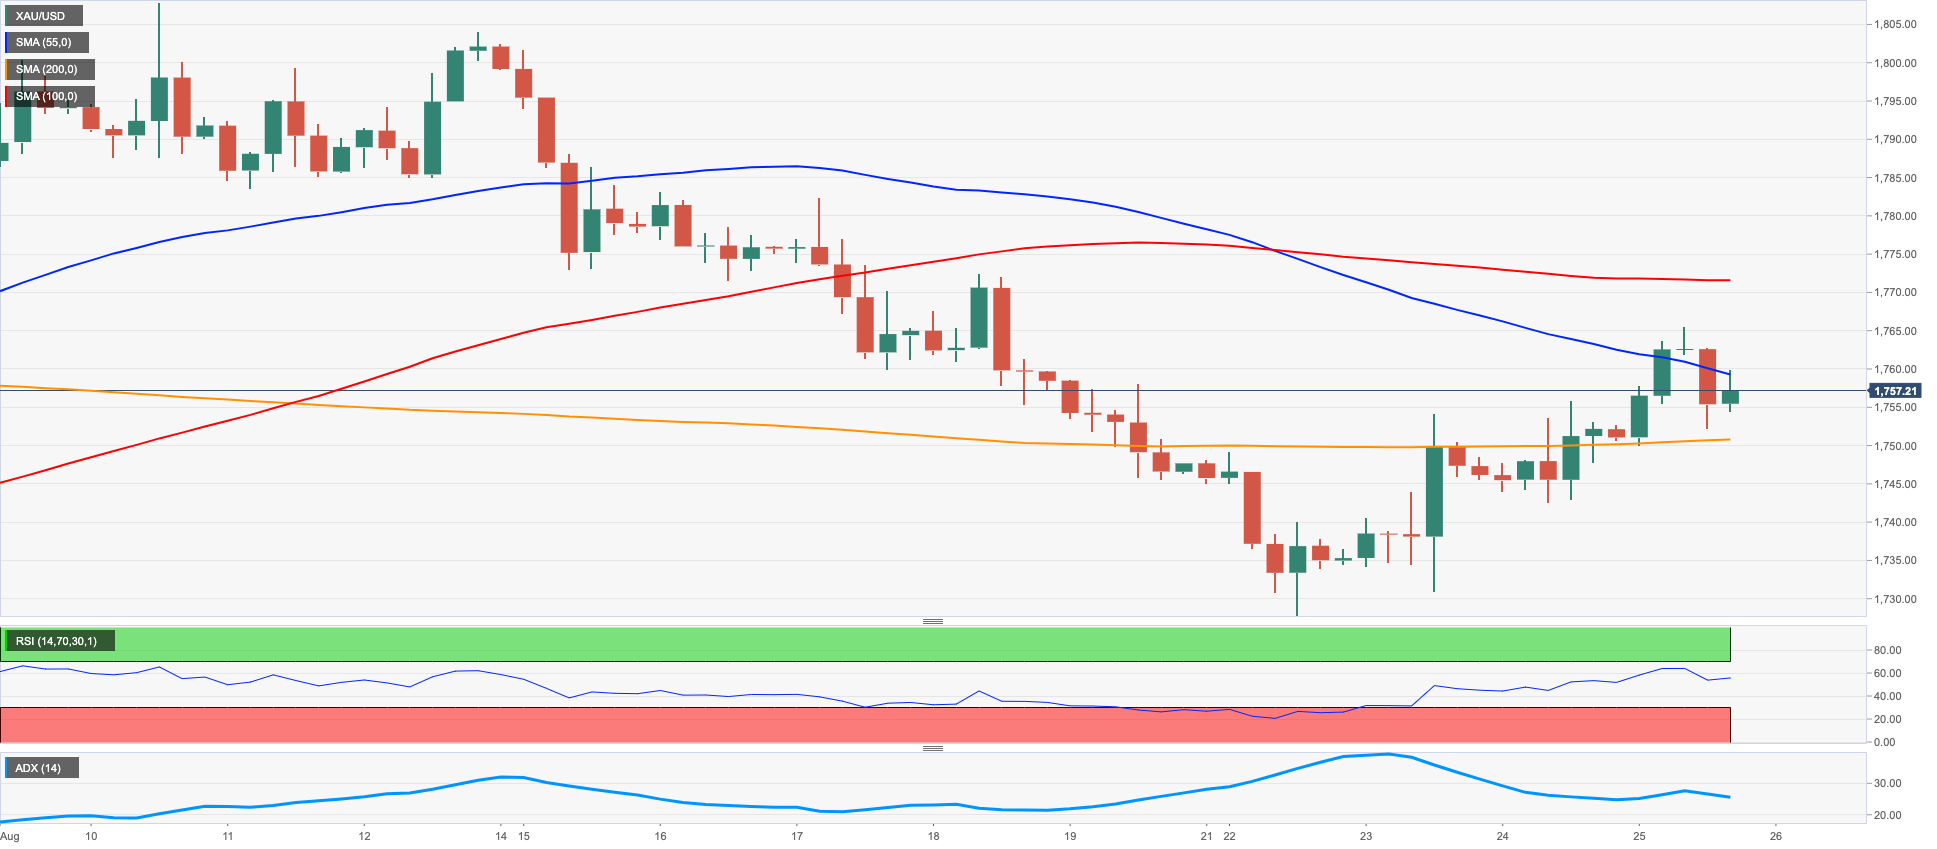
Bullion prices advanced for the third straight session to multi-day highs around $1,765 on the back of the corrective retracement in the US dollar and as the uptrend in US yields entered a pause mode.
Indeed, the greenback came under pressure following the better note in the risk galaxy and forced the US Dollar Index (DXY) to extend the knee-jerk post tops near 109.30 recorded earlier in the week.
Also underpinning the upbeat mood in the precious metal appeared the impasse in the monthly ascent in US yields across the curve, which remained near recent tops with modest losses, nonetheless.
The recent upside in prices of the precious metal, however, will be put to the test considering the start of the Jackson Hole Symposium, where the Fed’s potential next steps regarding its normalization process are expected to be in the centre of the debate.
The continuation of the bull run in gold should meet the next up barrier at the 55-day SMA at $1,774 prior to the August high at $1,807 (August 10). Further north emerges the 100- and 200-day SMAs at $1,822 and $1,838, respectively. The trespass of this area could favour a visit to the June top at $1,879 (June 13) ahead of the April peak at $1,998 (April 19). On the flip side, the immediate support is still seen at the August low at $1,727 (August 22) before the weekly low at $1,711 (July 27) and the round level at $1,700. A deeper pullback could pave the way for a test of the 2022 low at $1,680 (July 21), which is closely followed by the 2021 low at $1,1676 (March 8) and the June 2020 low at $1,670 (June 5).
Resistance levels: $1,765 $1,772 $1,782 (4H chart)
Support levels: $1,750 $1,727 $1,711 (4H chart)
CRUDE WTI
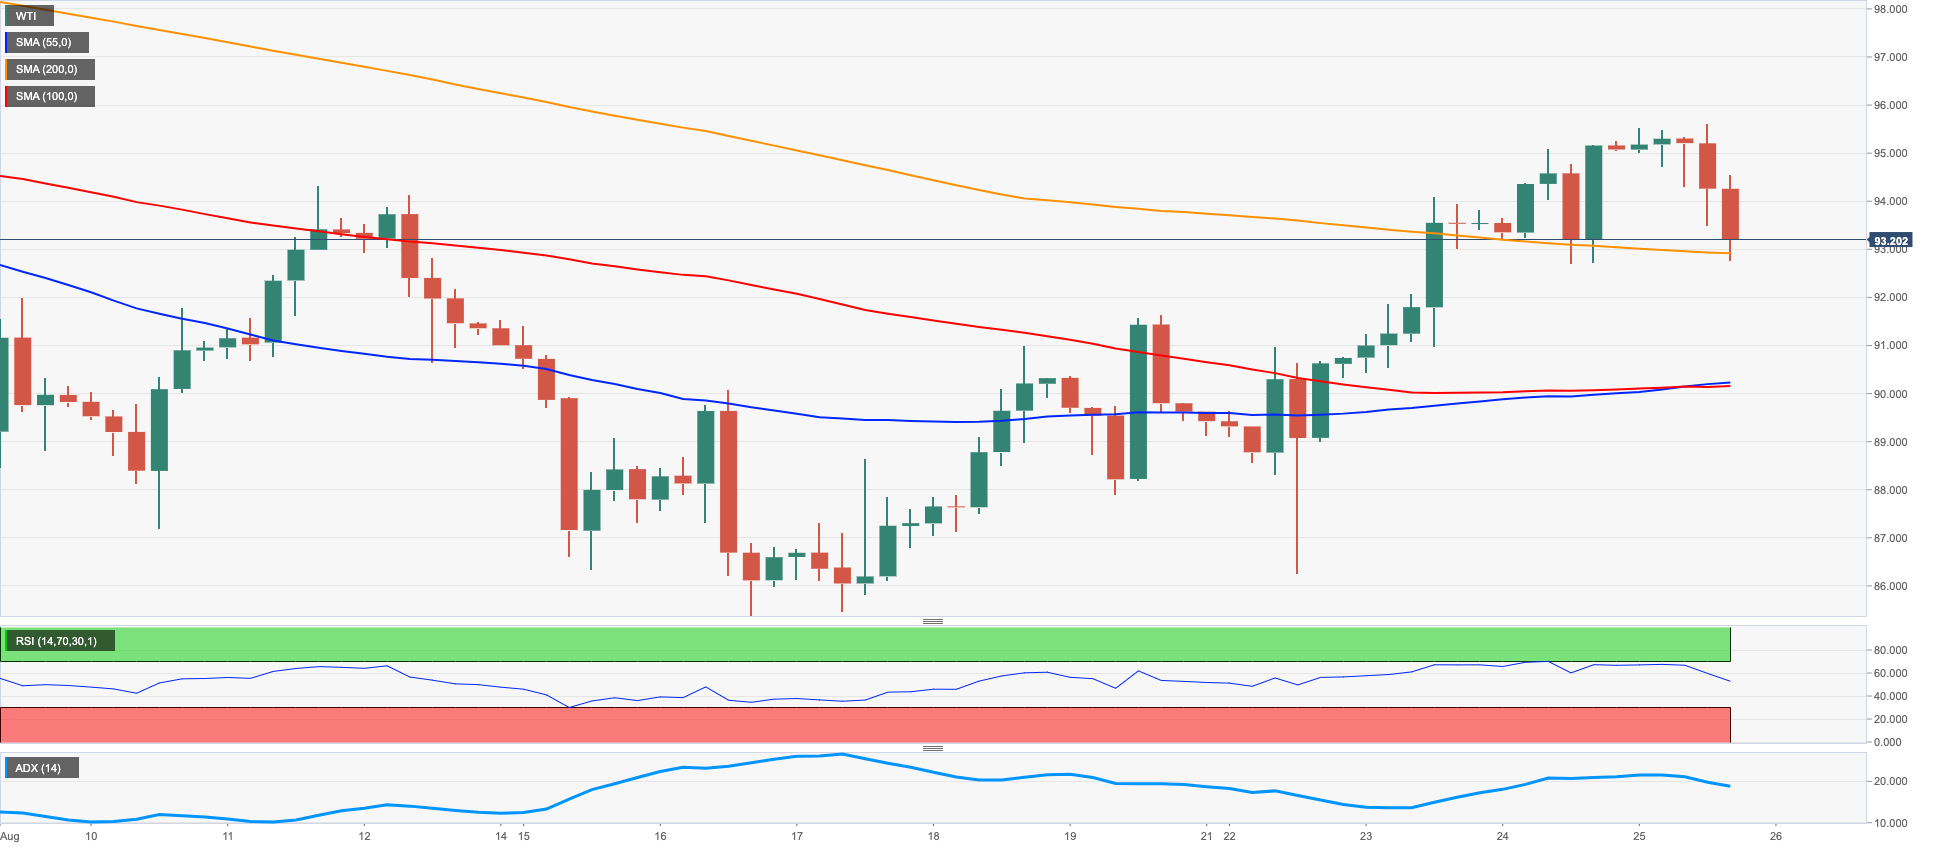
The American benchmark for the sweet light crude oil met a tough barrier north of the $95.00 mark per barrel on Thursday, an area coincident with the key 200-day SMA.
Indeed, prices of the West Texas Intermediate (WTI) overturned three daily gains in a row and traded on the defensive on Thursday, as traders continued to assess the possibility of Iranian crude oil returning to the market in case of an eventual positive outcome from the Iran-EU-US talks regarding the 2015 Tehran nuclear agreement.
Also weighing on the morale surrounding the commodity, it all points to a hawkish message from Chief Powell at his speech on Friday amidst an equally strong bias towards the continuation of the Fed’s current pace of normalization at the Jackson Hole Symposium, which eventually morphs into rising concerns over the likelihood of a recession and the subsequent impact on the demand for crude oil.
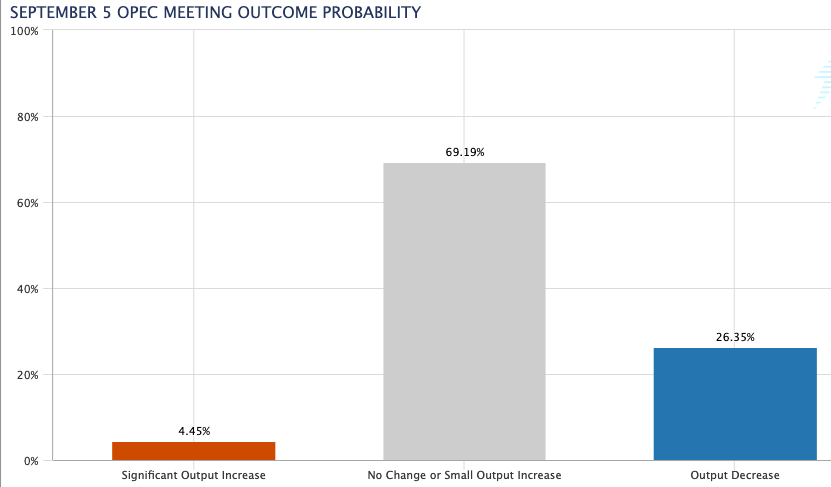
The silver lining, however, comes from OPEC after its President hinted at the likelihood that the cartel is open to cutting oil output. The chances of this scenario at the next meeting appears, so far, reduced, according to CME Group’s OPEC Watch Tool.
Further gains in WTI appear workable in case of a sustained breakout of the 200-day SMA at $95.85, a region where recent highs also converge. North from here lines up
the psychological $100.00 mark ahead of the weekly top at $101.87 (July 29) and another weekly peak at $104.44 (July 19). If bulls push harder, then a probable visit to the July high at $111.42 (July 5) could resurface on the horizon prior to the weekly top at $114.00 (June 29) and the June peak at $123.66 (June 14). Oppositely, the August low at $85.74 (August 16) remains as a decent contention ahead of the 81.94 level (low January 24), which sets the scene for a test of the round level at $80.00 prior to the 2022 low at $74.30 (January 3).
Resistance levels: $95.73 $96.55 $101.87 (4H chart)
Support levels: $92.77 $90.59 $86.26 (4H chart)
DOW JONES
Equities measured by the three major US stock indices added to Wednesday’s gains amidst a weaker dollar, declining US yields and some relief following results from the US docket.
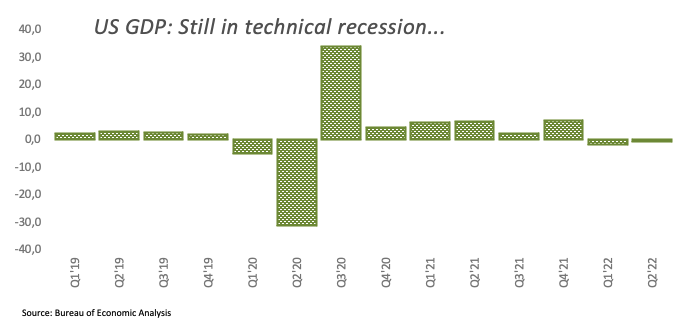
Indeed, recession fears among market participants seem to have mitigated a tad after auspicious data from GDP figures in Germany and the US for the second quarter.
However, cautiousness is set to prevail as the Jackson Hole Symposium kicks in today and Chair Powell will speak on Friday, where the next steps from the Fed regarding the pace of rate hikes will take centre stage.
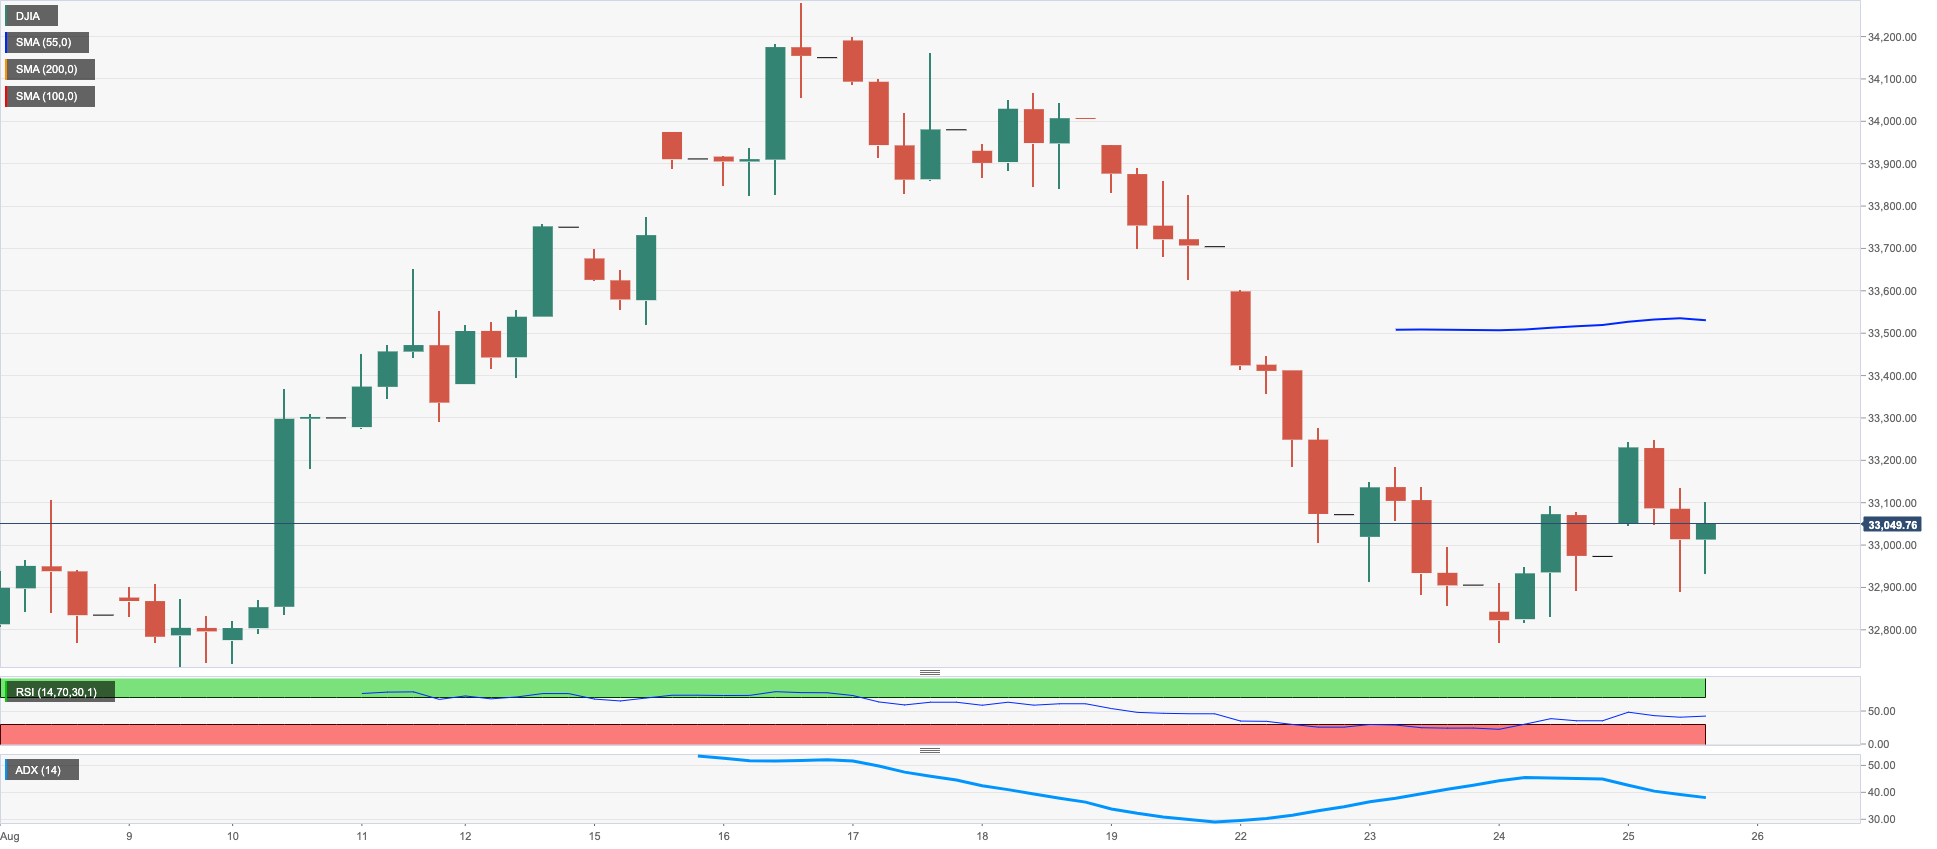
All in all, the Dow Jones rose 0.35% to 33,083, the S&P500 gained 0.76% to 4,172 and the tech reference Nasdaq Composite advanced 1.15% to 12,576.
The weekly low in the Dow Jones at 32,828 (August 24) turns up as a solid support for the time being. The breakdown of this level, however, could accelerate losses to the 100-day SMA at 32,538 prior to the August low at 32,387 (August 2) and the 55-day SMA at 31,951. South from here emerges the weekly low at 31,534 (July 21) ahead of the July low at 30,143 (July 14) and the 2022 low at 29,653 (June 17). On the other hand, the key 200-day SMA at 33,793 comes first prior to the August high at 34,281 (August 16). The surpass of the latter could spark a move to the April top at 35,492 (April 21) before the February peak at 35,824 (February 9). The RSI gathers some steam and approaches 53.
Top Performers: Boeing, Intel, Caterpillar
Worst Performers: Salesforce.com, Procter&Gamble, Merck&Co
Resistance levels: 33,135 34,281 35,492 (4H chart)
Support levels: 32,828 32,534 32,387 (4H chart)
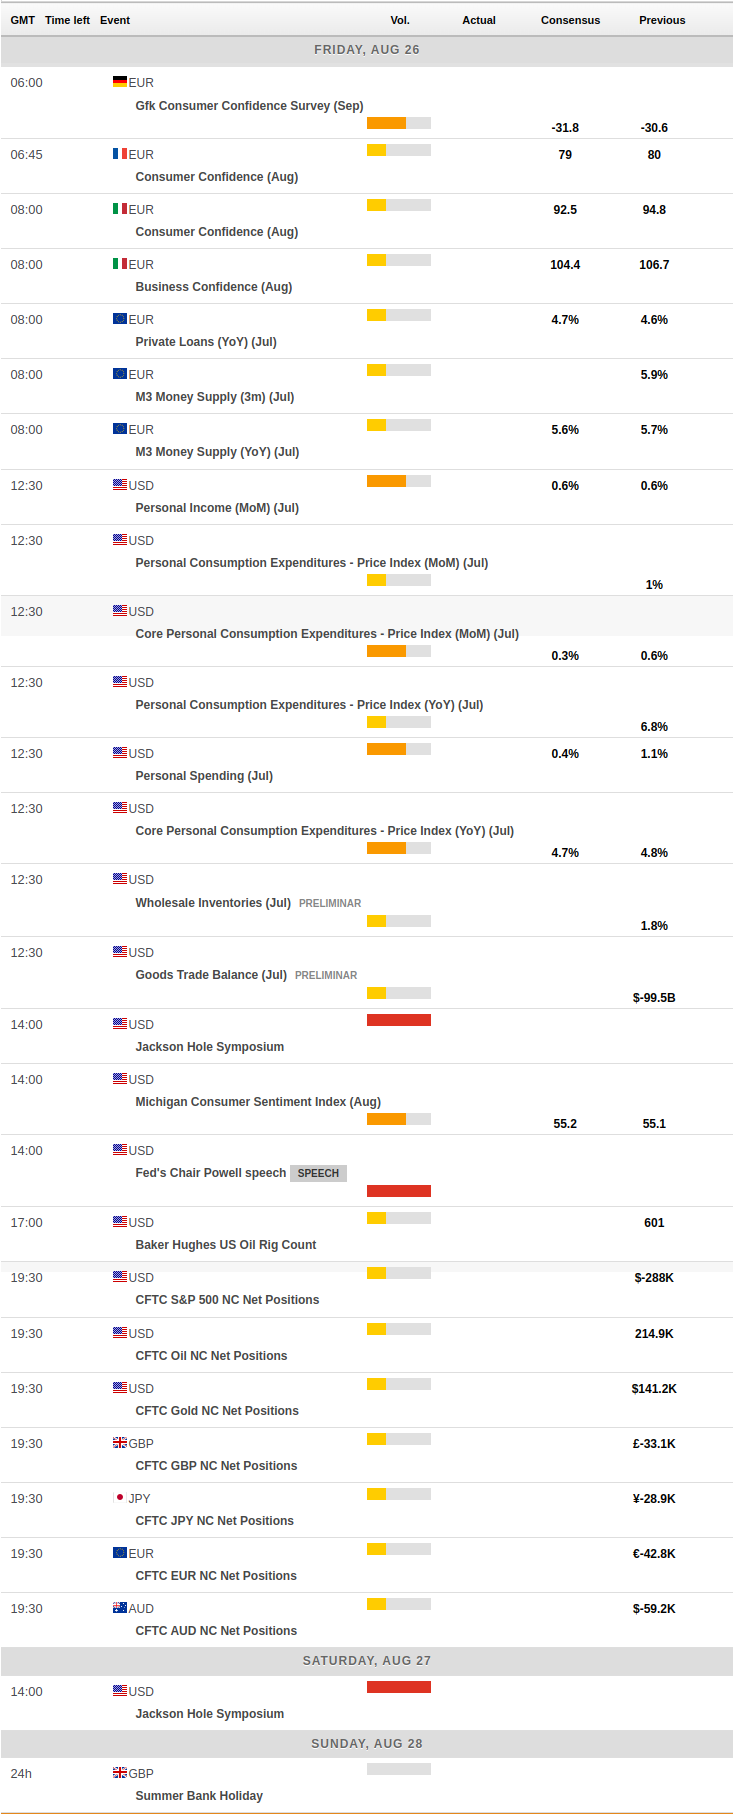
MACROECONOMIC EVENTS
All Information & Updates provided by:

All information relating to the financial markets available on this page has been prepared and issued by FXStreet (Forexstreet SL, Spain, Reg: B62498233) on the basis of publicly available information and all information believed to be reliable and does not conflict with Kuwaiti local laws, and all necessary care has been taken to before the company to ensure that the facts mentioned are correct from the source.
NCM Investment nor any of its directors or employees shall in any way be held responsible for the contents of this news, and the information contained on this page is intended only to provide clients with publicly available information and should not be construed as investment advice, report or analysis and/or constitute an offer or invitation to buy or sell financial instruments of any kind.
RISK WARNING: Forex and CFDs are highly risky leveraged products, as losses can exceed deposits. Please ensure you understand all the risks and take independent advice if necessary. NCM will segregate the clients based on the criteria of the regulator and its bylaws. NCM does not provide any advisory service; the material published does not constitute advice or a recommendation for a transaction in any financial instrument. NCM accepts no responsibility for any use of the content presented and any consequences of that use. Anyone acting on the information provided does so at their own risk.