
- Contact Us:
-

-

-

-


Daily Market Updates
29 Aug 2022
EURUSD
The continuation of the weekly correction in the greenback initially allowed EUR/USD to advance near the 1.0100 region on Friday. However, the change of heart in the dollar following the appearance of Chair Powell at the Jackson Symposium forced the pair to surrender all gains and end the session with modest losses near 0.9960. It is worth noting that EUR/USD could not close at or above the parity level in any of the last five sessions.
Indeed, the appetite for the risk complex gradually dwindled and lost conviction after Powell suggested that lowering inflation will need the policy to remain restrictive for some time, reiterating the Fed’s “unconditional” pledge to return inflation to its 2% goal and that longer-run inflation expectations seem to be well-anchored. Despite Powell welcoming the recent drop in inflation, he stressed that those readings still lack conviction that inflation is effectively falling. He highlighted the strength of the labour market, although he acknowledged that it remains out of balance. Powell reiterated that as monetary conditions continue to tighten, interest rate hikes would need to halt at some point.
The greenback revived after the speech, lifting the US Dollar Index (DXY) from as low as the 107.60 area to close the day below the 109.00 mark, while US yields behaved erratically amidst investors’ preference for a 75 bps rate hike by the Fed at its September event.
Initial buying pressure in the European currency came after sources cited ECB Board members wanting to debate a potential 75 bps hike amidst the deterioration of the inflation outlook.
Data wise in the euro area, Germany Consumer Confidence tracked by GfK worsened to -36.5 in September (from -30.9). In France and Italy, the same gauge improved to 82 and 98.3, respectively, for the month of August.
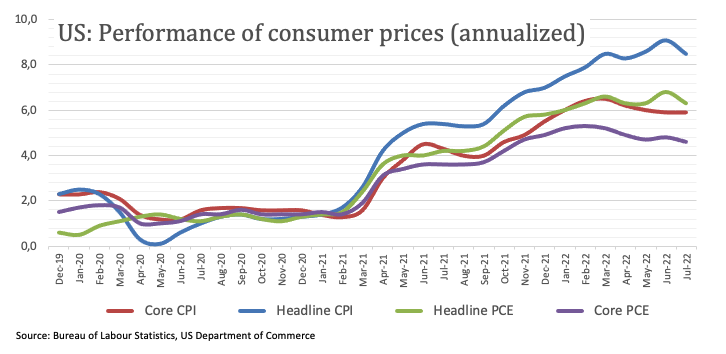
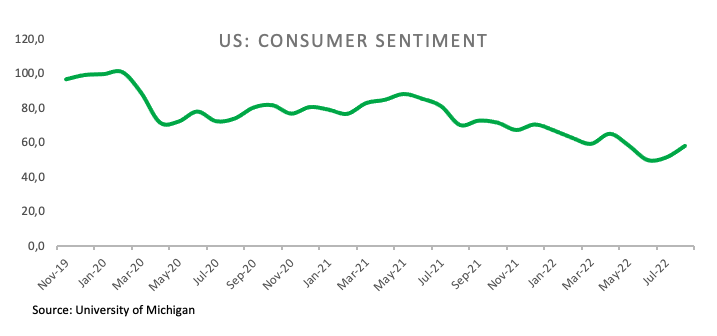
In the US docket, inflation measured by the PCE rose less than expected 6.3% in the year to July and 4.6% when it comes to the Core reading. In addition, Personal Income expanded 0.2% MoM in July and Personal Spending increased 0.1% vs. the previous month. Lastly, final figures from the University of Michigan saw the Consumer Sentiment improve to 58.2 in August.
Further gains in EUR/USD now need to surpass the weekly high at 1.0089 (August 26) to allow for a potential test of the 1.0202 level (August 17 peak). Further north from here appears the interim 55-day SMA at 1.0247 seconded by the August high at 1.0368 (August 10) and the 100-day SMA at 1.0429. The breakout of the latter could pave the way for a move to the weekly top at 1.0615 (June 27). On the other hand, there is initial support at the 2022 low at 0.9899 (August 23) ahead of the December 2002 low at 0.9859. South from this level, the next contention should turn up at the October 2002 low at 0.9685 (October 21) before the September 2002 low at 0.9608 (September 17). The daily RSI looks stable below 35.
Resistance levels: 1.0089 1.0148 1.0202 (4H chart)
Support levels: 0.9946 0.9899 0.9859 (4H chart)
-637972833860944240.png)
USDJPY
USD/JPY rapidly eroded a drop to 2-day lows in the 136.20 region and managed to grab fresh oxygen pari passu with the strong recovery in the greenback, particularly exacerbated following Powell’s comments in Jackson Hole.
Therefore, the pair advanced more than a big figure and reclaimed the area well beyond the 137.00 hurdle also helped by the mixed tone in US yields, where the short end of the curve was the outperformer.
In the meantime, spot ended the second consecutive week with gains, always sustained by the monthly strong rebound in US yields.
Next on tap in the Japanese calendar will be Monday’s publication of the final figures of the Coincident Index and the Leading Economic Index, both for the month of June.
USD/JPY still faces the initial up barrier at the August top at 137.70 (August 23) ahead of the round level at 138.00 and the post-BoJ peak at 138.87 (July 21). If the pair clears this level, it could then motivate the 2022 high at 139.38 (July 13) to re-emerge on the horizon seconded by the round level at 140.00. In the opposite direction, the weekly low at 135.80 is expected to hold the initial test ahead of the 55-day SMA at 135.59. Further weakness should meet the 100-day SMA at 132.61 before the weekly low at 131.73 (August 11) and the August low at 130.39 (August 2), all ahead of the psychological 130.00 mark. The daily RSI edges higher and flirts with 60.
Resistance levels: 137.53 137.70 137.97 (4H chart)
Support levels: 136.20 135.80 134.64 (4H chart)
-637972843361204297.png)
GBPUSD
After climbing to new weekly tops in the 1.1900 region, GBP/USD triggered a strong corrective move that not only reversed all those initial gains, but it also broke decisively below the 1.1800 support, all in the wake of the speech by Fed’s Powell at the Jackson Hole event on Friday.
The abrupt U-turn in cable came in response to the equally strong move – albeit in the opposite direction – in the greenback, which encouraged the US Dollar Index (DXY) to rebound from the vicinity of 107.60 to levels below 109.00 the figure.
In the UK cash markets, the 10y Gilt yields remained indecisive around the 2.60% region, down from multi-week peaks around 2.70% recorded earlier in the week.
The UK calendar was empty of data releases at the end of the week.
Bullish attempts in GBP/USD appear to lack conviction for the time being. Against that, the breakdown of the 2022 low at 1.1716 (August 23) could open the door to a potential pullback to the 2020 low at 1.1409 (March 20). Contrarily, the surpass of the weekly top at 1.1900 (August 26) should expose the interim 55-day SMA at 1.2059 prior to the August peak at 1.2293 (August 1) and the 100-day SMA at 1.2302. Beyond the latter comes the weekly high at 1.2405 (June 16) before the 1.2666 level (May 27 high), which remains the last defense for a move to the psychological 1.3000 yardstick. The daily RSI eases a tad to the sub-34 area.
Resistance levels: 1.1900 1.2016 1.2079 (4H chart)
Support levels: 1.1775 1.1755 1.1716 (4H chart)
-637972834856380900.png)
AUDUSD
In line with the rest of the risk-associated universe, increasing optimism in the first half of the trading session lifted AUD/USD back above the key 0.7000 hurdle, although the violent reversion in the greenback forced the pair to later surrender that advance and drop well into the negative territory, ending the week below the 0.6900 yardstick.
In addition, the mixed note in the commodity galaxy did nothing to curb the intense retracement in the pair, with copper shedding ground marginally and iron ore up slightly for the session.
Friday’s empty docket in Australia left all the attention to July’s Retail Sales due on Monday.
In case AUD/USD sees its downside accelerated, it could then revisit the August low at 0.6856 (August 23) ahead of the 2022 low at 0.6681 (July 14). A drop below the latter could introduce a probable decline to the May 2020 low at 0.6372 (May 4) ahead of the weekly low at 0.6253 (April 21 2020). On the flip side, a more serious bounce should clear the weekly high at 0.7008 (August 26) to then allow for a move to the 100-day SMA at 0.7024 before the August top at 0.7136 (August 11). The latter remains so far bolstered by the 200-day SMA, today at 0.7130 and the breakout of this region is expected to put the June peak at 0.7282 (June 3) back on the radar prior to the weekly high at 0.7458 (April 21). The daily RSI loses traction and breaches 46.
Resistance levels: 0.7008 0.7040 0.7136 (4H chart)
Support levels: 0.6913 0.6856 0.6802 (4H chart)
-637972836452966655.png)
GOLD
Gold prices overturned three consecutive sessions with gains and dropped to new 3-day lows near $1,730 per ounce troy at the end of the week.
The unsurprising hawkish tone from Fed’s Powell at the Jackson Hole Symposium in combination with the rebound in the greenback and the positive reaction in the short end of the US yield curve appear to have been enough to spark a corrective move in the yellow metal on Friday, which also closed the second consecutive week with losses.
Also weighing on bullion seemed to be the lower-than-expected US inflation readings tracked by the PCE for the month of July.
So, next on the downside for gold appears the August low at $1,727 (August 22) before the weekly low at $1,711 (July 27) and the round level at $1,700. The loss of this region could open the door to a probable visit to the 2022 low at $1,680 (July 21), just ahead of the 2021 low at $1,1676 (March 8) and the June 2020 low at $1,670 (June 5). Inversely, a move above the weekly high at $1,765 (August 25) could habilitate a test of the 55-day SMA at $1,771 ahead of the August top at $1,807 (August 10). Once cleared, the 100- and 200-day SMAs at $1,820 and $1,8937, respectively, could return to the traders’ radar prior to the June peak at $1,879 (June 13) and the April high at $1,998 (April 19).
Resistance levels: $1,765 $1,772 $1,782 (4H chart)
Support levels: $1,734 $1,727 $1,711 (4H chart)
-637972839845259982.png)
CRUDE WTI
Prices of the WTI remained on the defensive in the second half of the week, adding to Thursday’s losses and briefly retesting the $91.00 mark per barrel on Friday.
Fed Powell’s speech came on the hawkish side as predicted, highlighting the central bank’s commitment to tackle inflation and opening the door to a “restrictive for longer” stance in the monetary conditions, which reinforced the view of an incipient recession and the subsequent impact on the demand for crude oil.
Those same worries were also magnified after ECB’s rate-setters hinted at the possibility of a 75 bps rate hike at next month’s event amidst the worsening inflation outlook in the old continent.
However, and somehow mitigating the decline in the commodity, traders continued to assess the likelihood that the OPEC+ could impose output cuts in case Iran and Western powers revive the 2015 Tehran nuclear deal, which could pump around 1 mbpd of Iranian crude into the market.
Closing the weekly docket, driller Baker Hughes reported an increase of 4 US oil rig count in the week to August 26, taking the total US active oil rigs to 605.
The next hurdle of note for WTI bulls remains unchanged at the 200-day SMA at $95.92, an area coincident with the August high, and ahead of the psychological $100.00 mark. Further up aligns the weekly peak at $101.87 (July 29) seconded by another weekly high at $104.44 (July 19). North from here emerges the July top at $111.42 (July 5) before the weekly peak at $114.00 (June 29) and the June high at $123.66 (June 14). If losses gather steam, then a probable test of the August low at $85.74 (August 16) could start shaping up prior to the 81.94 level (low January 24). The breach of this area leaves the commodity vulnerable to a deeper drop to the round level at $80.00 ahead of the 2022 low at $74.30 (January 3).
Resistance levels: $93.82 $95.73 $96.55 (4H chart)
Support levels: $91.08 $90.59 $86.26 (4H chart)
-637972841584400570.png)
DOW JONES
Equities tracked by the Dow Jones plummeted to levels last seen back in late July on Friday, all in response to the hawkish message from Chief Powell in Jackson Hole and the firm conviction among policymakers to bring inflation down.
The abrupt rebound in the US dollar and the positive session in yields in the short end of the curve also weighed on investors’ sentiment, reinforcing the view that the Fed is still quite far away from slowing the pace of its normalization process.
On this, CME Group’s FedWatch Tool now sees the probability of a large raise at around 61% vs. nearly 40% when it comes to a half-point hike.
-637972846552676778.png)
Also collaborating with the sell-off in stocks re-emerged recession fears, which now point to an economic slowdown in 2023.
That said, the Dow Jones dropped 3.03% to 32,283, the S&P500 lost 3.37% to 4,057 and the tech-heavy Nasdaq Composite retreated 3.94% to 12,141.
The multi-week low in the Dow Jones at 32,278 (August 26) now emerges as the initial barrier for bears ahead of the 55-day SMA at 31,944. Down from here comes the weekly low at 31,534 (July 21) prior to the July low at 30,143 (July 14) and the 2022 low at 29,653 (June 17). Conversely, bullish attempts need to clear the key 200-day SMA at 33,774 to allow for gains to challenge the August top at 34,281 (August 16). The continuation of the advance could see the April peak at 35,492 (April 21) revisited prior to the February high at 35,824 (February 9). The RSI drops markedly to the proximity of 42.
Top Performers: Chevron, Merck&Co, Verizon
Worst Performers: 3M, Salesforce.com, Intel
Resistance levels: 33,364 34,281 35,492 (4H chart)
Support levels: 32,278 32,027 31,705 (4H chart)
-637972842231469283.png)
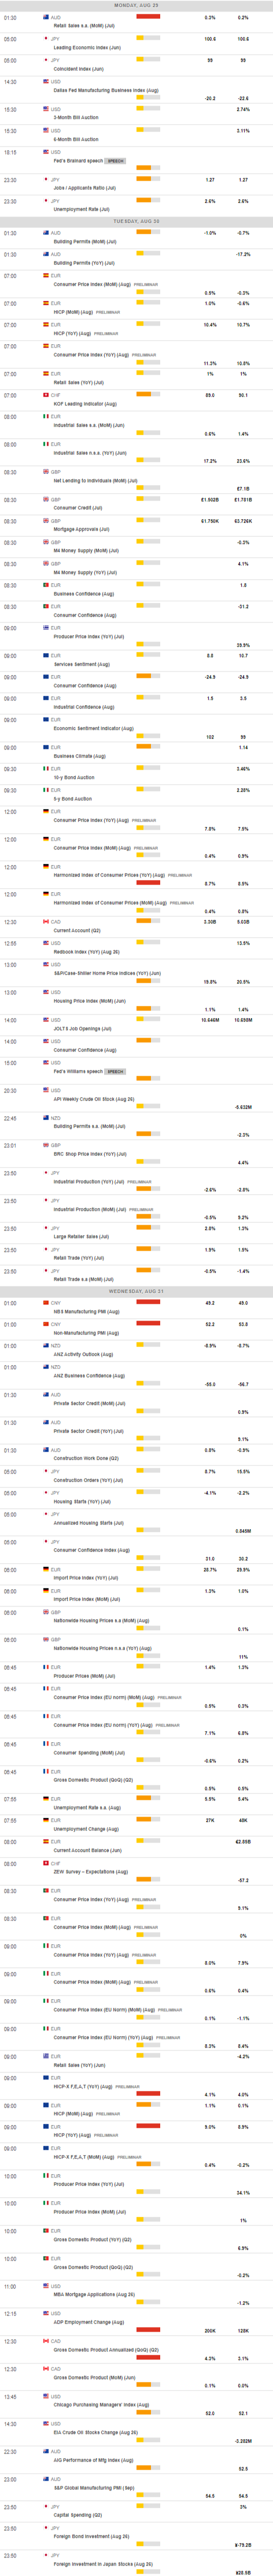
MACROECONOMIC EVENTS
All Information & Updates provided by:

All information relating to the financial markets available on this page has been prepared and issued by FXStreet (Forexstreet SL, Spain, Reg: B62498233) on the basis of publicly available information and all information believed to be reliable and does not conflict with Kuwaiti local laws, and all necessary care has been taken to before the company to ensure that the facts mentioned are correct from the source.
NCM Investment nor any of its directors or employees shall in any way be held responsible for the contents of this news, and the information contained on this page is intended only to provide clients with publicly available information and should not be construed as investment advice, report or analysis and/or constitute an offer or invitation to buy or sell financial instruments of any kind.
RISK WARNING: Forex and CFDs are highly risky leveraged products, as losses can exceed deposits. Please ensure you understand all the risks and take independent advice if necessary. NCM will segregate the clients based on the criteria of the regulator and its bylaws. NCM does not provide any advisory service; the material published does not constitute advice or a recommendation for a transaction in any financial instrument. NCM accepts no responsibility for any use of the content presented and any consequences of that use. Anyone acting on the information provided does so at their own risk.