
- Contact Us:
-

-

-

-


Daily Market Updates
30 Aug 2022
EURUSD
After bottoming out in the proximity of the 0.9900 neighbourhood early on Monday, EUR/USD managed to regain poise and advanced beyond the parity level against the backdrop of the persistent loss of momentum in the dollar.
More on this, the greenback printed new highs in levels last seen nearly 20 years ago around 109.50 when gauged by the US Dollar Index (DXY). However, the upside lacked follow through and sparked a corrective decline to the sub-109.00 region, where some initial support emerged.
The earlier move higher in DXY was accompanied by the investors’ adjustment to the hawkish tilt at Powell’s speech in Jackson Hole at the end of last week, where he made it clear that the Fed is ready to see some deterioration in the labour market and the growth outlook amidst its battle to bring down inflation to the Fed’s 2% target.
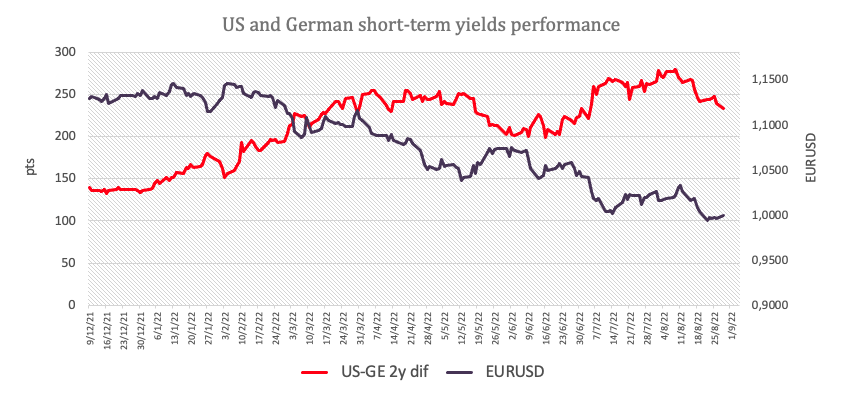
The initial uptick in the dollar came in tandem with rising US yields, particularly in the short end of the curve, where the 2y reached new 5-year tops near 3.50%, bolstering at the same time the extra inversion of the yield curve.
No data in Euroland left the Dallas Fed Manufacturing Index at -12.9 as the sole release across the pond.
Next on the upside in EUR/USD aligns the weekly top at 1.0089 (August 26) prior to the 1.0202 level (peak August 17). The breakout of this level could open the door to the temporary 55-day SMA at 1.0238 ahead of the August high at 1.0368 (August 10) and the 100-day SMA at 1.0419. Further north appears the weekly top at 1.0615 (June 27). On the flip side, the 2022 low at 0.9899 (August 23) is predicted to offer decent contention before the December 2002 low at 0.9859 and the October 2002 low at 0.9685 (October 21). The daily RSI improves slightly above 38.
Resistance levels: 1.0029 1.0090 1.0145 (4H chart)
Support levels: 0.9914 0.9899 0.9859 (4H chart)
-637973984655349663.png)
USDJPY
USD/JPY rose to fresh multi-week highs and briefly revisited the 139.00 barrier at the beginning of the week.
Indeed, the initial sharp uptick in US yields propelled spot back to the 139.00 neighbourhood, as Asian investors were digesting the hawkish tilt at Powell’s speech last Friday.
Despite the greenback making a U-turn and surrendering the earlier move to new cycle highs around 109.50 when measured by the US Dollar Index (DXY), the firm note in US yields continued to prop up the pair amidst a solid perspective of further tightening by the Fed in the next months.
In Japan, final readings saw the Coincident Index at 98.6 and the Leading Economic Index at 100.9 for the month of June.
If bulls remain in charge and clear the August high at 139.00 (August 29), USD/JPY should now attempt a visit to the 2022 high at 139.38 (July 13) prior to the round level at 140.00. Conversely, the weekly low at 135.80 now appears underpinned by the 55-day SMA at 135.66, all ahead of the 100-day SMA at 132.75. Down from here turns up the weekly low at 131.73 (August 11) seconded by the August low at 130.39 (August 2). If breached, then a potential visit to the psychological 130.00 yardstick could return to the investors’ radar. The daily RSI pushes higher and trespasses 64.
Resistance levels: 139.00 139.22 139.38 (4H chart)
Support levels: 136.19 135.80 134.64 (4H chart)
-637973985538090247.png)
GBPUSD
GBP/USD traded on the defensive in the low-1.1700s despite the soft performance in the greenback. Cable, in the meantime, managed to at least bounce off earlier new 2022 lows near 1.1650, an area last seen in March 2020, the onset of the coronavirus pandemic.
Indeed, cable initially extended further the monthly leg lower, although the later loss of upside traction in the greenback allowed spot to reclaim ground lost and retake the 1.1700 mark and above on Monday.
In the UK money markets, the 10y Gilt yields traded within a very tight range following the UK Summer Bank Holiday.
Next on tap in the UK calendar will be Tuesday’s Mortgage Approvals/Lending figures for the month of July.
Further losses in GBP/USD now need to clear the 2022 low at 1.1648 (August 29) ahead of a probable retracement to the 2020 low at 1.1409 (March 20). On the contrary, bulls initially target the weekly peak at 1.1900 (August 26) prior to the temporary 55-day SMA at 1.2050 and the August high at 1.2293 (August 1). Further north appears the 100-day SMA at 1.2288 ahead of the weekly top at 1.2405 (June 16) and the 1.2666 level (May 27 peak), which precedes the psychological 1.3000 mark. The daily RSI deflates further and approaches 32.
Resistance levels: 1.1734 1.1900 1.2016 (4H chart)
Support levels: 1.1648 1.1638 1.1445 (4H chart)
-637973985115452061.png)
AUDUSD
AUD/USD back-pedaled the initial drop to multi-week lows around 0.6840 and regained the 0.6900 barrier and beyond on the back of the equally strong change of direction in the greenback.
Indeed, the move lower in the buck lent extra legs to the Aussie dollar and sponsored the bounce in the pair to the 0.6900 neighbourhood once again, although the soft performance in the commodity universe somewhat limited the upside in spot.
The recovery in AUD came in tandem with an uptick in the 10y AGB yields to past 3.70% following two daily drops in a row.
Data wise Down Under, preliminary figures see Retail Sales expanding 1.3% MoM during July.
The weekly top at 0.7008 (August 26) now emerges as the initial hurdle in case AUD/USD gathers extra steam in the near term. If the pair break above this level it could then dispute the 100-day SMA at 0.7019 ahead of the August peak at 0.7136 (August 11). The 200-day SMA at 0.7128 also reinforces the latter, while a breach of this region could prompt the June high at 0.7282 (June 3) to re-emerge on the horizon before the weekly top at 0.7458 (April 21). On the downside, the August low at 0.6840 (August 29) should offer initial contention ahead of the 2022 low at 0.6681 (July 14). Extra weakness could see the May 2020 low at 0.6372 (May 4) revisited prior to the weekly low at 0.6253 (April 21 2020). The daily RSI regains poise and trades close to 47.
Resistance levels: 0.6925 0.6937 0.7008 (4H chart)
Support levels: 0.6840 0.6802 0.6718 (4H chart)
-637973986372971199.png)
GOLD
Prices of the ounce troy of gold managed to get some fresh air following the earlier 5-week low around $1,720, ending Monday’s session around the previous day’s close.
The firm note in the greenback initially dragged bullion to fresh multi-week lows, although the lack of follow through in the dollar’s upside after the opening bell in the old continent allowed the precious metal some breathing space.
However, the Fed’s tightening prospects remained well in place and kept yields in the belly and the long end of the curve bid, limiting at the same time some recovery potential in the non-yielding metal.
Extra rebound in gold is expected to meet the initial hurdle at the weekly top at $1,765 (August 25) just ahead of the 55-day SMA at $1,770. Once cleared, the August peak at $1,807 (August 10) could return to the traders’ radar prior to the 100- and 200-day SMAs at $1,818 and $1,837, respectively. North from here turns up the June high at $1,879 (June 13) seconded by the April top at $1,998 (April 19). In the opposite direction, the August low at $1,720 (August 29) stands as the initial defense against any bearish assaults prior to the weekly low at $1,711 (July 27) and the round level at $1,700. A drop below the latter could pave the way for a new visit to the 2022 low at $1,680 (July 21) before the 2021 low at $1,1676 (March 8) and the June 2020 low at $1,670 (June 5).
Resistance levels: $1,745 $1,750 $1,765 (4H chart)
Support levels: $1,720 $1,711 $1,680 (4H chart)
-637973986753193672.png)
CRUDE WTI
WTI prices rose to 4-week highs past the $97.00 mark per barrel at the beginning of the week, quickly leaving behind two consecutive sessions with losses and entering the second week in a row in the positive territory.
The marked recovery in crude oil prices followed the deteriorated scenario in Libya as well as further speculation that the OPEC+ could reduce the oil output in response to an eventual Iran-US deal that could well see around 1 mbpd of Iranian oil returning to the markets.
Monday’s positive performance of the WTI was also reinforced by the renewed weakness in the greenback and somehow offset the pick-up in recession talks, particularly following the hawkish message from Chair Powell on Friday.
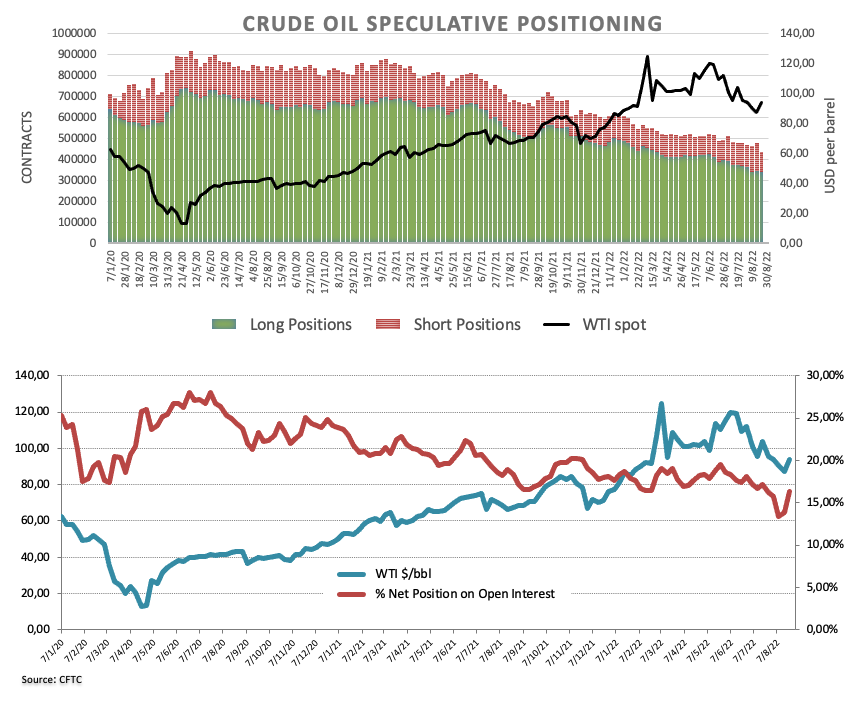
On another front, speculators increased their net long exposure to crude oil to 3-week highs in the week to August 23, as per the latest CFTC Positioning Report. The weekly uptick in prices was against shrinking open interest however, pouring some cold water over potential extra gains in the short-term horizon.
Further upside in WTI now targets the 55-day SMA at $99.09 just ahead of the psychological $100.00 mark and closely followed by the weekly high at $101.87 (July 29). The breakout of the latter could motivate the commodity to challenge another weekly top at $104.44 (July 19) prior to the July peak at $111.42 (July 5). North from here comes the weekly high at $114.00 (June 29) seconded by the June top at $123.66 (June 14). Contrastingly, bears could attempt to drag prices to the August low at $85.74 (August 16) ahead of the 81.94 level (low January 24). A deeper retracement could see the round level at $80.00 revisited prior to the 2022 low at $74.30 (January 3).
Resistance levels: $97.11 $101.87 $104.44 (4H chart)
Support levels: $93.77 $91.08 $90.59 (4H chart)
-637973987634789631.png)
DOW JONES
US equities added to Friday’s sell-off and remained on the back foot at the beginning of the new trading week, as investors remained concerned over the Fed’s prospects for further tightening.
Indeed, the above was once again underpinned by Powell’s speech at the Jackson Hole Symposium, and it has also somewhat bolstered market chatter regarding the likelihood of the US economy entering recession.
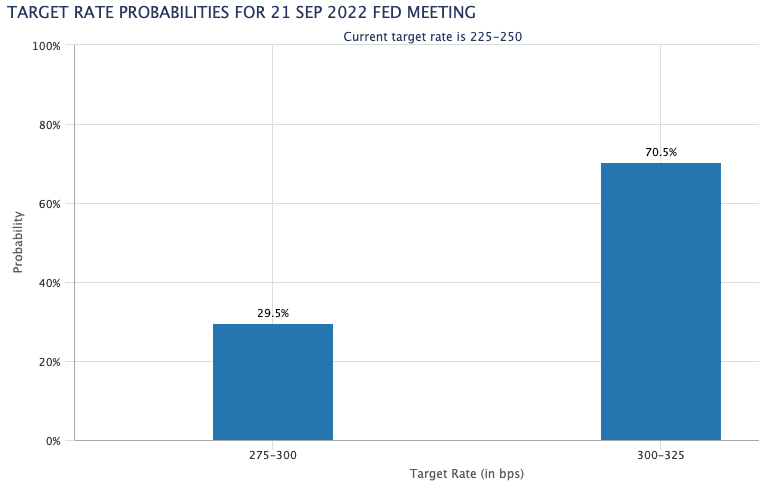
Speaking about rate hikes, CME Group’s FedWatch Tool now sees the probability of a 75 bps raise at around 70% in September.
All in all, the Dow Jones shed 0.12% to 32,240, the S&P500 retreated 0.21% to 4,049 and the tech reference Nasdaq Composite dropped 0.35% to 12,098.
Dow Jones recorded a new August low at 31,972 (August 29), an area also coincident with the 55-day SMA. A deeper pullback could pave the way for a test of the weekly low at 31,534 (July 21) ahead of the July low at 30,143 (July 14) and the 2022 low at 29,653 (June 17). In another way, there is a minor hurdle at 33,364 (high August 26) ahead of the key 200-day SMA at 33,755. Further gains could see the August peak at 34,281 (August 16) revisited prior to the April high at 35,492 (April 21) and the February top at 35,824 (February 9). The RSI eases to the 41 area.
Top Performers: Chevron, Boeing, Walmart
Worst Performers: Salesforce.com, 3M, Dow
Resistance levels: 33,364 34,281 35,492 (4H chart)
Support levels: 31,972 31,705 31,534 (4H chart)
-637973988104143788.png)
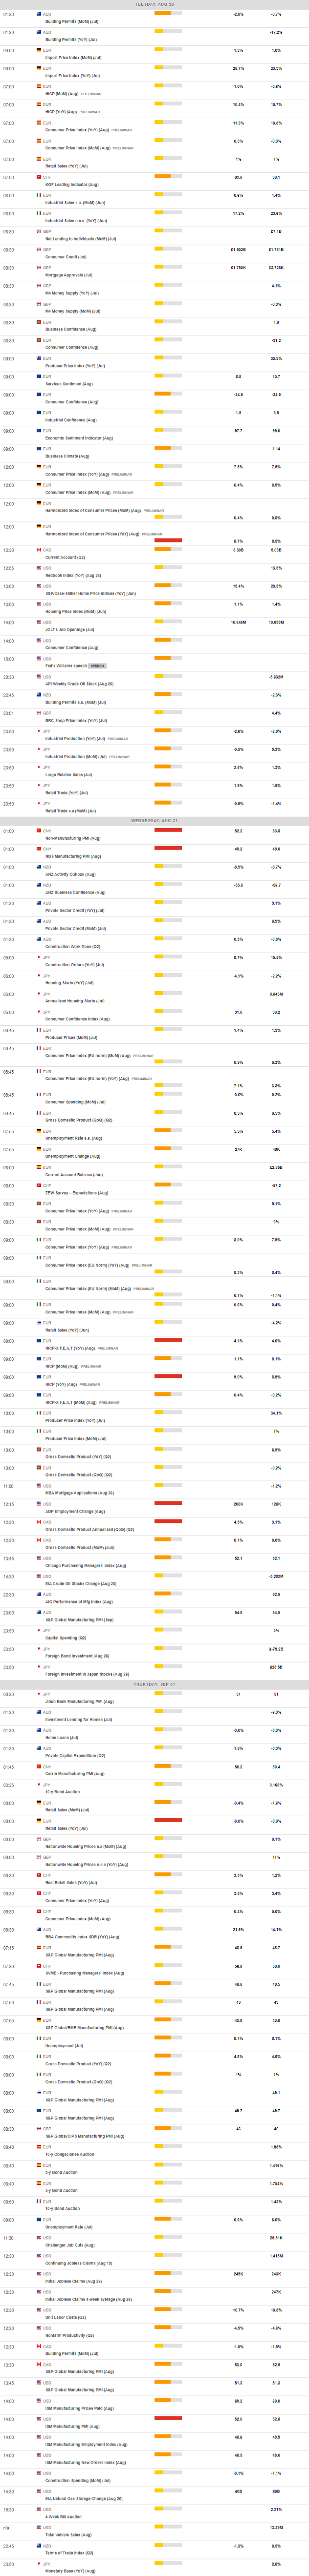
MACROECONOMIC EVENTS
All Information & Updates provided by:

All information relating to the financial markets available on this page has been prepared and issued by FXStreet (Forexstreet SL, Spain, Reg: B62498233) on the basis of publicly available information and all information believed to be reliable and does not conflict with Kuwaiti local laws, and all necessary care has been taken to before the company to ensure that the facts mentioned are correct from the source.
NCM Investment nor any of its directors or employees shall in any way be held responsible for the contents of this news, and the information contained on this page is intended only to provide clients with publicly available information and should not be construed as investment advice, report or analysis and/or constitute an offer or invitation to buy or sell financial instruments of any kind.
RISK WARNING: Forex and CFDs are highly risky leveraged products, as losses can exceed deposits. Please ensure you understand all the risks and take independent advice if necessary. NCM will segregate the clients based on the criteria of the regulator and its bylaws. NCM does not provide any advisory service; the material published does not constitute advice or a recommendation for a transaction in any financial instrument. NCM accepts no responsibility for any use of the content presented and any consequences of that use. Anyone acting on the information provided does so at their own risk.