
- Contact Us:
-

-

-

-


Daily Market Updates
31 Aug 2022
EURUSD
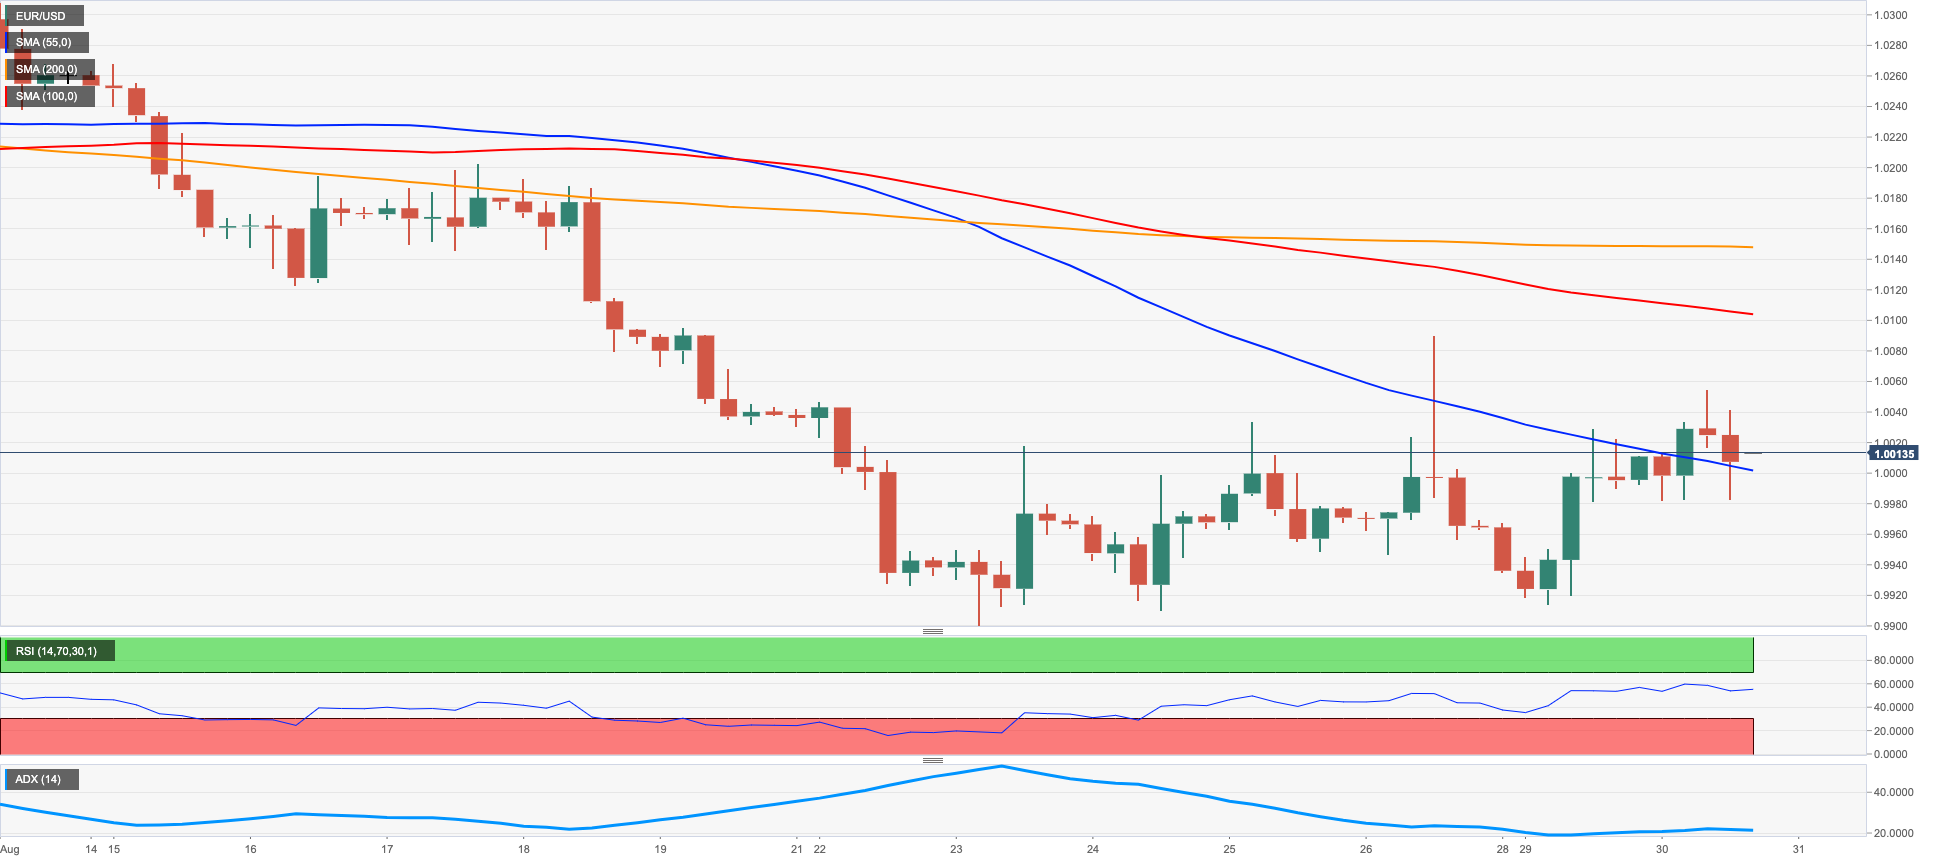
EUR/USD added to gains recorded at the beginning of the week and pushed further north of the key parity level on Tuesday, always on the back of some exhaustion in the recent move higher in the greenback.
Indeed, the buck shed extra ground although it managed to gyrate around the previous day’s close, as investors seem to have fully digested the hawkish message from Chair Powell in Jackson Hole on Friday, while a 75 bps interest rate hike at the Fed’s September event looked further priced in.
US money markets showed yields up in the short end and the belly of the curve, while the German 10y Bund yields appeared to have taken a breather from the recent upside.
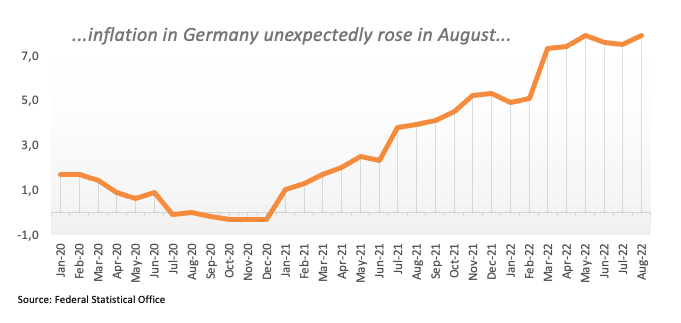
In the euro calendar, final figures saw the EMU Consumer Confidence at -24.9 and the Economic Sentiment at 97.6 for the month of August. In addition, advanced figures now see inflation in Germany rising 7.9% in the year to August and 0.3% from a month earlier.
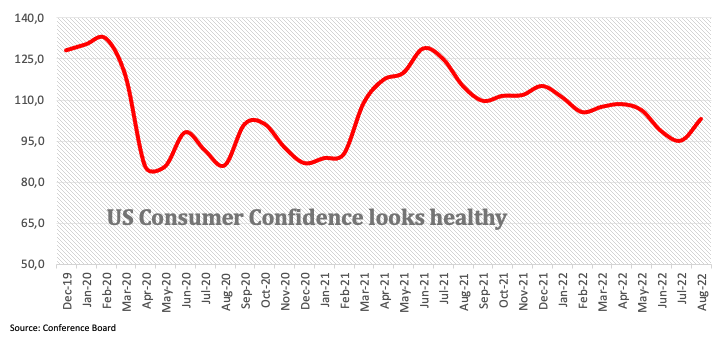
In the US, the Conference Board’s Consumer Confidence improved to 103.2 for the current month and the House Price Index tracked by the FHFA rose 0.1% MoM in June.
Further up in EUR/USD comes the weekly peak at 1.0089 (August 26) ahead of the 1.0202 level (August 17 high). If bulls push harder, then the interim 55-day SMA at 1.0231 should emerge on the horizon before the August top at 1.0368 (August 10) and the 100-day SMA at 1.0411. The breakout of this level exposes a probable move to the weekly peak at 1.0615 (June 27). On the other hand, there is solid contention at the 2022 low at 0.9899 (August 23) prior to the December 2002 low at 0.9859 and the October 2002 low at 0.9685 (October 21). The daily RSI extends the upside to the boundaries of 41.
Resistance levels: 1.0054 1.0090 1.0145 (4H chart)
Support levels: 0.9980 0.9914 0.9899 (4H chart)
USDJPY
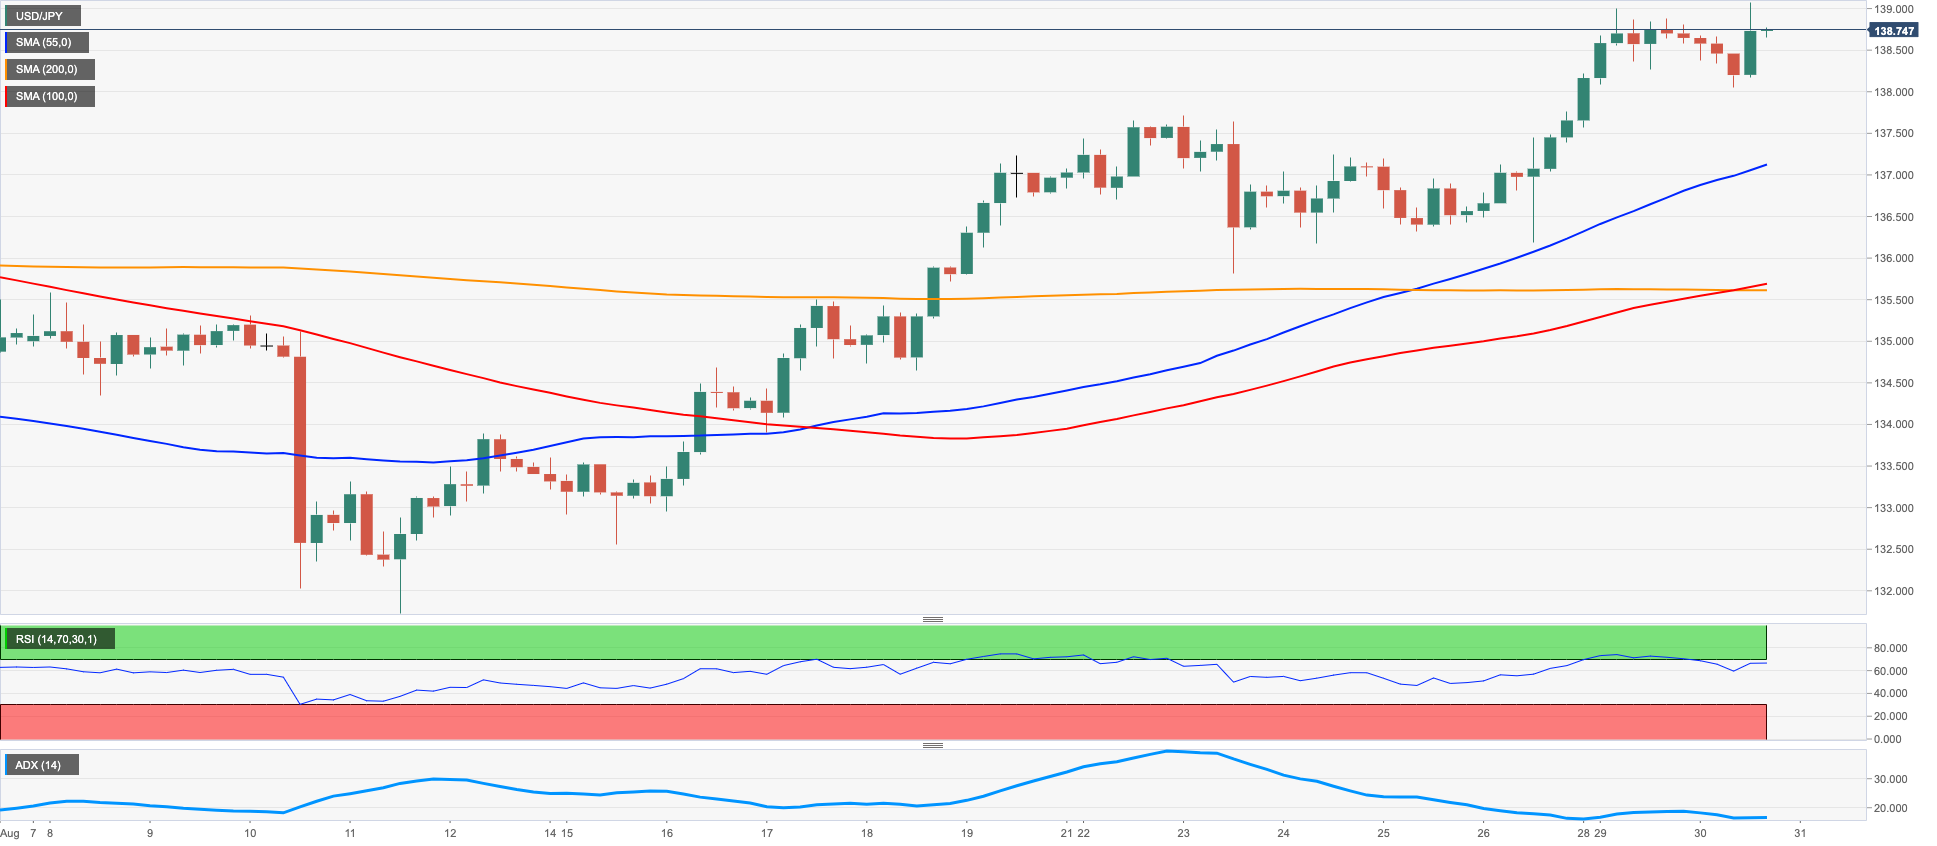
USD/JPY extended the rebound for the third straight session on Tuesday, this time revisiting the 139.00 neighbourhood, or new 7-week highs, just to recede soon afterwards and advance marginally for the day.
The inconclusive session in the greenback in combination with further gains in US yields in the 2y-10y segment seem to have been enough to support the pair on Tuesday.
Indeed, while US yields in the lower end of the curve reached new highs just below 3.50%, the belly rose modestly vs. a slight drop in the long end.
In Japan, the Unemployment Rate stayed unchanged at 2.6% in July, matching consensus.
Extra gains in USD/JPY are now predicted to confront the 2022 top at 139.38 (July 13) ahead of the round level at 140.00. On the flip side, there is initial contention at the weekly low at 135.80, which remains propped up by the 55-day SMA at 135.73. South from here comes the 100-day SMA at 132.88 prior to the weekly low at 131.73 (August 11) and the August low at 130.39 (August 2). A drop below this level should lead up to a probable visit to the psychological 130.00 mark. The daily RSI advances further and navigates closer to 65.
Resistance levels: 139.06 139.22 139.38 (4H chart)
Support levels: 136.19 135.71 134.64 (4H chart)
GBPUSD
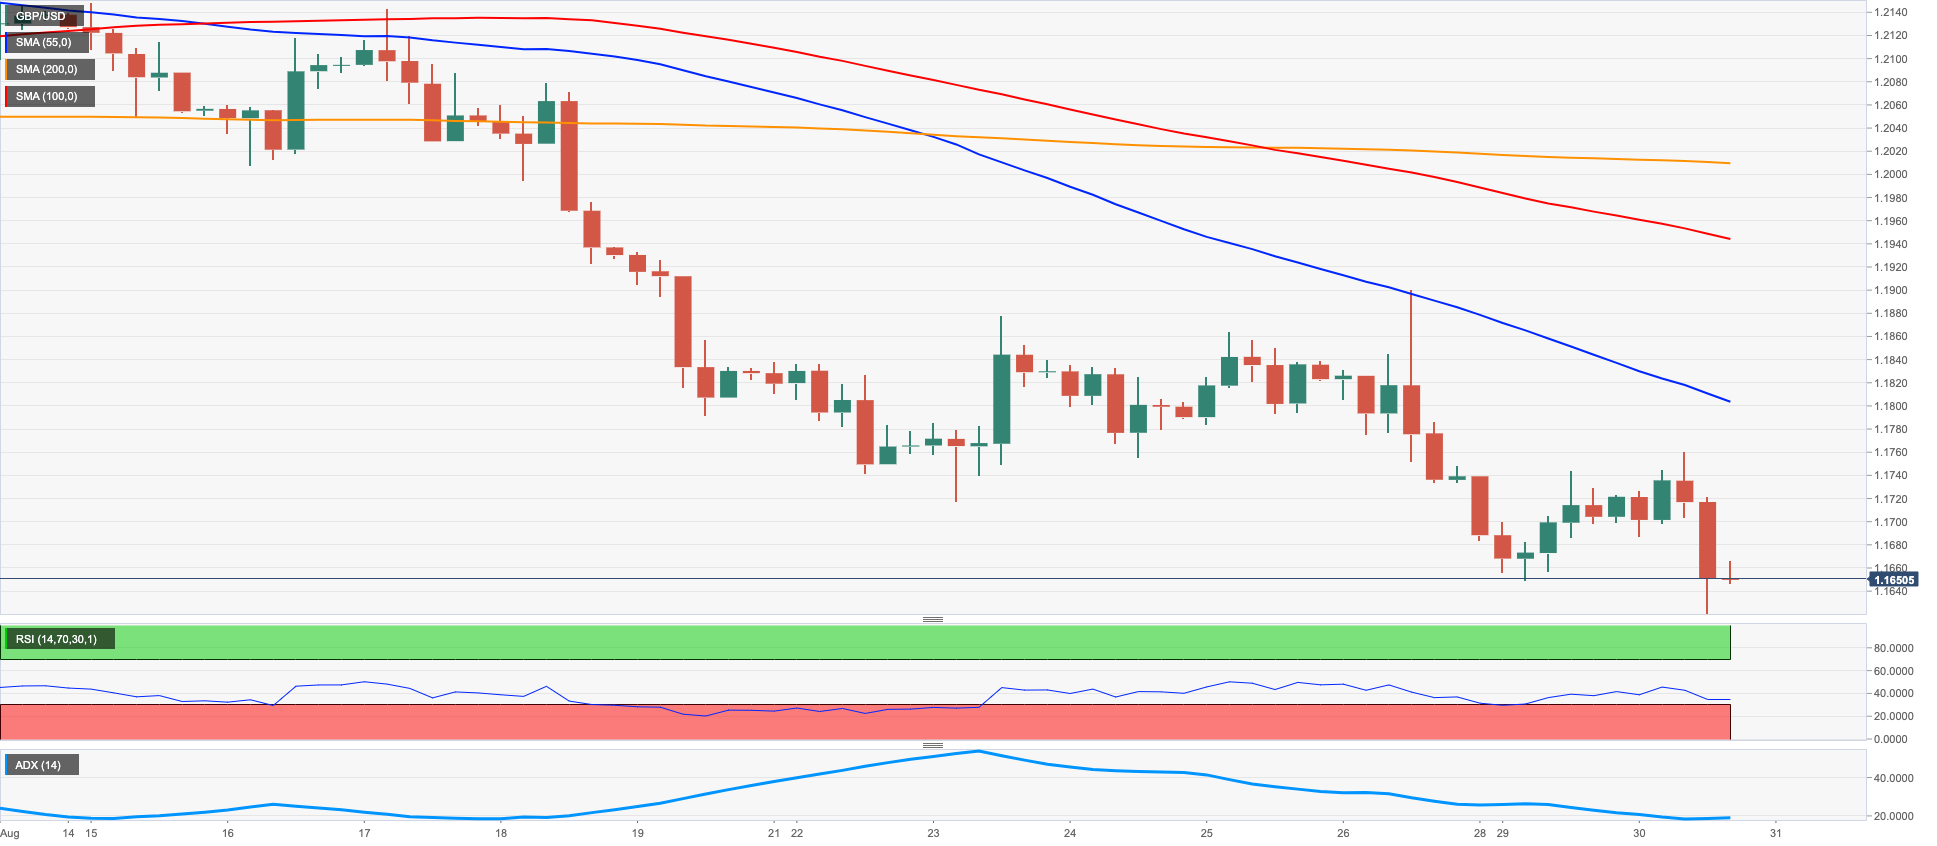
The British pound maintained the sour and prompted GBP/USD to lose ground for the third session in a row despite the renewed weakness around the US dollar on turnaround Tuesday.
Indeed, price action around the quid remained depressed and forced cable to record a new YTD low near 1.1620. It is worth noting that cable navigates the third consecutive week/month with losses and returns to levels last seen back in March 2020.
A totally different scenario arose in the UK money market, where the 10y Gilt yields extended the uptrend near 2.80% for the first time since December 2013.
In the UK docket, Mortgage Approvals increased to 63.77K in July and Mortgage Lending eased a tad to £5.051B in the same period.
The persistent weakness around GBP/USD exposes another visit to the 2022 low at 1.1621 (August 30), while the loss of this level should not meet another support of note until the 2020 low at 1.1409 (March 20). In the opposite direction, bullish moves area expected to initially target the weekly high at 1.1900 (August 26) ahead of the interim 55-day SMA at 1.2045. The surpass of the latter could open the door to the August top at 1.2293 (August 1) ahead of the weekly peak at 1.2405 (June 16) and the 1.2666 level (May 27 high). Further north, a probable test of the psychological 1.3000 yardstick could start shaping up. The daily RSI debilitates further and flirts with the oversold territory near 30.
Resistance levels: 1.1760 1.1900 1.2006 (4H chart)
Support levels: 1.1621 1.1445 1.1409 (4H chart)
AUDUSD
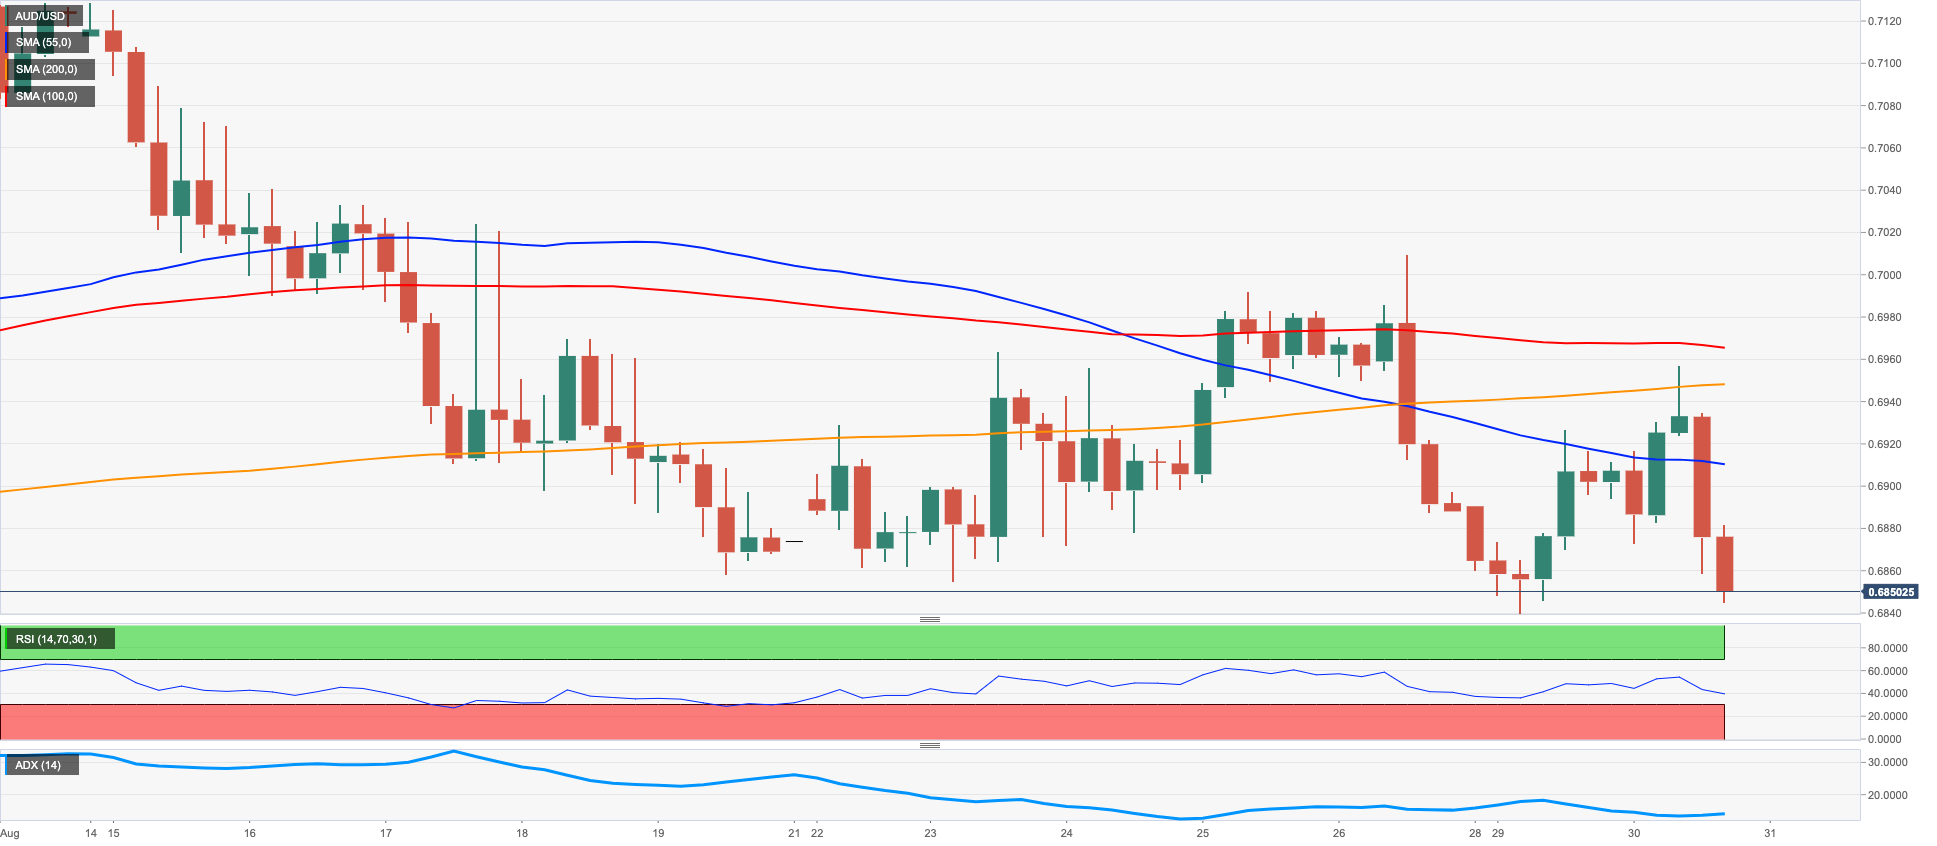
AUD/USD reversed the initial bull run to the 0.6955/60 band, or daily highs, and returned to the negative territory following the equally marked change of direction in the US dollar.
Indeed, solid prints in the US calendar lent temporary fresh oxygen to the buck and sponsored the return of the bullish interest in the US Dollar Index (DXY), all in detriment of the risk-associated galaxy.
Supporting the downbeat mood around the Aussie dollar also emerged the subdued price developments in the commodity space.
The Australian docket remained empty on Tuesday, while the next releases of note will be the Ai Group Manufacturing Index, the final Manufacturing PMI, Home Loans and Investment Lending for Homes, all due on Thursday.
Bears continue to target the August low at 0.6840 (August 29) prior to the 2022 low at 0.6681 (July 14). Down from here appears the May 2020 low at 0.6372 (May 4) ahead of the weekly low at 0.6253 (April 21 2020). Moreover, the weekly peak at 0.7008 (August 26) should offer initial resistance just ahead of the 100-day SMA at 0.7013. Further advances could put the 200-day SMA at 0.7126 back on the radar prior to the August high at 0.7136 (August 11). Extra gains should then retarget the June top at 0.7282 (June 3) ahead of the weekly peak at 0.7458 (April 21). The daily RSI loses momentum and breaks below 45.
Resistance levels: 0.6941 0.6956 0.7008 (4H chart)
Support levels: 0.6858 0.6840 0.6802 (4H chart)
GOLD
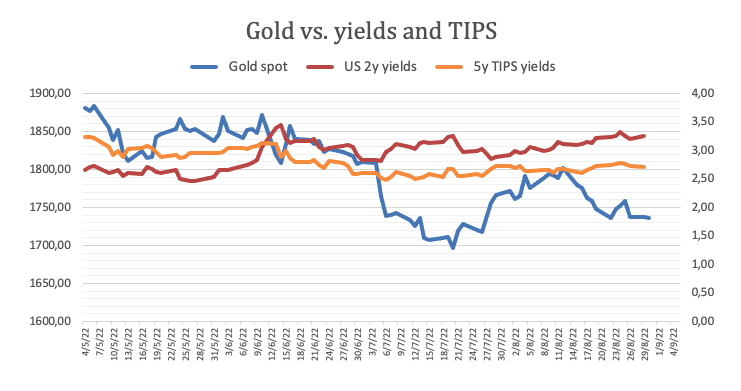
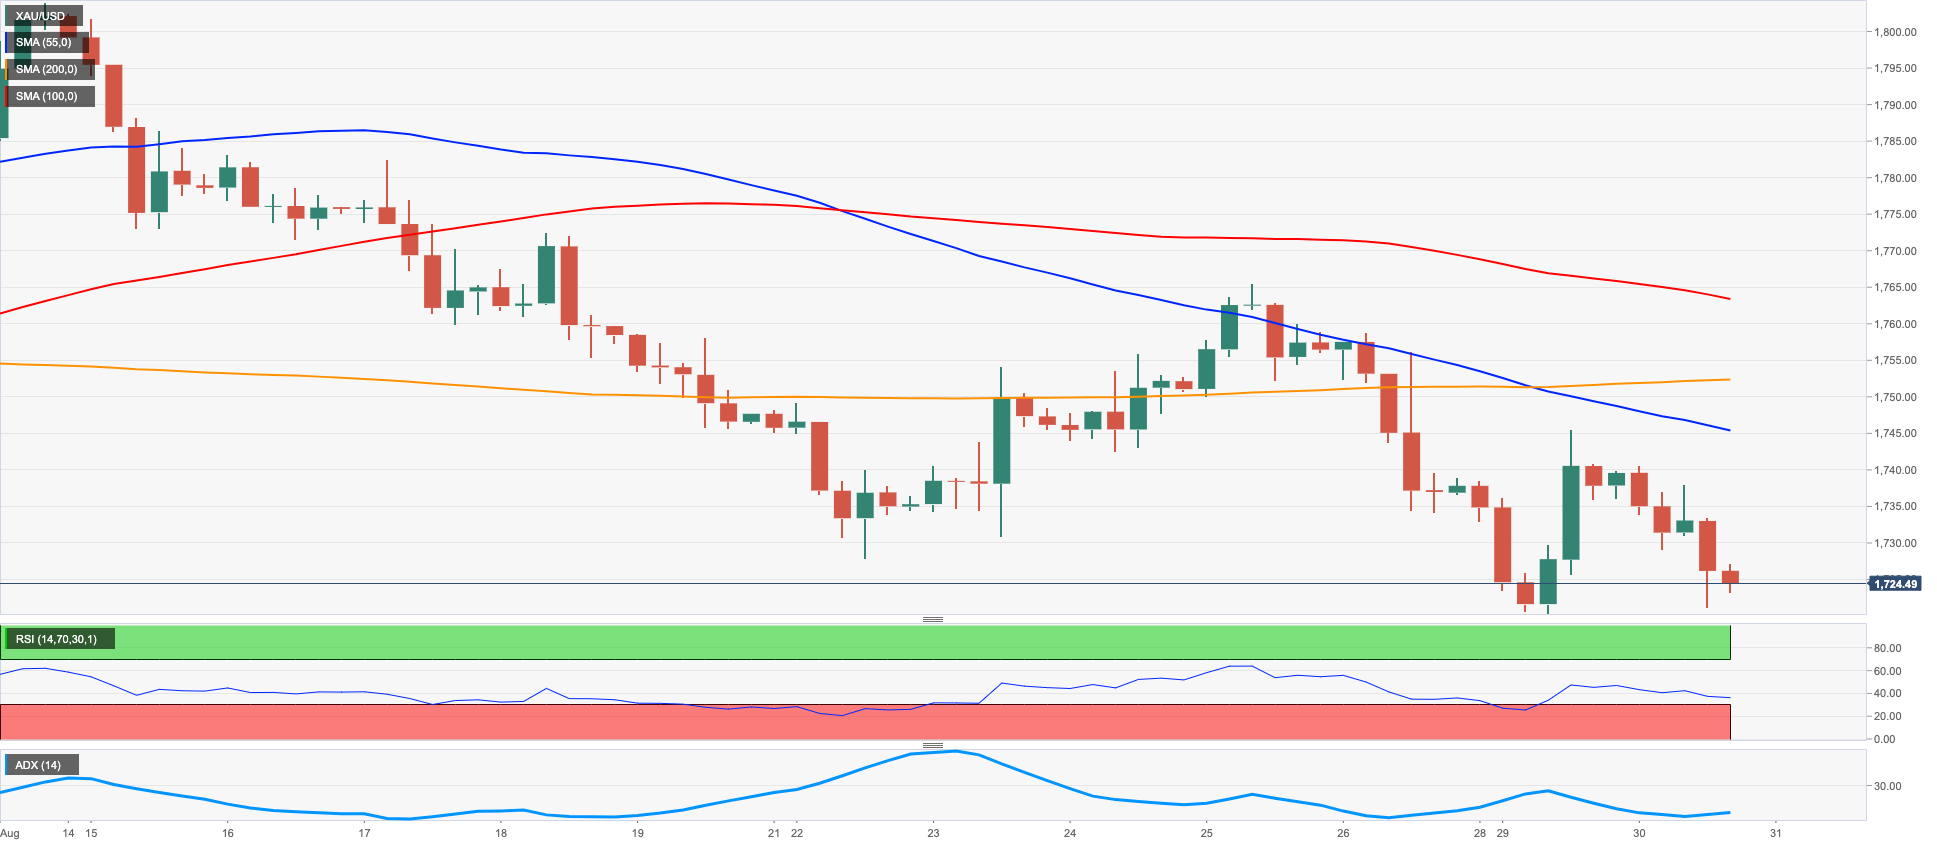
Bullion prices extended the leg lower and dropped for the third session in a row on Tuesday, revisiting weekly lows in the $1,720 region.
Despite the generalized offered stance in the greenback, the yellow metal remained unable to gather some upside traction amidst the resumption of the upside bias in US yields, particularly in the short end and the belly of the curve.
These are not happy days for the precious metal, as investors continue to adjust to the idea that the Federal Reserve will keep hiking rates until inflation looks well under control and on track to convincingly return to the 2% target, a scenario pretty far away for the time being. By the same token, rising speculation of a 75 bps rate hike by the ECB next month also played against any attempt to regain the smile in the non-yielder metal.
A deeper decline in gold should now meet the weekly low at $1,711 (July 27), which precedes the round level at $1,700. South from here appears the 2022 low at $1,680 (July 21) ahead of the 2021 low at $1,1676 (March 8) and followed by the June 2020 low at $1,670 (June 5). Bullish attempts, on the other side, face the initial up barrier at the weekly peak at $1,765 (August 25), an area bolstered by the 55-day SMA at $1,768. If the metal leaves behind this level then it could challenge the August high at $1,807 (August 10) before the 100- and 200-day SMAs at $1,815 and $1,836, respectively. Beyond this region, the June top at $1,879 (June 13) could resurface on the horizon.
Resistance levels: $1,745 $1,750 $1,765 (4H chart)
Support levels: $1,720 $1,711 $1,680 (4H chart)
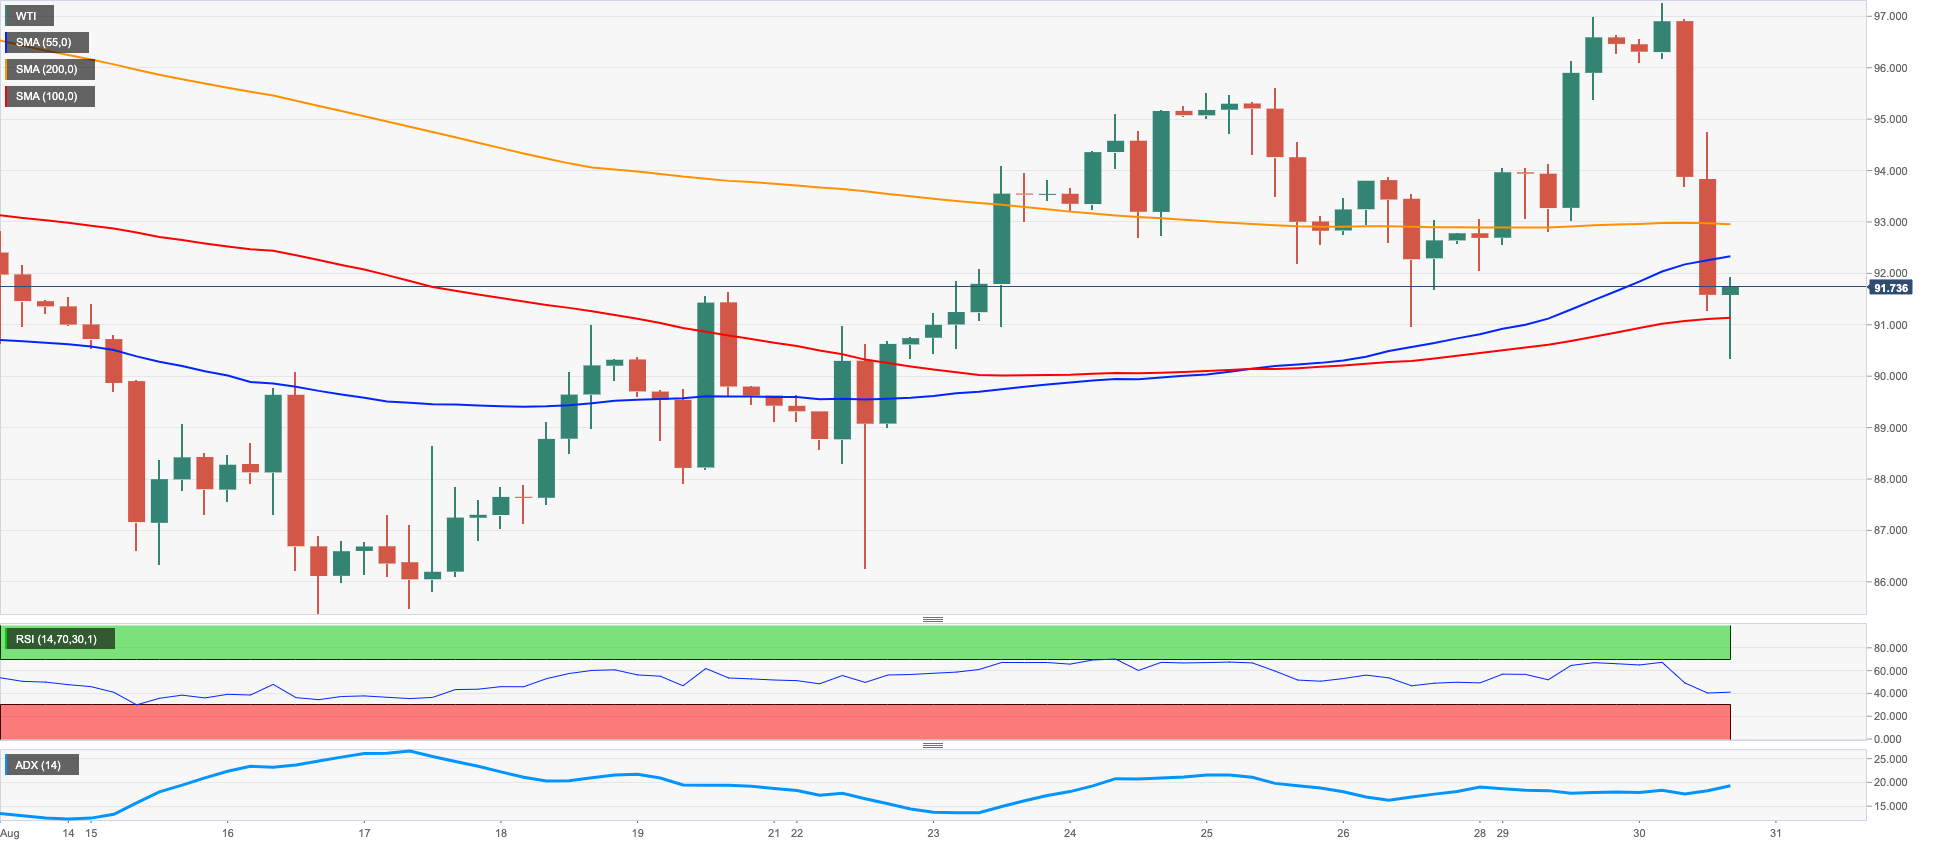
CRUDE WTI
Prices of the American reference for the sweet light crude oil tumbled more than 6% and returned to the sub-$91.00 region as the sentiment among traders deteriorated further on Tuesday.
Indeed, demand concerns stemming from a potential global slowdown – in response to the tightening bias by major central banks – coupled with market chatter citing that the OPEC+ talked down the possibility of cutting its oil output all weighed on the commodity and forced prices to abandon the area of weekly lows past the $97.00 mark per barrel.
In the meantime, concerns around further turmoil in Libya and Iraq appear to have been ignored by traders so far.
Later on Tuesday, the API will report on US crude oil supplies in the week to August 26.
If sellers regain further control of the market, prices of the WTI could slip back to the August low at $85.74 (August 16) prior to the 81.94 level (low January 24). South from here turns up the key round level at $80.00 ahead of the 2022 low at $74.30 (January 3). The initial up barrier emerges at the weekly high at $97.65 (August 30) ahead of the 55-day SMA at $98.58 and prior to the psychological $100.00 yardstick. Once cleared, the weekly top at $101.87 (July 29) could return to the traders’ radar prior to another weekly peak at $104.44 (July 19) and the July high at $111.42 (July 5).
Resistance levels: $97.65 $101.87 $104.44 (4H chart)
Support levels: $90.53 $86.26 $85.72 (4H chart)
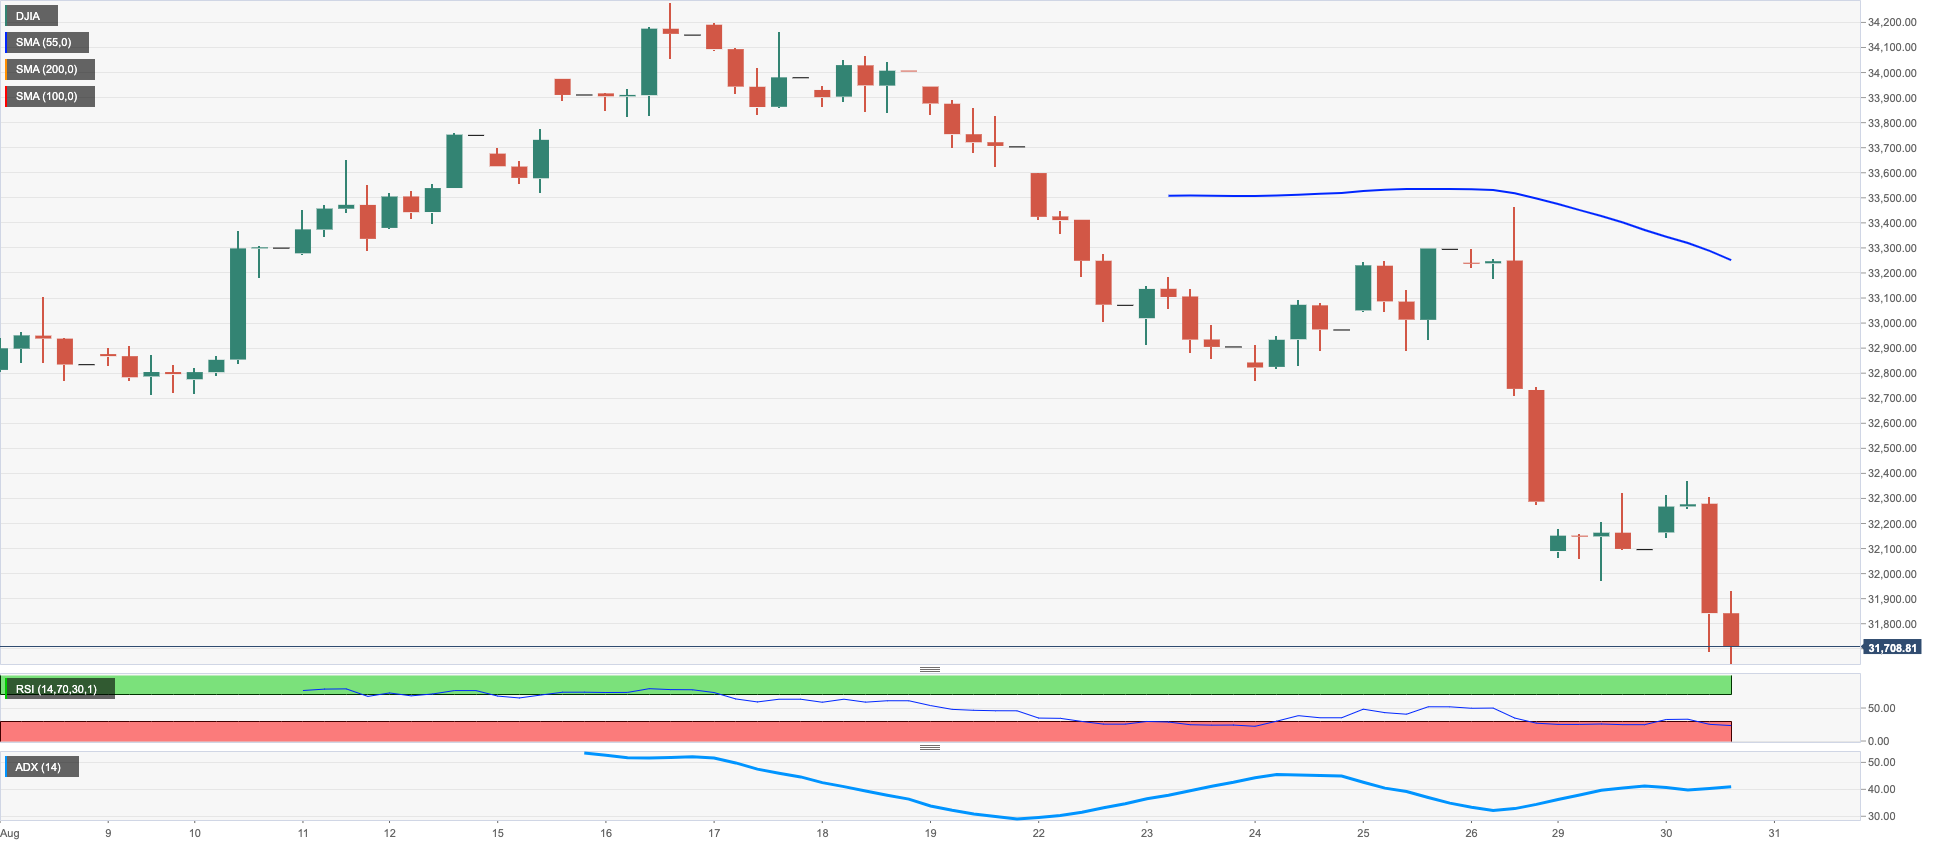
DOW JONES
The sentiment around US equities remained sour on Tuesday, as recession concerns kept dictating the mood among market participants, particularly following Powell’s speech last week and earlier comments from Fed’s Williams and Barkin on Tuesday.
Furthermore, above-consensus results from the Consumer Confidence gauge and higher-than-expected Job Openings data also added to the persistent discontent in the market.
That said, the Dow Jones retreated 1.07% to 31,757, the S&P500 dropped 1.26% to 3,978 and the tech-heavy Nasdaq Composite shed 1.89% to 11,790.
Another monthly low in the Dow Jones at 31,647 emerges as the immediate support for bears. The breach of this level should prompt the weekly low at 31,534 (July 21) to start emerging on the horizon prior to the July low at 30,143 (July 14) and the 2022 low at 29,653 (June 17). Conversely, the 100-day SMA comes first at 32,462 before the 33,364 level (high August 26) and the key 200-day SMA at 33,734. If the index breaks above this region, then it could attempt a move to the August high at 34,281 (August 16) ahead of the April top at 35,492 (April 21) and the February peak at 35,824 (February 9). The RSI rapidly loses traction and pierces 38.
Top Performers: Amgen, J&J, Nike
Worst Performers: Chevron, Caterpillar, Dow
Resistance levels: 32,472 33,364 34,281 (4H chart)
Support levels: 31,647 30,982 30,143 (4H chart)
MACROECONOMIC EVENTS

All Information & Updates provided by:

All information relating to the financial markets available on this page has been prepared and issued by FXStreet (Forexstreet SL, Spain, Reg: B62498233) on the basis of publicly available information and all information believed to be reliable and does not conflict with Kuwaiti local laws, and all necessary care has been taken to before the company to ensure that the facts mentioned are correct from the source.
NCM Investment nor any of its directors or employees shall in any way be held responsible for the contents of this news, and the information contained on this page is intended only to provide clients with publicly available information and should not be construed as investment advice, report or analysis and/or constitute an offer or invitation to buy or sell financial instruments of any kind.
RISK WARNING: Forex and CFDs are highly risky leveraged products, as losses can exceed deposits. Please ensure you understand all the risks and take independent advice if necessary. NCM will segregate the clients based on the criteria of the regulator and its bylaws. NCM does not provide any advisory service; the material published does not constitute advice or a recommendation for a transaction in any financial instrument. NCM accepts no responsibility for any use of the content presented and any consequences of that use. Anyone acting on the information provided does so at their own risk.