
- Contact Us:
-

-

-

-


Daily Market Updates
02 Sep 2022
EURUSD
EUR/USD came under strong pressure and charted a negative session after three daily advances in a row on Thursday. The pair failed to extend further north the move to daily highs past 1.0050, sparking a sharp decline that met decent contention near the 0.9900 zone.
On the USD-side of the equation, the greenback remained well bid and sponsored the move to fresh cycle highs just below the 110.00 mark when measured by the US Dollar Index (DXY), a region last traded in June 2002.
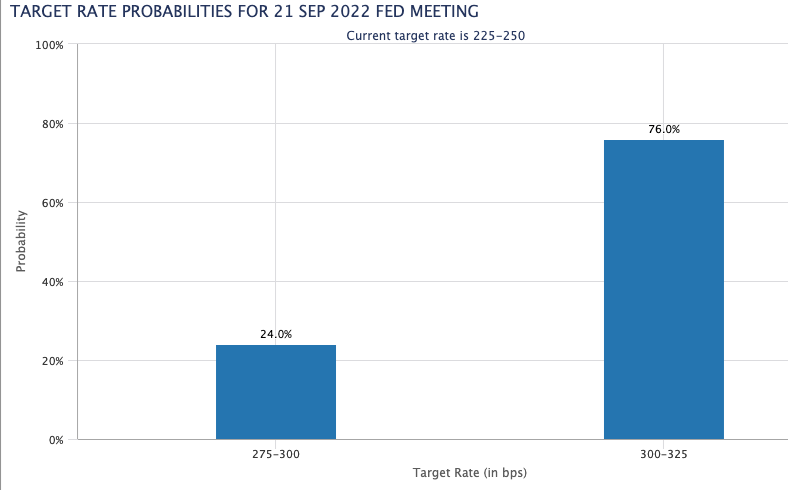
Looking at the broader scenario, the pair continued to follow developments around the potential moves by the Federal Reserve and the ECB regarding monetary policy, especially the size of the next rate hikes in September. CME Group’s FedWatch Tool sees the probability of a 75 bps rate raise by the Fed at around 76% at the September 21 gathering.
Back to the ECB, recent messages from Board members seem to favour a half-point increase next month and a 75 bps hike at the October event. The odds for the latter picked up pace particularly after the higher-than-expected inflation figures in the Euroland for the month of August.
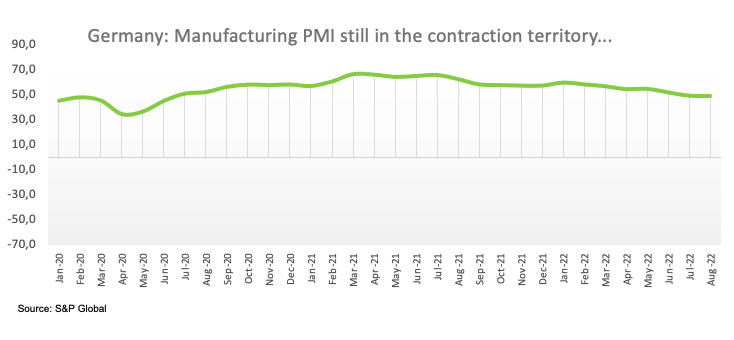
In the docket, Retail Sales in Germany contracted at an annualized 2.6% in July, while the final S&P Global Manufacturing PMI came at 49.1 in August. In the broader euro area, the S&P Global Manufacturing PMI dropped to 49.6 and the Unemployment Rate improved to 6.6% in July.
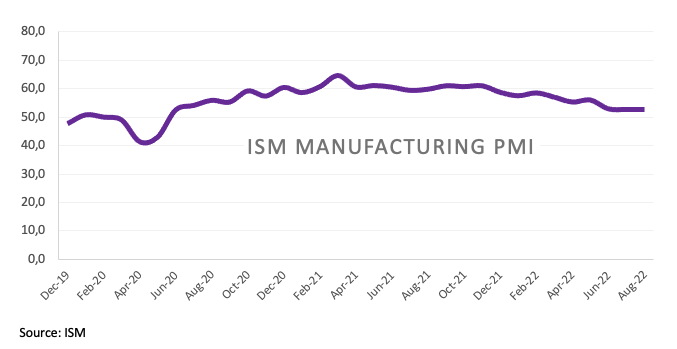
In the US, the ISM Manufacturing surprised to the upside at 52.8 for the month of August, while the final S&P Global Manufacturing PMI came at 51.5, Construction Spending contracted 0.4% MoM in July and Initial Claims rose by 232K in the week to August 27.
Sellers in EUR/USD continue to face decent contention at the 2022 low at 0.9899 (August 23) ahead of the December 2002 low at 0.9859 and the October 2002 low at 0.9685 (October 21). Contrarily, the next up barrier comes at the weekly top at 1.0089 (August 26) seconded by the 1.0202 level (August 17 peak). Up from here emerges the interim 55-day SMA at 1.0214 prior to the August high at 1.0368 (August 10) and the 100-day SMA at 1.0395. Beyond this region, the weekly top at 1.0615 (June 27) is expected to return to the investors’ radar. The daily RSI debilitates to the 37 region.
Resistance levels: 1.0079 1.0090 1.0144 (4H chart)
Support levels: 0.9910 0.9899 0.9859 (4H chart)
-637976543166428016.png)
USDJPY
USD/JPY rose for the fifth consecutive session and clocked new cycle highs past the 140.00 hurdle on Thursday for the first time since September 1998.
The relentless march higher in the pair came in tandem with further improvement in US yields across the curve as well as the abrupt uptick in the greenback, all underpinned at the same time by solid prospects for further tightening by the Federal Reserve in the next months.
-637976546846832833.png)
In the Japanese calendar, Capital Spending expanded 4.6% YoY in Q2 and Foreign Bond Investment shrank to ¥303.7B in the week to August 27.
USD/JPY clinched a new 2022 high at 140.22 (September 1). The surpass of this level should not meet any resistance of note until the all-time high at 147.67 (August 11 1998). On the flip side, the 55-day SMA at 135.97 offers interim support before the weekly low at 135.80 (August 23). South from here appears the 100-day SMA at 133.15 ahead of another weekly low at 131.73 (August 11). The loss of the latter could introduce a deeper pullback to the August low at 130.39 (August 2) prior to the psychological 130.00 yardstick. The daily RSI ticks higher past 68 and approaches the overbought territory.
Resistance levels: 140.22 142.46 145.41 (4H chart)
Support levels: 139.69 138.26 138.05 (4H chart)
-637976543881066692.png)
GBPUSD
There seems to be no respite for the deterioration of the outlook for the British pound. Indeed, GBP/USD dropped further and printed new cycle lows in the sub-1.1500 zone on Thursday, an area last visited in late March 2020.
This time, the renewed buying pressure around the greenback combined with the worsening domestic conditions weighing on the quid forced spot to prolong the so far 3-week downtrend to the 1.1500 neighbourhood.
The persevering retracement in the pair came in stark contrast with the intense rebound in the UK 10y Gilt yields, which traded above the 2.90% yardstick for the first time since July 2011.
In the UK, the final S&P Global Manufacturing PMI came at 47.3 in August (from 52.1).
GBP/USD remains poised for further weakness, although the current oversold conditions could spark a technical bounce in the short term, as per the daily RSI near 26. The breakdown of the 2022 low at 1.1498 (September 1) is expected to open the door to a deeper pullback to the 2020 low at 1.1409 (March 20). On the flip side, there is initial hurdle at the weekly peak at 1.1900 (August 26) ahead of the round level at 1.2000 and the interim 55-day SMA at 1.2019. The surpass of the latter could expose the August high at 1.2293 (August 1) prior to the weekly top at 1.2405 (June 16) and the 1.2666 level (May 27 high). Beyond this level, a probable visit to the psychological 1.3000 yardstick could re-emerge on the horizon.
Resistance levels: 1.1693 1.1760 1.1900 (4H chart)
Support levels: 1.1498 1.1445 1.1409 (4H chart)
-637976543509319601.png)
AUDUSD
AUD/USD remained on the defensive and retreated below the 0.6800 support to print new 6-week lows on Thursday. The pair, therefore, started the second consecutive month in the negative territory.
The strong rebound in the greenback propelled the US Dollar Index (DXY) to new tops just below the 110.00 mark and kept the sentiment in the risk complex well depressed.
In addition, the poor performance in the commodity galaxy also collaborated with the selling bias around the Aussie dollar. On this, copper prices grinded lower and clinched new multi-week lows, while prices of the iron ore tumbled below the $96.00 mark per tonne for the first time since November 2021.
In Australia, the Ai Group Manufacturing Index worsened to 49.3 in August and the final S&P Global Manufacturing PMI eased to 53.8. In addition, Home Loans contracted 7.0% MoM in July and Investment Lending for Homes also shrank 11.2% in the same period.
If AUD/USD breaches the multi-week low at 0.6771 (September 1) it could open the door to a deeper decline to the 2022 low at 0.6681 (July 14) ahead of the May 2020 low at 0.6372 (May 4) and the weekly low at 0.6253 (April 21 2020). Adversely, the 55-day SMA offers initial interim resistance at 0.6909 ahead of the weekly top at 0.7008 (August 26), which looks reinforced by the 100-day SMA at 0.7001. The continuation of the rebound could confront the 200-day SMA at 0.7123 before the August peak at 0.7136 (August 11) and the June high at 0.7282 (June 3). The daily RSI loses further momentum and breaches 40.
Resistance levels: 0.6845 0.6903 0.6946 (4H chart)
Support levels: 0.6771 0.6718 0.6681 (4H chart)
-637976544248193321.png)
GOLD
The selling pressure continued to hurt the yellow metal and dragged prices below the key $1,700 support on Thursday, opening the door at the same time to a potential visit to the 2022 low around $1,680 sooner rather than later.
The usual suspects put bullion under heightened pressure on Thursday, namely the Fed’s tightening prospects, hawkish Fedspeak (and ECB-speak), a stronger dollar and further upside in US yields.
Indeed, skies over gold appear everything but rosy for the time being, and the perspective of a deeper pullback against the current backdrop also seems to pick up traction by the day.
The break below the weekly low at $1,688 (September 1) should pave the way for a potential visit to the 2022 low at $1,680 (July 21) ahead of the 2021 low at $1,1676 (March 8) and followed by the June 2020 low at $1,670 (June 5). Adversely, there is an initial barrier at the weekly top at $1,765 (August 25), which appears bolstered by the interim 55-day SMA at $1,763. Further bounce could see the August peak at $1,807 (August 10) revisited before the 100- and 200-day SMAs at $1,810 and $1,835, respectively, all ahead of the June high at $1,879 (June 13).
Resistance levels: $1,723 $1,745 $1,765 (4H chart)
Support levels: $1,688 $1,680 $1,670 (4H chart)
-637976544654019927.png)
CRUDE WTI
A deeper drop in prices of the WTI tested the vicinity of the $86.00 mark per barrel on Thursday, recording at the same time the third consecutive daily retracement and trading at shouting distance from recent 7-month lows.
Demand concerns re-emerged among traders and further deteriorated the sentiment around crude oil after many Chinese big cities reimposed COVID lockdown measures on Thursday.
Adding fuel to the fire, recession chatter remained well and sound against the backdrop of rising perception of a tighter-for-longer monetary policy stance in the US and Europe, all aimed at fighting the spectre of elevated inflation.
In addition, the Iran-West negotiations to revive the 2015 Tehran nuclear deal appear to be well on track to end on the positive side, which could see further Iranian oil returning to the market.
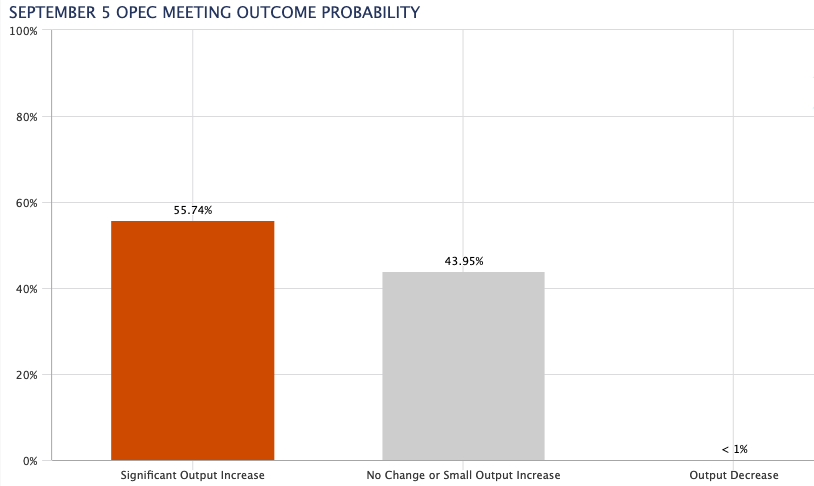
Ahead of the OPEC+ meeting on September 5, the CME Group’s OPEC Watch Tool now sees the probability of a significant output increase at nearly 56% vs. almost 44% when it comes to keeping the status quo or a small output increase.
Extra losses in WTI now need to clear the weekly low at $86.24 (September 1) to allow for a challenge of the August low at $85.74 (August 16) prior to the 81.94 level (low January 24). The loss of the latter could put a test of the key round level at $80.00 back on the traders’ radar before the 2022 low at $74.30 (January 3). On the other hand, the 200-day SMA at $96.20 turns up as the initial up barrier closely followed by the weekly peak at $97.65 (August 30), which appears reinforced by the 55-day SMA. The surpass of this region could open the door to the psychological $100.00 mark ahead of the weekly high at $101.87 (July 29) and another weekly top at $104.44 (July 19).
Resistance levels: $91.59 $92.72 $97.65 (4H chart)
Support levels: $86.37 $86.26 $85.72 (4H chart)
-637976545389514548.png)
DOW JONES
Equities tracked by the three major US stock indices extended the decline to multi-week lows on Thursday, always in response to rising speculation of a global slowdown due to the ongoing tightening cycle by major central banks.
In addition, fresh lockdown measures in highly populated cities in China also added to those ongoing worries.
Further pressure on the risk complex came from fresh cycle highs in the greenback when measured by a basket of its main rival currencies and the persevering upside in US yields across the curve.
Against that, the Dow Jones retreated 0.28% to 31,421, the S&P500 dropped 0.81% to 3,923 and the tech-heavy Nasdaq Composite shed 1.61% to 11,626.
If bears remain in control of the Dow Jones, the breach of the weekly low at 31,219 (September 1) should lead up to a probable drop to the July low at 30,143 (July 14) ahead of the 2022 low at 29,653 (June 17). On the other hand, the 55- and 100-day SMAs at 31,985 and 32,398, respectively, are expected to offer initial resistance prior to the 33,364 level (August 26 top) and the key 200-day SMA at 33,687. Above this region, a potential visit to the August high at 34,281 (August 16) could return to the radar ahead of the April top at 35,492 (April 21) and the February peak at 35,824 (February 9). The RSI loses ground and trades close to 34.
Top Performers: Merck&Co, J&J, Amgen
Worst Performers: Boeing, Salesforce.com, Microsoft
Resistance levels: 32,325 33,364 34,281 (4H chart)
Support levels: 31,219 30,982 30,143 (4H chart)
-637976546217075139.png)
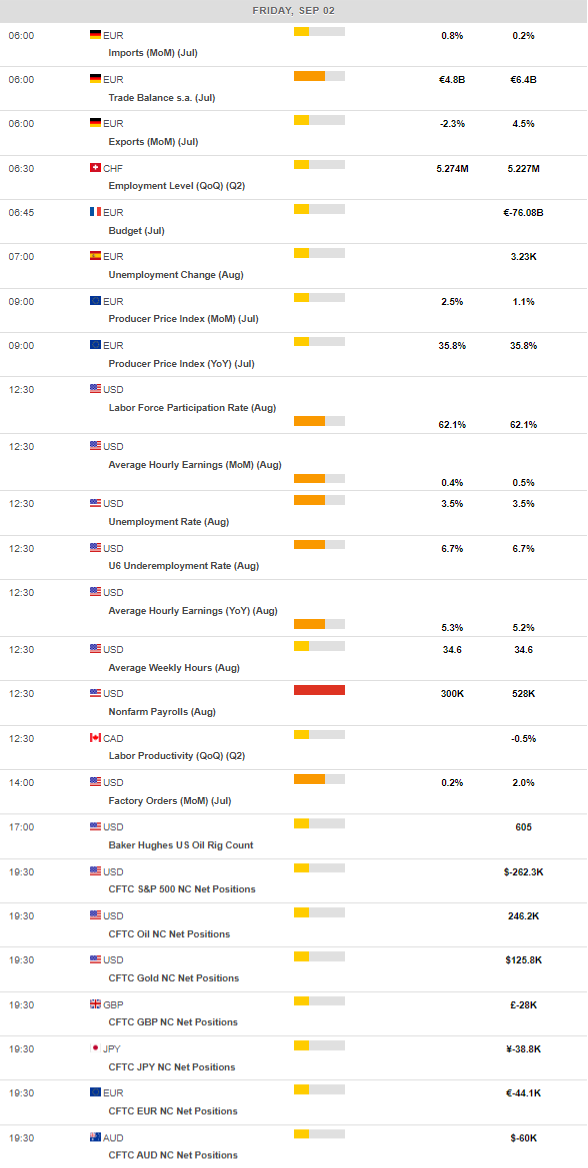
MACROECONOMIC EVENTS
All Information & Updates provided by:

All information relating to the financial markets available on this page has been prepared and issued by FXStreet (Forexstreet SL, Spain, Reg: B62498233) on the basis of publicly available information and all information believed to be reliable and does not conflict with Kuwaiti local laws, and all necessary care has been taken to before the company to ensure that the facts mentioned are correct from the source.
NCM Investment nor any of its directors or employees shall in any way be held responsible for the contents of this news, and the information contained on this page is intended only to provide clients with publicly available information and should not be construed as investment advice, report or analysis and/or constitute an offer or invitation to buy or sell financial instruments of any kind.
RISK WARNING: Forex and CFDs are highly risky leveraged products, as losses can exceed deposits. Please ensure you understand all the risks and take independent advice if necessary. NCM will segregate the clients based on the criteria of the regulator and its bylaws. NCM does not provide any advisory service; the material published does not constitute advice or a recommendation for a transaction in any financial instrument. NCM accepts no responsibility for any use of the content presented and any consequences of that use. Anyone acting on the information provided does so at their own risk.