
- Contact Us:
-

-

-

-


Daily Market Updates
06 Sep 2022
EURUSD
EUR/USD started the week on a weak foot and dropped to fresh cycle lows in the 0.9880/75 band, as investors continued to lean towards the greenback as they kept adjusting to Friday’s solid Nonfarm Payrolls figures for the month of August (+315K).
The dollar remained well bid on the back of firm expectations of the continuation of the aggressive pace of interest rate hikes by the Federal Reserve in a context where inflation has so far given no signs of subsiding.
On the latter, the US Dollar Index (DXY) extended its march north and reached more than 20-year highs near 110.30, although it lost part of that initial upside bias later in the session and returned to the sub-110.00 region.
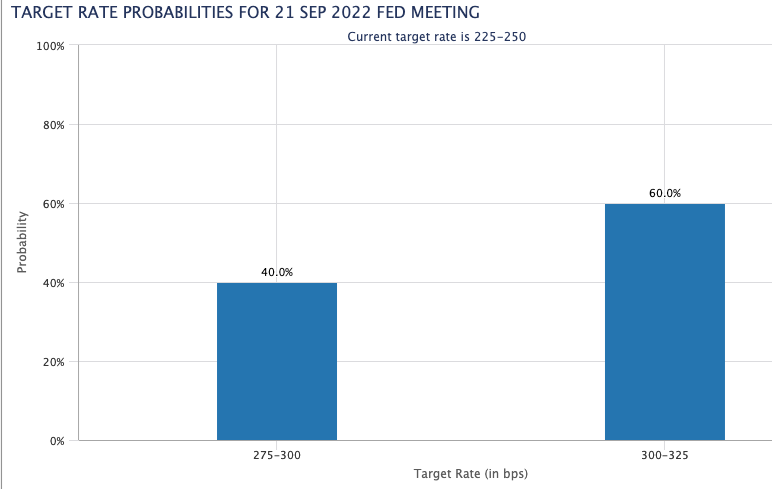
Looking at the more macro panorama, market participants continued to debate over the potential size of the next interest rate hikes by both the Fed and the ECB. It is worth noting that the ECB will meet later in the week amidst consensus of a 75 bps raise, while the Fed’s September 21 event also points to a ¾ point rate hike. CME Group’s FedWatch Tool sees the probability of this scenario at around 60% (from around 75% a week ago).
No data releases in the US, as markets remained closed due to the Labor Day holiday.
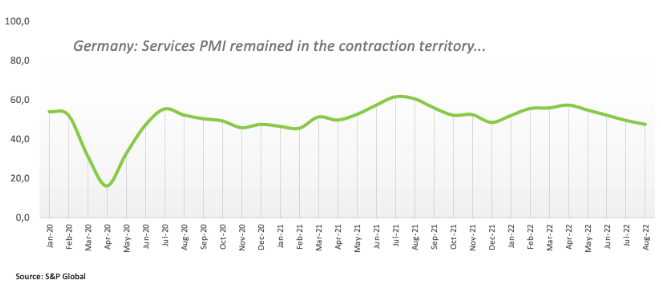
In the domestic calendar, final Services PMIs in Germany and the euro area were revised lower at 47.7 and 49.8, respectively, for the month of August. In addition, Retail Sales in the broader euro bloc contracted at an annualized 0.9% in July.
EUR/USD clinched a new 2022 low at 0.9877 (September 5). The breach of this level could open the door to the December 2002 low at 0.9859 ahead of the October 2002 low at 0.9685 (October 21). Contrarily, there are a couple of minor hurdles at weekly highs at 1.0079 (August 31) and 1.0090 (August 26) prior to the 55-day SMA at 1.0192 and the 1.0202 level (August 17 top). North from here emerges the August peak at 1.0368 (August 10) before the 100-day SMA at 1.0377. If the pair clears this level it could put the weekly high at 1.0615 (June 27) back on the traders’ radar. The daily RSI edged lower to 35.
Resistance levels: 1.0033 1.0079 1.0090 (4H chart)
Support levels: 0.9877 0.9859 0.9685 (4H chart)
-637979971143719278.png)
USDJPY
USD/JPY faded Friday’s small downtick and flirted with recent cycle highs well north of the 140.00 mark at the beginning of the week.
The persistent march higher in the greenback remained underpinned by the broader perception among investors that further tightening by the Federal Reserve remains well in store in the upcoming months.
It was all about the greenback at the beginning of the week, as the US debt/stock markets were closed due to the Labor Day holiday.
In Japan, the final Jibun Bank Services PMI eased to 49.5 in August (from 50.3).
Next on the upside for USD/JPY still comes the 2022 peak at 140.80 (September 2) followed by 145.41 (August 21 1998 high) and then the all-time top at 147.67 (August 11 1998). In the opposite direction, the 55-day SMA at 136.17 emerges as an interim contention ahead of the weekly low at 135.80 (August 23) and the 100-day SMA at 133.43. The loss of this region could open the door to another weekly low at 131.73 (August 11) prior to the August low at 130.39 (August 2) and just before the psychological 130.00 level. The daily RSI entered the overbought territory just above 70.
Resistance levels: 140.80 142.46 145.41 (4H chart)
Support levels: 139.91 139.05 138.26 (4H chart)
-637979971914361993.png)
GBPUSD
Finally, some relief for the British pound.
Indeed, GBP/USD initially extended the leg lower and recorded new lows in an area last traded back in March 2020 near 1.1440 on Monday, although it made a U-turn later in the session and ended slightly up for the day.
The continuation of the uptrend in the greenback maintained its heavy pressure on the risk complex and forced the quid to shed further ground still. Cable, in the meantime, has so far reversed three weeks in a row with losses, although it kept navigating the fourth month in a row in the negative territory.
On another front, (and maybe lending some fresh oxygen to the quid?) the Conservative Party designated Liz Truss as the successor of Boris Johnson in Number 10. No easy days ahead for Truss, as she will face the entrenched negative outlook of the UK economy, 2-digit-and-rising inflation, the energy crunch and the war in Ukraine, among other hot issues.
In the UK calendar, the always relevant Services PMI clung to the expansion territory after printing 50.9 in August, down from 52.6.
GBP/USD is expected to accelerate losses on a breakdown of the 2022 low at 1.1443 (September 5) prior to the 2020 low at 1.1409 (March 20). On the flip side, there are no relevant hurdles until the weekly top at 1.1900 (August 26) seconded by the round level at 1.2000. This region looks propped up by the proximity of the temporary 55-day SMA. Up from here comes the August peak at 1.2293 (August 1) ahead of the weekly high at 1.2405 (June 16) and the 1.2666 level (May 27 high). The continuation of the uptrend should prompt the psychological 1.3000 mark to re-emerge on the horizon. The daily RSI stayed in the oversold territory below 24.
Resistance levels: 1.1520 1.1581 1.1693 (4H chart)
Support levels: 1.1443 1.1409 1.1400 (4H chart)
-637979971568601093.png)
AUDUSD
AUD/USD started the week in an offered fashion and briefly flirted with recent lows near 0.6770 on Monday.
The resumption of the buying interest in the US dollar kept the price action in the risk-associated universe subdued at the beginning of the week. The Aussie dollar was no exception, as not even the tepid bounce in the commodity space could lend some support to the high-beta currency.
Data wise in Oz, the final S&P Global Services PMI held well in the expansion territory at 50.2 in August (from 50.9) and final figures also saw Retail Sales expand 1.3% MoM in July.
Bears continue to target the September low at 0.6771 (September 1) so far. Extra weakness from here should revisit the 2022 low at 0.6681 (July 14) ahead of the May 2020 low at 0.6372 (May 4) and the weekly low at 0.6253 (April 21 2020). On the upside, the 55-day SMA at 0.6903 acts as an initial barrier prior to the 100-day SMA at 0.6989. If spot leaves the latter behind, it could then challenge the weekly high at 0.7008 (August 26) ahead of the 200-day SMA at 0.7119. North from here emerges the August top at 0.7136 (August 11) seconded by the June peak at 0.7282 (June 3). The daily RSI eased a tad and tested the 39 region.
Resistance levels: 0.6802 0.6849 0.6903 (4H chart)
Support levels: 0.6771 0.6718 0.6681 (4H chart)
-637979972361993000.png)
GOLD
Prices of the ounce troy of gold partially faded Friday’s strong advance, although they managed well to keep business above the key $1,700 mark at the beginning of the new trading week.
Fresh weakness around the non-yielder metal came in response to the sharp move higher in the greenback, as investors continued to digest another healthy print from the US Nonfarm Payrolls for the month of August released last Friday.
The absence of activity in the US cash markets seems to have limited the downside potential in the precious metal, although it is expected to remain under persistent pressure in light of the Fed’s unchanged stance regarding the rate path in the next months.
In case gold resumes the downtrend, the next support of note is predicted to turn up at the 2022 low at $1,680 (July 21) just ahead of the 2021 low at $1,1676 (March 8) and followed by the June 2020 low at $1,670 (June 5). Inversely, bulls face a temporary hurdle at the 55-day SMA at $1,759, ahead of the more relevant weekly high at $1,765 (August 25). The breakout of this level could pave the way for a move to the August top at $1,807 (August 10) prior to the 200-day SMA at $1,834, all ahead of the June peak at $1,879 (June 13).
Resistance levels: $1,718 $1,726 $1,745 (4H chart)
Support levels: $1,688 $1,680 $1,670 (4H chart)
-637979972695651642.png)
CRUDE WTI
Prices of the barrel of the West Texas Intermediate (WTI) prolonged the optimism seen last Friday and at some point advanced just beyond the $90.00 mark per barrel on Monday.
Indeed, traders managed to leave behind demand concerns and stayed focused on the OPEC+ meeting, which finally delivered a small reduction (100 kbpd) of the cartel’s oil output for the month of October.
Also collaborating with the upbeat mood among traders, lockdown measures in some big Chinese cities eased somewhat while there was no further news regarding the Iran-West talks to revive the 2015 Tehran nuclear deal.
A more serious rebound in WTI should initially regain the 200-day SMA at $96.30 prior to the weekly top at $97.65 (August 30), all ahead of the psychological $100.00 mark. The surpass of this hurdle could open the door to the weekly peak at $101.87 (July 29) before another weekly high at $104.44 (July 19). On the contrary, the August low at $85.74 (August 16) emerges as the initial contention before the 81.94 level (low January 24) and the key round level at $80.00. The breach of this yardstick could pave the way for a deeper drop to the 2022 low at $74.30 (January 3).
Resistance levels: $90.37 $92.51 $97.65 (4H chart)
Support levels: $86.61 $85.97 $85.72 (4H chart)
-637979973333721424.png)
DOW JONES
US stocks and money markets were closed at the beginning of the week due to the Labor Day holiday.
Equities tracked by the Dow Jones closed the third consecutive week with losses on Friday and entered at the same time the second month in a row in the negative territory. Furthermore, the index dropped to almost the 78.6% Fibo retracement of the mid-July/mid-August rally.
The sharp decline in the Dow Jones in past weeks followed persevering recession concerns, which were exacerbated after Chief Powell reinforced the case for an “unconditional” tighter-for-longer stance of the Federal Reserve in its battle to tackle inflation.
Moving forward, the ISM Non-Manufacturing (Tuesday) will be the salient event in the first half of the week, while the Fed’s Beige Book (Wednesday) should give an idea of the recent performance of regional fundamentals. Investors will also closely follow the speech by Vice Chair L.Brainard on “Economic Outlook and Monetary Policy” (Wednesday) and the participation of Chief J.Powell in a virtual discussion at the Cato Institute’s 40th Annual Monetary Conference.
Back to Friday’s close, the Dow Jones dropped 1.07% to 31,318, the S&P500 retreated 1.07% to 3,924 and the tech reference Nasdaq Composite lost 1.31% to 11,630.
Further weakness in the Dow Jones needs to break below the weekly low at 31,182 (September 2) to allow for a drop to the July low at 30,143 (July 14) and the 2022 low at 29,653 (June 17). Immediately to the upside comes the so far September peak at 32,026 (September 2) ahead of the 100-day SMA at 32,370. Beyond this zone appears the 33,364 level (August 26 high) prior to the key 200-day SMA at 33,664 and the August peak at 34,281 (August 16). The surpass of the latter should put the April high at 35,492 (April 21) back on the radar before the February top at 35,824 (February 9). The RSI grinded lower and approached 34.
Top Performers: Chevron, Salesforce.com, Walgreen Boots
Worst Performers: 3M, Honeywell, Procter&Gamble
Resistance levels: 32,026 33,366 34,281 (4H chart)
-637979973639058100.png)
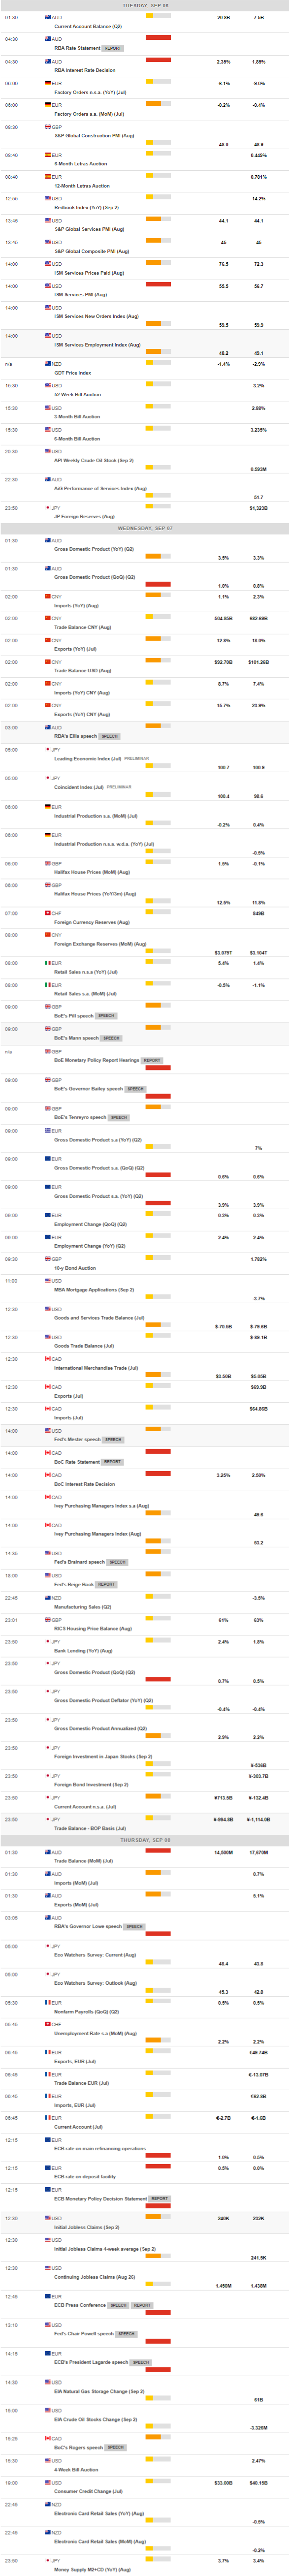
MACROECONOMIC EVENTS
All Information & Updates provided by:

All information relating to the financial markets available on this page has been prepared and issued by FXStreet (Forexstreet SL, Spain, Reg: B62498233) on the basis of publicly available information and all information believed to be reliable and does not conflict with Kuwaiti local laws, and all necessary care has been taken to before the company to ensure that the facts mentioned are correct from the source.
NCM Investment nor any of its directors or employees shall in any way be held responsible for the contents of this news, and the information contained on this page is intended only to provide clients with publicly available information and should not be construed as investment advice, report or analysis and/or constitute an offer or invitation to buy or sell financial instruments of any kind.
RISK WARNING: Forex and CFDs are highly risky leveraged products, as losses can exceed deposits. Please ensure you understand all the risks and take independent advice if necessary. NCM will segregate the clients based on the criteria of the regulator and its bylaws. NCM does not provide any advisory service; the material published does not constitute advice or a recommendation for a transaction in any financial instrument. NCM accepts no responsibility for any use of the content presented and any consequences of that use. Anyone acting on the information provided does so at their own risk.