
- Contact Us:
-

-

-

-


Daily Market Updates
07 Sep 2022
EURUSD
The earlier bullish attempt in EUR/USD ran out of steam in the area just shy of the parity level on Tuesday. The subsequent violent change of direction forced the pair to not only give away all those gains but also magnify the downside to clinch new cycle lows near 0.9860.
The sharp rebound in the greenback also propelled the US Dollar Index (DXY) to the 110.50 region for the first time since mid-June 2002. This move was underpinned by the resumption of the march north in US yields across the curve.
The pair therefore remains on the defensive and it is expected to trade with a prudent stance ahead of the key ECB gathering on Thursday. Consensus among investors continue to favour a 75 bps rate hike for the time being, while some ECB-speakers were on the wires earlier in the session: Stournaras suggested that inflation in the region is close to its peak, adding that further progressive rate normalization is deemed as appropriate. Board member Centeno sounded optimistic after saying the ECB may bring inflation to its target amidst a slow normalization. Member Kazaks hinted at the likelihood that the ECB could raise rates above neutral if needed.
In the euro docket, Germany’s Factory Orders contracted 1.1% inter-month in July and the Construction PMI eased to 42.6 in August (from 43.7).
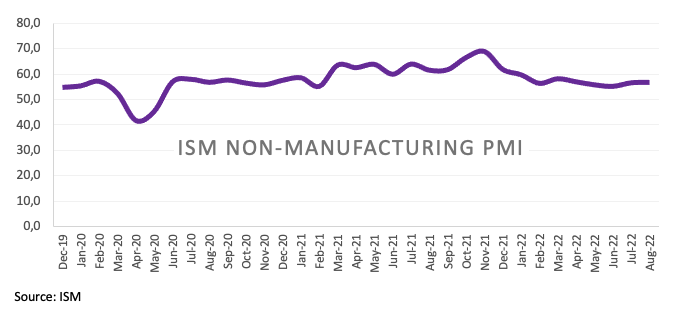
In the US data space, the final S&P Global Services PMI came at 43.7 in August, while the ISM Non-Manufacturing unexpectedly improved to 56.9 in the same month (from 56.7).
EUR/USD dropped further and printed a new 2022 low at 0.9863 (September 6). A drop below this level exposes a visit to the December 2002 low at 0.9859 prior to the October 2002 low at 0.9685 (October 21). On the flip side, the next hurdle of note comes at the weekly top at 1.0090 (August 26) ahead of the temporary 55-day SMA at 1.0181 and then the 1.0202 level (August 17 peak). Further up aligns the August high at 1.0368 (August 10), which appears reinforced by the 100-day SMA at 1.0377, seconded by the weekly top at 1.0615 (June 27). The daily RSI broke below the 34 level.
Resistance levels: 0.9986 1.0033 1.0079 (4H chart)
Support levels: 0.9863 0.9859 0.9685 (4H chart)
-637980858490682699.png)
USDJPY
Another stellar performance saw USD/JPY rise to levels last seen in late August 1998 just above the 143.00 level.
The equally solid march north in US yields across the curve lent extra legs to the pair and accentuated the depreciation around the Japanese yen, all propped up at the same time by the widening divergence between the Federal Reserve and the Bank of Japan (BoJ).
Indeed, yields in the belly of the curve flirted with an area last traded back in mid-June around 3.35%, while the long end approached the 3.50% zone, also in multi-week tops. The short term – which represents a better barometer of the Fed’s next moves - added to the previous uptick and remained close to the 3.50% area.

Following the price action in the pair, finmin Suzuki reiterated that rapid FX movements are not desirable at the time when he hinted at the possibility that recent FX moves look more significant.
In Japan, Household Spending expanded 3.4% in the year to July in what was the sole release in the docket.
The continuation of the upside momentum in USD/JPY should meet the next hurdle at the 2022 high at 142.90 (September 6) ahead of 145.41 (August 21 1998 top) and before the all-time peak at 147.67 (August 11 1998). On the contrary, the 55-day SMA at 136.28 should offer temporary support prior to the weekly low at 135.80 (August 23) and the 100-day SMA at 133.57. If cleared, the pair could challenge another weekly low at 131.73 (August 11) before the August low at 130.39 (August 2) and ahead of the psychological 130.00 mark. The daily RSI pushed further up into the overbought territory beyond 76.
Resistance levels: 143.07 145.41 146.97 (4H chart)
Support levels: 139.91 139.05 138.26 (4H chart)
-637980859449516779.png)
GBPUSD
GBP/USD dropped marginally and set aside the initial positive start of the week on Tuesday.
Indeed, the sharp move higher in the greenback prompted the sterling to fade the initial uptick just above 1.1600 the figure, or 3-day highs, and return to the proximity of the 1.1500 zone at the end of the session.
In the UK docket, the S&P Global Construction PMI improved a little to 49.2 in August (from 48.9).
GBP/USD remains under pressure and another visit to the 2022 low at 1.1443 (September 5) could open the door to the 2020 low at 1.1409 (March 20). Inversely, there is a minor up hurdle at 1.1608 (September 6 top) ahead of the weekly peak at 1.1900 (August 26) and the 55-day SMA, today at 1.1979. The breakout of the latter could put the round level at 1.2000 back on the radar ahead of the August high at 1.2293 (August 1) and the weekly top at 1.2405 (June 16). Further gains could see the 1.2666 level (May 27 top) revisited prior to the psychological 1.3000 yardstick. The daily RSI remained in the oversold territory just below 26
Resistance levels: 1.1608 1.1693 1.1760 (4H chart)
Support levels: 1.1493 1.1443 1.1409 (4H chart)
-637980858963131552.png)
AUDUSD
Further strength in the greenback encouraged sellers to remain in control for the second session in a row and dragged AUD/USD to new 2-month lows in the 0.6730/25 band on turnaround Tuesday.
Indeed, the resumption of the activity in the US markets triggered further buying interest in the dollar and kept the price action in the risk-linked galaxy well depressed in the first half of the week.
The mixed performance in the commodity space did not help the Aussie dollar either, despite a moderate recovery in prices of copper.
No meaningful reaction in AUD after the RBA raised the OCR by 50 bps to 2.35%, as widely expected. In its statement, the central bank suggested that inflation is expected to peak later in the year and then start declining to the 2%-3% area. On this, the RBA said the central forecast is for the CPI at 3.0% over 2024. The Board also anticipated higher rates in the upcoming months.
A deeper pullback from the September low at 0.6730 (September 6) should pave the wave for another visit to the 2022 low at 0.6681 (July 14) prior to the May 2020 low at 0.6372 (May 4) and the weekly low at 0.6253 (April 21 2020). On the upside, initial resistance emerges at the 55-day SMA at 0.6899 ahead of the 100-day SMA at 0.6983. Further north, the weekly top at 0.7008 (August 26) comes first before the 200-day SMA at 0.7117, which precedes the August peak at 0.7136 (August 11) followed by the June high at 0.7282 (June 3). The daily RSI lost further ground and pierced the 35 level.
Resistance levels: 0.6832 0.6855 0.6903 (4H chart)
Support levels: 0.6727 0.6718 0.6681 (4H chart)
-637980860042701384.png)
GOLD
Gold prices extended the pessimism seen at the beginning of the new week and revisited once again the key support around the $1,700 mark per ounce troy on Tuesday.
The solid upside impulse in the greenback pushed the US Dollar Index (DXY) to fresh cycle tops in levels last seen more than two decades ago, putting at the same time the yellow metal under further downside pressure.
In addition, the sharp bounce in US yields across the curve added to the sour sentiment surrounding bullion and the rest of the USD-denominated assets.
In the meantime, the precious metal is seen under constant pressure against the current backdrop of a firmer perception that the Federal reserve will keep the tight stance for longer.
Further weakness in gold should confront the 2022 low at $1,680 (July 21) prior to the 2021 low at $1,1676 (March 8) and closely followed by the June 2020 low at $1,670 (June 5). Contrarily, the so far weekly top at $1,726 (September 6) emerges as the initial hurdle before the 55-day SMA at $1,756 and the weekly top at $1,765 (August 25). Once cleared, the August peak at $1,807 (August 10) should re-emerge on the horizon ahead of the 200-day SMA at $1,834 and the June high at $1,879 (June 13).
Resistance levels: $1,726 $1,745 $1,765 (4H chart)
Support levels: $1,688 $1,680 $1,670 (4H chart)
-637980860375983732.png)
CRUDE WTI
Renewed demand concerns and rising jitters over the continuation of the lockdown measures in Chinese cities added to the ongoing recession woes - as both the ECB and the Federal Reserve are expected to raise the interest rates at their meetings later this month – and forced prices of the WTI to reverse two consecutive sessions with gains, refocusing instead on the area of recent lows around the $86.00 mark per barrel.
On the positives for the WTI, the Iran-West talks to revive the 2015 nuclear deal that could eventually motivate around a million of barrels of Iranian oil to return to the market seem to have found new points of divergence between the parties, which could all result in extra delays.
Later in the week, the API and the EIA will report on the weekly US crude oil supplies for the week ended on September 2.
Immediately to the downside for WTI emerges the August low at $85.74 (August 16) ahead of the 81.94 level (low January 24) and followed by the key round level at $80.00. The loss of the latter should open the door to a deeper pullback to the 2022 low at $74.30 (January 3). On the upside, there is an initial hurdle at the 200-day SMA at $96.30 ahead of the weekly peak at $97.65 (August 30) the psychological $100.00 mark. If the commodity clears this key level, then it could dispute the weekly high at $101.87 (July 29) ahead of another weekly top at $104.44 (July 19).
Resistance levels: $90.37 $92.51 $97.65 (4H chart)
Support levels: $85.97 $85.72 $81.90 (4H chart)
-637980860965219391.png)
DOW JONES
US markets returned to normal activity and extended the recent bearish performance for yet another session on Tuesday.
Indeed, US equities traded on the defensive as concerns over a tighter-for-longer Fed and speculation of a looming recession remained on the rise and weighed heavily on investors’ sentiment. In addition, the ECB is also expected to hike rates later this week, with consensus tilted to a 75 bps rate raise.
That said, the Dow Jones retreated 0.64% to 31,118, the S&P500 dropped 0.58% to 3,901 and the tech-heavy Nasdaq Composite shed 0.91% to 11,525.
The Dow Jones remains under pressure and approaches the 78.6% Fibo retracement of the July-August rally (31,029). So far, the initial support emerges at the September low at 31,048 (September 6) followed by the July low at 30,143 (July 14) and the 2022 low at 29,653 (June 17). On the other hand, the September high at 32,026 (September 2) turns up as the next up barrier followed by the 100-day SMA at 32,339 and the 33,364 level (August 26 top). The surpass of this region should put the key 200-day SMA at 33,640 back on the radar prior to the August high at 34,281 (August 16). Further up comes the April top at 35,492 (April 21) ahead of the February peak at 35,824 (February 9). The RSI shed further ground and flirted with 32.
Top Performers: J&J, Boeing, Visa A
Worst Performers: 3M, Intel, Goldman Sachs
Resistance levels: 32,026 33,366 34,281 (4H chart)
Support levels: 31,048 30,982 30,143 (4H chart)
-637980861249050008.png)
MACROECONOMIC EVENTS
All Information & Updates provided by:

All information relating to the financial markets available on this page has been prepared and issued by FXStreet (Forexstreet SL, Spain, Reg: B62498233) on the basis of publicly available information and all information believed to be reliable and does not conflict with Kuwaiti local laws, and all necessary care has been taken to before the company to ensure that the facts mentioned are correct from the source.
NCM Investment nor any of its directors or employees shall in any way be held responsible for the contents of this news, and the information contained on this page is intended only to provide clients with publicly available information and should not be construed as investment advice, report or analysis and/or constitute an offer or invitation to buy or sell financial instruments of any kind.
RISK WARNING: Forex and CFDs are highly risky leveraged products, as losses can exceed deposits. Please ensure you understand all the risks and take independent advice if necessary. NCM will segregate the clients based on the criteria of the regulator and its bylaws. NCM does not provide any advisory service; the material published does not constitute advice or a recommendation for a transaction in any financial instrument. NCM accepts no responsibility for any use of the content presented and any consequences of that use. Anyone acting on the information provided does so at their own risk.