
- Contact Us:
-

-

-

-


Daily Market Updates
08 Sep 2022
EURUSD
Rollercoaster day for the risk complex.
Indeed, EUR/USD made an impressive U-turn and rebounded from the 0.9870 region to just pips beyond the psychological parity level in response to an equally violent change of direction in the greenback.
On the latter, the US Dollar Index (DXY) printed new highs near 110.80 - an area last visited in mid-June 2002 – juts to reverse all that advance and return to the 109.70 area at the end of Wednesday’s session, mainly after market participants perceived as dovish the speech by Vice Chair L.Brainard.
Back to the ECB, investors kept leaning towards a 75 bps rate hike on Thursday. This scenario has been particularly on the rise after the advanced inflation figures in the euro area showed inflation pressures did not give any signs of abating in August.
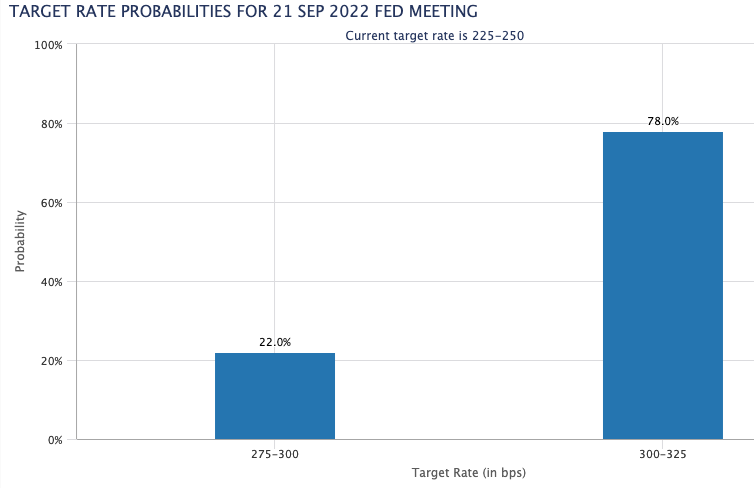
Same macros kept underpinning the solid uptrend in the greenback, in the meantime, as a 75 bps rate hike remains almost fully priced in. On this, CME Group’s FedWatch Tool sees the probability of such a rate hike at nearly 80% for the time being.
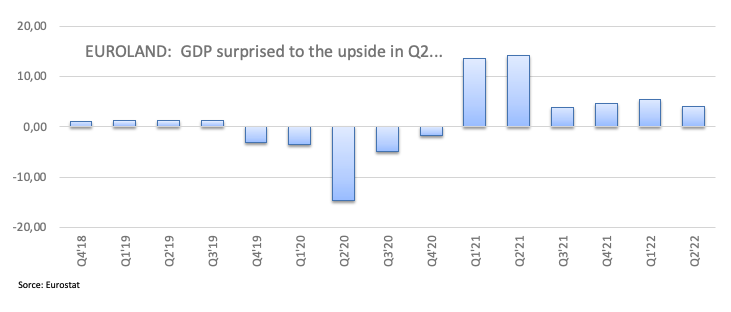
In the euro calendar, another revision of Q2 GDP figures now sees the economy in the euro area expanding 4.1% YoY and 0.8% QoQ.
Across the pond, MBA Mortgage Applications contracted 0.8% in the week to September 2 and the trade balance shrank to $70.7B in July.
From the Fed’s Beige Book, contacts see a weaker demand in the next 6-12 months, while most districts noted consumer spending remained consistent and price growth lost some traction.
The immediate contention in case of further weakness in EUR/USD appears at the 2022 low at 0.9863 (September 6) just ahead of the December 2002 low at 0.9859 and prior to the October 2002 low at 0.9685 (October 21). On the contrary, there is an initial barrier at the weekly peak at 1.0090 (August 26) prior to the interim 55-day SMA at 1.0169 and the 1.0202 level (August 17 high). The surpass of the latter could then confront the August top at 1.0368 (August 10) before the weekly peak at 1.0615 (June 27). The daily RSI quickly bounced and regained the area above 37.
Resistance levels: 1.0002 1.0033 1.0079 (4H chart)
Support levels: 0.9863 0.9859 0.9685 (4H chart)
-637981720293430930.png)
USDJPY
USD/JPY remained unstoppable for yet another session and this time printed new 24-year highs around the 145.00 mark on Wednesday, easing some ground afterwards pari passu with the precipitated drop in the dollar.
Indeed, the initial solid performance of the US dollar underpinned the third consecutive daily gain in the pair despite US yields taking a breather from the ongoing march north. The later move could be attributed to the beter performance of equities, and further weakening of government bond yields.
No changes to the underlying bullish view in spot, as the Fed-BoJ widening divergence regarding monetary policy has been the almost exclusive driver behind the intense move higher in the pair since March.
The Japanese docket saw preliminary figures for the Coincident Index at 100.6 in July and 99.6 when it comes to the Leading Economic Index.
Further up for USD/JPY comes the 2022 top at 144.99 (September 7) prior to 145.41 (August 21 1998 peak) and ahead of the all-time high at 147.67 (August 11 1998). Adversely, there is an interim support at the 55-day SMA at 136.43 seconded by the weekly low at 135.80 (August 23) and the 100-day SMA at 133.74. The loss of the latter could put another weekly low at 131.73 (August 11) back on the radar prior to the August low at 130.39 (August 2) and just followed by the psychological 130.00 level. The daily RSI remained immersed in the overbought territory around 80.
Resistance levels: 144.99 145.41 146.97 (4H chart)
Support levels: 139.91 139.05 138.26 (4H chart)
-637981722693616207.png)
GBPUSD
There seems to be no respite in the bearish momentum surrounding the British pound, as GBP/USD debilitated further and approached the 1.1400 neighbourhood for the first time since mid-March 2020 midweek. Cable, however, managed to regain the 1.1500 barrier and beyond later in the session following the sudden drop in the dollar.
Indeed, the combination of the stronger dollar and the poor outlook for the UK economy continued to weigh on the quid during early trade, while the small bout of optimism following the designation of L.Truss at Number 10 appears to have already fizzled out.
From the BoE, the Monetary Policy Report Hearings saw MPC member S.Tenreyro saying that demand is already weakening and the effects of the BoE tightening are yet to be seen, at a time when she favoured further rate hikes until there is clear evidence of the impact on inflation. Her colleague H.Pill suggested that if QT is causing too much tightening, that could be offset with less interest rate increase. Member C.Mann noted that more forceful bank rate moves could prompt a policy hold or a reversal later. Finally, Governor A.Bailey said that UK growth has been grinding slow since the early recovery from the pandemic. Bailey also said that the UK is heavily exposed to gas prices and that upcoming fiscal announcement will help frame the BoE’s policy.
Data wise in the UK, Halifax House Price Index rose 0.4% MoM in August and 11.5% over the last twelve months.
In case GBP/USD breaches the 2022 low at 1.1404 (September 7), there are no support levels of note until the weekly low at 1.1060 (March 1985). Inversely, the weekly peak at 1.1608 (September 6) emerges as the initial up barrier followed by the weekly high at 1.1900 (August 26) and the 55-day SMA, today at 1.1964. Further north, the round level at 1.2000 could re-emerge on the horizon prior to the August top at 1.2293 (August 1) seconded by the weekly peak at 1.2405 (June 16). North from here appears the 1.2666 level (May 27 top) before the psychological 1.3000 mark. The daily RSI sank further into the oversold territory near 22.
Resistance levels: 1.1523 1.1608 1.1693 (4H chart)
Support levels: 1.1404 1.1060 1.0805 (4H chart)
-637981722139610802.png)
AUDUSD
AUD/USD saw its downside accelerate on Wednesday and flirted with the area below the 0.6700 mark, recording at the same time new 2-month lows. The pair, however, regained poise in response to the late and strong knee-jerk in the greenback and ended the session well in the positive territory.
Further suffering in the risk complex came after the initial march higher in the greenback, which put the Aussie dollar under extra pressure and forced it to navigate levels close to the 2022 low.
Spot, in the meantime, managed to offset the weaker-than-expected trade results in China during August, which also exacerbated the selling bias in the Aussie dollar earlier on Wednesday.
Positive results from the Aussie calendar also lent some support to the currency after the Ai Group Services Index improved to 53.3 in August and the GDP Growth Rate expanded 3.6% YoY in Q2 and 0.9% vs. the previous quarter.
Further decline in AUD/USD needs to leave behind the September low at 0.6698 (September 7) to confront the 2022 low at 0.6681 (July 14). Down from here appears the May 2020 low at 0.6372 (May 4) prior to the weekly low at 0.6253 (April 21 2020). On the flip side, the 55-day SMA at 0.6895 continues to offer interim resistance before the 100-day SMA at 0.6975 and the weekly peak at 0.7008 (August 26). Once cleared, the focus of attention is expected to gyrate to the 200-day SMA at 0.7115 prior to the August high at 0.7136 (August 11) and seconded by the June top at 0.7282 (June 3). The daily RSI traded closer to the oversold territory near 33.
Resistance levels: 0.6765 0.6832 0.6855 (4H chart)
Support levels: 0.6699 0.6681 0.6567 (4H chart)
-637981723183616665.png)
GOLD
Prices of the yellow metal regained some composure and advanced markedly on Wednesday, revisiting the $1,720 zone per ounce troy after briefly dipping to 3-day lows near $1,690.
Bullion managed to set aside the recent selling bias and reclaimed the $1,700 mark and above following another U-turn in the greenback, all after the US Dollar Index (DXY) corrected sharply lower from fresh 20-year near 110.80.
The daily uptick in the precious metal also found some support in the corrective downside in US yields across the curve, despite the underlying bullish bias remained largely unchanged and underpinned by Fed’s tightening prospects.
No changes to the downside in gold, as it remains supported by the 2022 low at $1,680 (July 21) ahead of the 2021 low at $1,1676 (March 8) and just before the June 2020 low at $1,670 (June 5). On the upside, the weekly peak at $1,726 (September 6) should act as a minor barrier ahead of the 55-day SMA at $1,754 and the weekly high at $1,765 (August 25). If the metal leaves behind the latter, then the August top at $1,807 (August 10) could return to the traders’ radar prior to the 200-day SMA at $1,834 and the June peak at $1,879 (June 13).
Resistance levels: $1,719 $1,726 $1,750 (4H chart)
Support levels: $1,691 $1,680 $1,670 (4H chart)
-637981723529997382.png)
CRUDE WTI
Prices of the barrel of the American reference for the sweet light crude oil extended the leg lower to levels last seen in late January well south of the $83.00 mark on Wednesday.
Recession concerns returned to the fore and weighed heavily on traders’ sentiment midweek, offsetting the initial bull run to the proximity of the $88.00 mark after Russia threatened to halt supplies of crude oil and gas (in case the EU plans to cap prices of Russian energy resources prospered).
In addition, poor results from Chinese trade data for the month of August showed crude oil imports shrank nearly 10% from a year earlier, all adding to the weak prospects for crude oil demand.
Later in the NA session, the API will publish its report for US crude oil supplies for the week ended on September 2.
The continuation of the decline in WTI now targets the 81.94 level (low January 24), which precedes the key round level at $80.00 ahead of the 2022 low at $74.30 (January 3). In the opposite direction, the September peak at $90.37 (September 5) emerges as the immediate hurdle ahead of the 200-day SMA at $96.46. The trespass of this level exposes the weekly high at $97.65 (August 30) just before the psychological $100.00 mark.
Resistance levels: $87.75 $90.37 $92.51 (4H chart)
Support levels: $82.27 $81.90 $77.82 (4H chart)
-637981724812156190.png)
DOW JONES
US equities tracked by the Dow Jones left behind two consecutive daily pullbacks and advanced strongly on Wednesday.
In fact, while investors remained focused on the Fed’s tightening plans and a likely 75 bps rate hike at the September 21 meeting, the abrupt change of direction in the dollar and the negative price action in US yields accompanied the bounce in stocks as well as somewhat improved the mood among investors.
All in all, the Dow Jones advanced 1.33% to 31,558, the S&P500 gained 1.62% to 3,971 and the tech reference Nasdaq Composite rose 1.62% to 11,732.
A more convincing rebound in the Dow Jones faces the immediate up barrier at the September top at 32,026 (September 2) ahead of the 100-day SMA at 32,308. Up from here aligns the 33,364 level (August 26 top), which precedes the key 200-day SMA at 33,618. Once this area is cleared, then a probable test of the August top at 34,281 (August 16) could re-emerge on the horizon prior to the April peak at 35,492 (April 21) and the February high at 35,824 (February 9). In another way, the September low at 31,048 (September 6) is expected to hold the initial test followed by the July low at 30,143 (July 14) and the 2022 low at 29,653 (June 17). The RSI regained traction and bounced above 37.
Top Performers: 3M, Walgreen Boots, Walmart
Worst Performers: Chevron, Caterpillar, Apple
Resistance levels: 32,026 33,319 34,281 (4H chart)
Support levels: 31,048 30,982 30,143 (4H chart)
-637981725223564496.png)
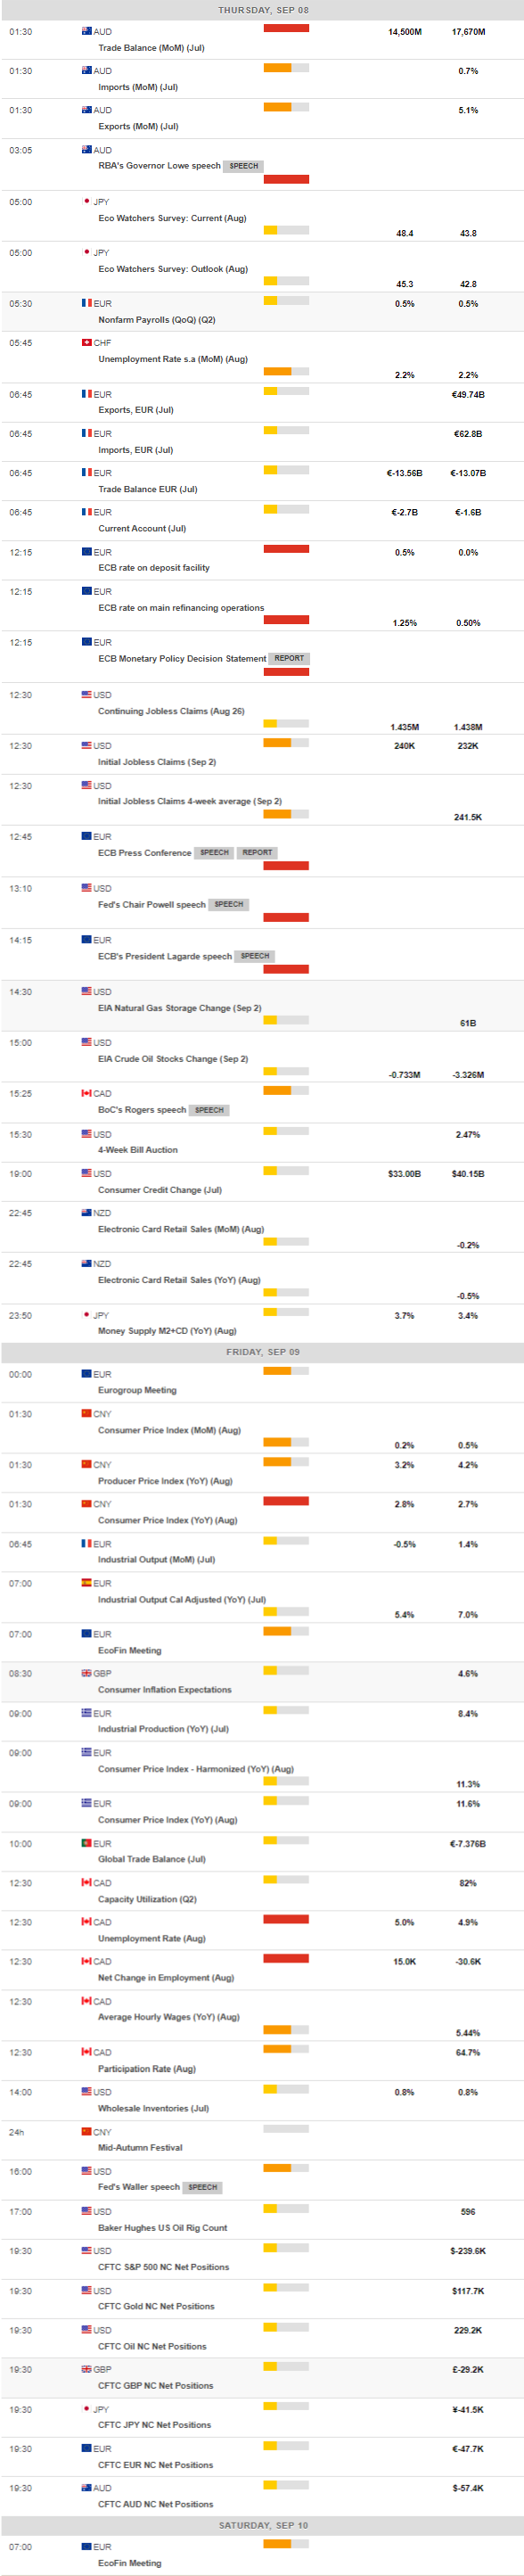
MACROECONOMIC EVENTS
All Information & Updates provided by:

All information relating to the financial markets available on this page has been prepared and issued by FXStreet (Forexstreet SL, Spain, Reg: B62498233) on the basis of publicly available information and all information believed to be reliable and does not conflict with Kuwaiti local laws, and all necessary care has been taken to before the company to ensure that the facts mentioned are correct from the source.
NCM Investment nor any of its directors or employees shall in any way be held responsible for the contents of this news, and the information contained on this page is intended only to provide clients with publicly available information and should not be construed as investment advice, report or analysis and/or constitute an offer or invitation to buy or sell financial instruments of any kind.
RISK WARNING: Forex and CFDs are highly risky leveraged products, as losses can exceed deposits. Please ensure you understand all the risks and take independent advice if necessary. NCM will segregate the clients based on the criteria of the regulator and its bylaws. NCM does not provide any advisory service; the material published does not constitute advice or a recommendation for a transaction in any financial instrument. NCM accepts no responsibility for any use of the content presented and any consequences of that use. Anyone acting on the information provided does so at their own risk.