
- Contact Us:
-

-

-

-


Daily Market Updates
09 Sep 2022
EURUSD
EUR/USD could not sustain the initial uptick to the 1.0030 region – or multi-session tops – and sparked a noticeable drop well south of the parity level soon after the ECB interest rate decision and the press conference by Chairwoman C.Lagarde. The pair, however, managed to recoup most of that ground lost towards the end of the session.
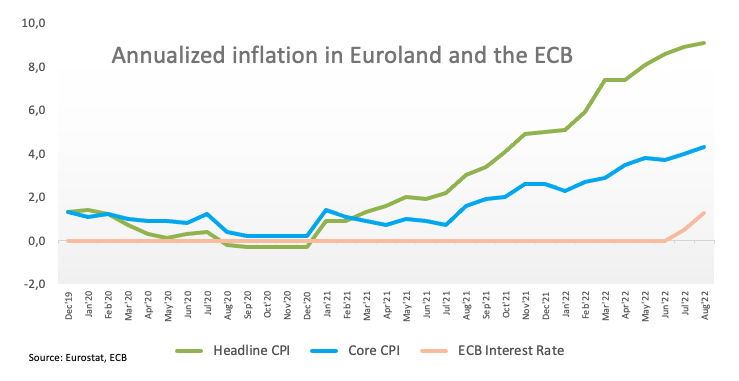
In fact, the European Central Bank (ECB) went big and delivered the largely anticipated 75 bps rate hike, taking the key interest rate to 1.25% at its event on Thursday. The bank’s updated macroeconomic projections were pretty optimistic when it comes to economic growth, as the staff now see the region expanding 3.1% in 2022, 0.9% in the next year and 1.9% in 2024. Inflation-wise, the staff expects consumer prices to rise an average 8.1% this year, 5.5% in 2023 and 2.3% in 2024.
At her usual post-meeting press conference, Chair Lagarde reiterated that future policy decisions remain data dependent and the Governing Council will make those decisions on a meeting-by-meeting basis. Lagarde declined to comment on the size of the next hike, although he stressed that 75 bps is not the norm and neither the current rates are the neutral ones. The central bank is expected to keep raising rates, as inflation remains well above the 2% target.
When it came to inflation, Lagarde blamed the weaker currency and supply bottlenecks, adding that elevated prices in food and energy are expected to remain high for a longer period. She acknowledged that inflation expectations might have started to gain upside traction, which warrant monitoring.
Despite the ECB not targeting any exchange rate, Lagarde said the ongoing depreciation of the single currency has been noted.
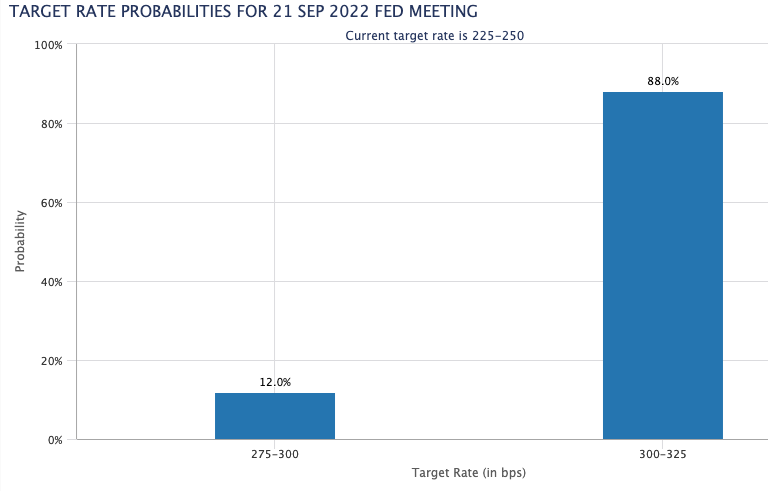
On the USD-side of the equation, Chief Powell participated in a virtual discussion and once again reiterated the Fed’s firm pledge to bring inflation down to the bank’s goal. He emphasized the need to act now to prevent the social costs of inflation. Still on inflation, Powell largely pointed to the pandemic as the source of higher prices via supply constraints. Following Powell, the possibility of a 75 bps rate hike later in the month climbed to nearly 90% when tracked by CME Group’s FedWatch Tool.
With both events now in the rear-view mirror, the greenback moved past the 110.00 mark when tracked by the US Dollar Index (DXY), just to reverse that move afterwards and return to the 109.60 region.
In the US money markets, yields rose across the curve, while on the other side of the Atlantic, the German 10y benchmark note climbed to new highs near 1.75% for the first time since last June.
In the docket, Initial Claims rose by 222K in the week to September 3.
The continuation of the selling pressure in EUR/USD continues to target the 2022 low at 0.9863 (September 6) prior to the December 2002 low at 0.9859 and ahead of the October 2002 low at 0.9685 (October 21). On the flip side, the weekly high at 1.0090 (August 26) emerges as the initial hurdle for bulls seconded by the temporary 55-day SMA at 1.1060 and the 1.0202 level (August 17 top). If the pair breaks above this level it could pave the wave for the August peak at 1.0368 (August 10) ahead of the weekly high at 1.0615 (June 27). The daily RSI dropped to the sub-42 area.
Resistance levels: 1.0029 1.0079 1.0104 (4H chart)
Support levels: 0.9930 0.9863 0.9859 (4H chart)
-637982573388582812.png)
USDJPY
USD/JPY successfully reversed the initial drop to the 143.30 region and ended up reclaiming the 144.00 barrier and above on Thursday.
The pair saw its fourth consecutive daily advance backed by the usual suspects, namely the relentless move higher in the greenback as well as the unabated march north in US yields across the curve.
However, the Japanese currency is expected to be under scrutiny in the next sessions after an official opened the door to some action by the government in light of the intense depreciation of the yen to 24-year lows vs. the dollar.
Busy day in the Japanese docket, as final figures saw the GDP Growth Annualized expand above the preliminary readings at 3.5% in Q2 and 0.9% QoQ, while Bank Lending expanded 1.9% in the year to August and Foreign Bond Investment rose to ¥149.1B in the week to September 3.
No changes to the topside in USD/JPY, as bulls need to overcome the 2022 peak at 144.99 (September 7) ahead of the 145.41 level (August 21 1998 peak) and before the all-time high at 147.67 (August 11 1998). On the contrary, the 55-day SMA at 136.58 should offer interim contention ahead of the weekly low at 135.80 (August 23). Down from here emerges the 100-day SMA at 133.89 prior to another weekly low at 131.73 (August 11). Once cleared, a potential test of the August low at 130.39 (August 2) could resurface on the horizon closely followed by the psychological 130.00 mark. The daily RSI kept navigating in the overbought territory just above 79.
Resistance levels: 144.99 145.41 146.97 (4H chart)
Support levels: 143.32 140.24 139.05 (4H chart)
-637982574581622716.png)
GBPUSD
GBP/USD faded Wednesday’s positive session and resumed the downside along with another breach of the 1.1500 key support on Thursday.
The resumption of the selling bias in the sterling came on the back of further gains in the greenback and US yields across the board, particularly following the ECB gathering and the speech by Chief Powell.
The UK docket remained empty on Thursday, although PM L.Truss was on the wire and announced that a typical household will pay a maximum of £2,500 a year on their energy bills over the next couple of years from October 1. She expects the intervention of energy to curb peak inflation by up to 5%.
If the selling pressure picks up further impulse, GBP/USD should retest the 2022 low at 1.1404 (September 7) followed by a deeper drop to the weekly low at 1.1060 (March 1985). Adversely, occasional bouts of strength in cable should see the initial resistance at the September high at 1.1608 (September 6) prior to the weekly top at 1.1900 (August 26) and the 55-day SMA, today at 1.1952. The surpass of this region exposes the round level at 1.2000 ahead of the August peak at 1.2293 (August 1) and the weekly high at 1.2405 (June 16). If the recovery picks up extra pace, then the 1.2666 level (May 27 top) could emerge on the horizon before the psychological 1.3000 yardstick. The daily RSI remained in the oversold territory near 25.
Resistance levels: 1.1559 1.1608 1.1693 (4H chart)
Support levels: 1.1460 1.1404 1.1060 1.0805 (4H chart)
-637982574258153300.png)
AUDUSD
AUD/USD resumed the weekly leg lower and faded Wednesday’s uptick, returning to the sub-0.6800 region and trading at shouting distance from 2-month lows near the 0.6700 neighbourhood on Thursday.
Another solid session saw the greenback gather extra steam in the wake of the ECB interest rate decision and the speech by Chair Powell, all morphing into extra downside pressure in the risk complex.
A broad-based positive performance in the commodity galaxy did not help the Aussie dollar either after copper prices extended the weekly recovery and prices of the iron ore surpassed the $100 mark per tonne.
No reaction in AUD following the speech by Governor P.Lowe on “Inflation and Monetary Policy Framework”, where he sounded hawkish when it came to inflation, although he left the door open to smaller interest rate hikes as the OCR increases. Lowe added that the central bank expects more rate hikes in the next months and suggested that there is an important demand element behind the elevated inflation. Lowe deemed as “pretty small” a potential benefit from shifting to passive to active QT.
Data wise Down Under, the trade surplus shrank to A$8.733B in July.
Extra losses in AUD/USD could well see the September low at 0.6698 (September 7) revisited ahead of the 2022 low at 0.6681 (July 14). The loss of this zone could spark a deeper decline to the May 2020 low at 0.6372 (May 4) ahead of the weekly low at 0.6253 (April 21 2020). Just on the opposite, the initial up-barrier comes at the 55-day SMA at 0.6893 prior to the 100-day SMA at 0.6970. Further up emerges the weekly high at 0.7008 (August 26) seconded by the 200-day SMA at 0.7114. If the recovery persists, then the August top at 0.7136 (August 11) could return to the radar ahead of the June peak at 0.7282 (June 3). The daily RSI breached the 37 level.
Resistance levels: 0.6774 0.6832 0.6855 (4H chart)
Support levels: 0.6713 0.6699 0.6681 (4H chart)
-637982574940246269.png)
GOLD
Gold prices sharply reversed Wednesday’s positive session and returned to the proximity of the key support at the $1,700 mark per ounce troy on Thursday.
Further strength in the greenback coupled with daily gains in US yields across the curve forced the precious metal to retreat from the $1,730 zone, or daily highs.
In addition, Chief Powell reinforced the case for further rate hikes by the Fed – and therefore the chances of a 75 bps hike later in the month – which eventually hurt the sentiment around bullion.
Immediately to the downside in gold comes the round level at $1,700, which precedes the 2022 low at $1,680 (July 21. The breach of this level could lead up to a visit of the 2021 low at $1,1676 (March 8) and the June 2020 low at $1,670 (June 5). Conversely, the weekly high at $1,728 (September 8) offers minor resistance prior to the 55-day SMA at $1,752 and the weekly top at $1,765 (August 25). The breakout of this level could open the door to the August peak at $1,807 (August 10) before the 200-day SMA at $1,833 and the June high at $1,879 (June 13).
Resistance levels: $1,728 $1,750 $1,765 (4H chart)
Support levels: $1,704 $1,691 $1,680 (4H chart)
-637982575314999593.png)
CRUDE WTI
WTI prices managed to reclaim part of the ground lost in the two previous sessions and regained the $84.00 mark per barrel and beyond on Thursday.
The move higher was underpinned by the likelihood that Russia could halt its exports of oil and gas to some countries.
Indeed, those threats by Russia seem to have been enough to offset omnipresent demand concerns stemming from a likely global slowdown – as a consequence of major central banks’ tightening - the continuation of Chinese lockdowns in major cities and an unexpected strong build in US crude oil inventories.
Indeed, on the latter, the EIA said US crude oil stockpiles increased by 8.844M barrels in the week to September 2, while supplies at Cushing shrank by 0.501M barrels and gasoline inventories rose by 0.333M barrels.
The decline in prices of the WTI seems to have met support at the September low at $81.21 (September 8). If prices break below this level, then a potential move to the key round level at $80.00 could start shaping up prior to the 2022 low at $74.30 (January 3). Next on the upside appears the September high at $90.37 (September 5) before the 200-day SMA at $96.54. The trespass of the latter should introduce a test of the weekly top at $97.65 (August 30) prior to the psychological $100.00 mark.
Resistance levels: $84.24 $87.75 $90.37 (4H chart)
Support levels: $81.18 $77.82 $76.71 (4H chart)
-637982576054101322.png)
DOW JONES
Equities tracked by the three major US stock indices set aside the initial Powell-led pessimism and regained both the smile and the positive ground on Thursday.
Indeed, investors saw past another hawkish message from Chef Powell at his speech earlier in the session, when he once again reiterated the Fed’s commitment to tackle the current elevated inflation.
That said, the Dow Jones rose 0.45% to 31,724, the S&P500 advanced 0.47% to 3,998 and the tech-heavy Nasdaq Composite gained 0.15% to 11,810.
The September peak at 32,026 (September 2) now acts as the next barrier for bulls prior to the 100-day SMA at 32,282 and the 33,364 level (August 26 high). Further recovery could revisit the key 200-day SMA at 33,599 before the August top at 34,281 (August 16). North from here aligns the April peak at 35,492 (April 21) followed by the February high at 35,824 (February 9). On the contrary, initial support remains at the September low at 31,048 (September 6) ahead of the July low at 30,143 (July 14) and prior to the 2022 low at 29,653 (June 17). The RSI picked up some pace and surpassed 40.
Top Performers: JPMorgan, Salesforce.com, Goldman Sachs
Worst Performers: Apple, Honeywell, 3M
Resistance levels: 31,783 32,026 32,276 (4H chart)
Support levels: 31,048 30,982 30,143 (4H chart)
-637982576414235015.png)
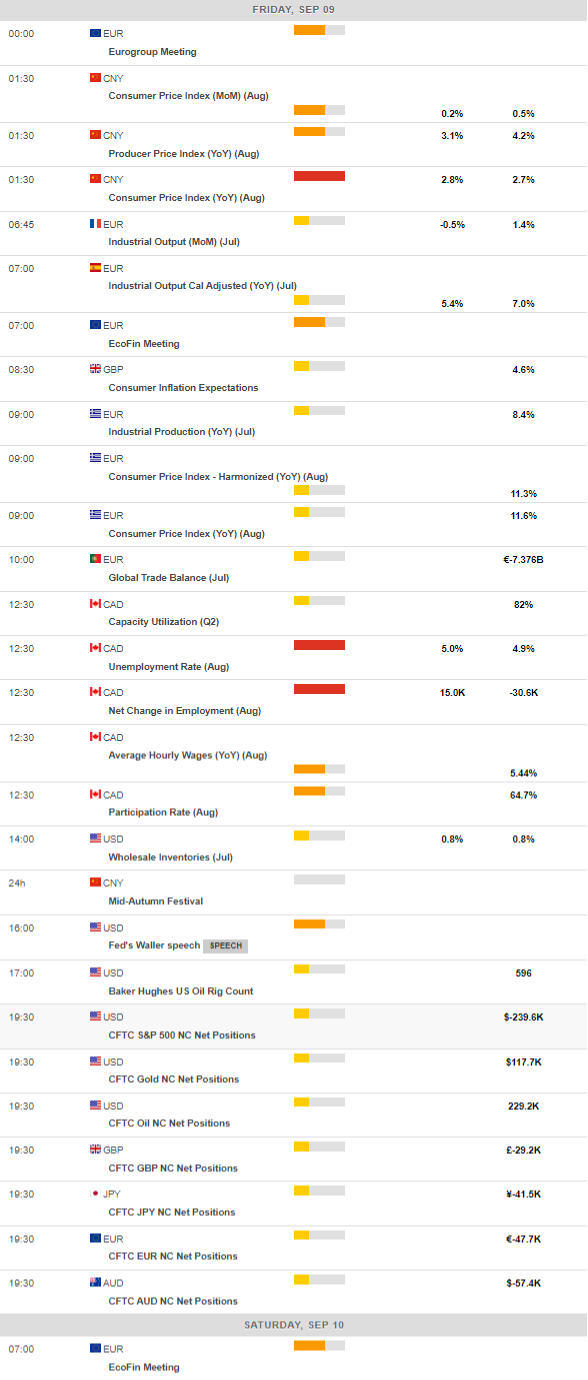
MACROECONOMIC EVENTS
All Information & Updates provided by:

All information relating to the financial markets available on this page has been prepared and issued by FXStreet (Forexstreet SL, Spain, Reg: B62498233) on the basis of publicly available information and all information believed to be reliable and does not conflict with Kuwaiti local laws, and all necessary care has been taken to before the company to ensure that the facts mentioned are correct from the source.
NCM Investment nor any of its directors or employees shall in any way be held responsible for the contents of this news, and the information contained on this page is intended only to provide clients with publicly available information and should not be construed as investment advice, report or analysis and/or constitute an offer or invitation to buy or sell financial instruments of any kind.
RISK WARNING: Forex and CFDs are highly risky leveraged products, as losses can exceed deposits. Please ensure you understand all the risks and take independent advice if necessary. NCM will segregate the clients based on the criteria of the regulator and its bylaws. NCM does not provide any advisory service; the material published does not constitute advice or a recommendation for a transaction in any financial instrument. NCM accepts no responsibility for any use of the content presented and any consequences of that use. Anyone acting on the information provided does so at their own risk.