
- Contact Us:
-

-

-

-


Daily Market Updates
12 Sep 2022
EURUSD
The intense improvement in the appetite for the risk complex lifted EUR/USD to new 3-week highs past 1.0100 at the end of the week, breaking at the same time the prevailing multi-session consolidative phase in place since mid-August.
The uptick in spot came in response to the deep knee-jerk in the greenback, as investors continued to digest the unprecedented rate hike by the ECB, the hawkish tone from Chairwoman Lagarde at her press conference and the equally firm message from Chief Powell at his participation in a discussion panel.
News from the ECB event cited Board member Villeroy, who did not rule out a limited recession at the time when he supported Chair Lagarde after indicating that the central bank did not create a new jumbo habit. His colleague Müller justified the magnitude of the rate hike in the rapid pace of inflation. More along the line, member Knot suggested that more steps should come after stressing that the 75 bps rate hike was a powerful signal, while member Kazimir prioritized the continuation of the normalization process.
In the calendar, Wholesale Inventories expanded 0.6% MoM in July in what was the sole scheduled release on both sides of the Atlantic on Friday.
The upbeat mood in the risk-associated universe, however, did not echo in the debt markets, as both US and German 10y yields erased part of the recent advance.
For the rebound in EUR/USD to get more serious it should now surpass the September top at 1.0113 (September 9) ideally in the near term. Once this level is cleared, the temporary 55-day SMA at 1.0152 should come to the fore ahead of the 1.0202 level (August 17 peak), which also coincides with the 7-month resistance line. Beyond the latter, the selling pressure is expected to subside and allow a probable challenge of the August high at 1.0368 (August 10) prior to the weekly top at 1.0615 (June 27). Contrarily, the 2022 low at 0.9863 (September 6) still emerges as the big magnet for bears before the December 2002 low at 0.9859 and seconded by the October 2002 low at 0.9685 (October 21). The daily RSI leapt to just past the 49 level.
Resistance levels: 1.0113 1.0202 1.0364 (4H chart)
Support levels: 0.9930 0.9863 0.9859 (4H chart)
-637985031680715714.png)
USDJPY
USD/JPY saw its 4-session positive streak sharply trimmed on Friday after dropping to the 141.50 region, where some initial contention seems to have emerged.
The acute decline in the greenback might have followed some profit taking in light of the recent strong gains in the US Dollar Index (DXY) to new 20-year tops around 110.80 (September 7).
Also collaborating with the downbeat mood in the pair came the daily pullback in US yields in the belly and the long end of the curve.
Despite Friday’s negative session, USD/JPY closed its fourth consecutive week with gains, and this time including a new 24-year higher around the 145.00 mark on September 7.
Considering the unabated depreciation of the Japanese yen, BoJ Governor H.Kuroda said earlier on Friday that rapid currency movements favour uncertainty. In the same line, finmin Suzuki reiterated that sharp fluctuations in the FX are undesirable, adding that a stable performance in FX is crucial when it comes to reflect underlying economic principles. Suzuki also added that FX moves are under scrutiny amidst a strong sense of urgency.
The Japanese calendar was empty on Friday, whereas yearly results from Machine Tools Orders are expected on Monday.
The resumption of the uptrend in USD/JPY continues to aim at the 2022 high at 144.99 (September 7) prior to the 145.41 level (August 21 1998 top) and ahead of the all-time peak at 147.67 (August 11 1998). On the other hand, there is an interim hurdle at the 55-day SMA at 136.72. If breached, then a potential drop to the weekly low at 135.80 (August 23) should start shaping up before the 100-day SMA at 134.03 and ahead of another weekly low at 131.73 (August 11). The loss of this level unveils the August low at 130.39 (August 2), which closely anticipates the psychological 130.00 yardstick. The daily RSI abandoned the overbought territory and breached 69.
Resistance levels: 144.99 145.41 146.97 (4H chart)
Support levels: 141.50 140.24 139.05 (4H chart)
-637985032442003403.png)
GBPUSD
The weak performance of the greenback and the better tone among the riskier assets lifted spirits around the sterling and sponsored decent gains in GBP/USD to the area beyond 1.1600 the figure on Friday. Part of that strong daily advance, however, later faded.
Following Friday’s positive move, cable managed to finally close a week with gains after three consecutive pullbacks. On a monthly view, however, the negative streak reaches the fourth month in a row so far.
The resumption of the selling bias in the sterling came on the back of further gains in the greenback and US yields across the board, particularly following the ECB gathering and the speech by Chief Powell.
No data releases scheduled in the UK docket on Friday left all the attention to a busy Monday, where GDP figures, trade balance and Industrial Production are all due.
The continuation of the rebound in GBP/USD is expected to meet the next hurdle of note at the weekly peak at 1.1900 (August 26) prior to the 55-day SMA at 1.1940. If the pair breaks above the latter, it could lead up to a potential visit to the round level at 1.2000 before the August high at 1.2293 (August 1) and the weekly top at 1.2405 (June 16). Further north appears the 1.2666 level (May 27 top) seconded by the key 200-day SMA, today at 1.2744. Adversely, the 2022 low at 1.1404 (September 7) is seen offering initial contention ahead of the weekly low at 1.1060 (March 1985). The daily RSI left behind the oversold territory and trespassed 35.
Resistance levels: 1.1648 1.1693 1.1760 (4H chart)
Support levels: 1.1550 1.1460 1.1404 (4H chart)Ç
-637985032102478236.png)
AUDUSD
AUD/USD rose to multi-day highs and revisited the 0.6880 region on Friday.
Indeed, and in line with the rest of the risk-linked galaxy, the Aussie dollar managed to regain strong buying interest and embarked on a strong recovery pari passu with the equally acute pullback in the greenback.
Further legs to the pair came from the positive session in copper and iron ore amidst the generalized mixed performance of the rest of the commodities.
No data releases were published in the Australian calendar on Friday. The next salient event will be the Consumer Confidence gauge by Westpac on September 13.
Immediately to the upside in AUD/USD turns up the 55-day SMA at 0.6891 ahead of the 100-day SMA at 0.6966, all preceding the psychological 0.7000 mark and closely followed by the weekly top at 0.7008 (August 26). The surpass of the latter could pave the way for a test of the 200-day SMA at 0.7113 prior to the August peak at 0.7136 (August 11) and the June high at 0.7282 (June 3). The initial down barrier emerges at the September low at 0.6698 (September 7) before the 2022 low at 0.6681 (July 14). Once this level is cleared, the pair could challenge the May 2020 low at 0.6372 (May 4) before the weekly low at 0.6253 (April 21 2020). The daily RSI leaps to the proximity of 48.
Resistance levels: 0.6877 0.6923 0.6956 (4H chart)
Support levels: 0.6713 0.6699 0.6681 (4H chart)
-637985032789740330.png)
GOLD
Prices of the ounce troy of gold extended the erratic activity for yet another session on Friday, leaving behind the previous day’s drop and regaining the vicinity of the $1,720 level.
The renewed weakness in the US dollar sponsored the pick-up in the demand for the yellow metal, which was additionally underpinned by the knee-jerk in yields in the 10y and 30y notes.
The daily uptick in bullion, in addition, came despite further hawkish rhetoric from FOMC’s governors just before the Fed’s blackout period.
While gold seems to have moved to a consolidative phase, the immediate up barrier emerges at the weekly top at $1,729 (September 9) ahead of the 55-day SMA at $1,750. North from here aligns the weekly peak at $1,765 (August 25) prior to the August high at $1,807 (August 10) and ahead of the 200-day SMA at $1,833. If the metal leaves behind the latter, it could then attempt a move to the June top at $1,879 (June 13). In the opposite direction, the round level at $1,700 offers initial contention just ahead of the 2022 low at $1,680 (July 21. Down from here comes the 2021 low at $1,1676 (March 8) followed by the June 2020 low at $1,670 (June 5).
Resistance levels: $1,729 $1,750 $1,765 (4H chart)
Support levels: $1,704 $1,691 $1,680 (4H chart)
-637985033140198532.png)
CRUDE WTI
Prices of the barrel of the American benchmark for the sweet light crude oil added to the optimism seen in the second half of the week and advanced beyond the $86.00 mark on Friday, or more than 4%.
Despite the bull run, the commodity could not avoid closing the second straight week with losses, including a drop to fresh 7-month lows near $81.00 on September 8.
The recovery in prices of the black gold came in response to the deterioration in the Russia-EU-oil-gas scenario after V.Putin threatened to cut off supplies of oil and gas to Europe.
Also bolstering the late-week upbeat tone among traders appeared the OPEC+ oil output cut in combination with Iran-West talks going astray, all managing to offset omnipresent recession concerns somehow.
In the docket, driller Baker Hughes reported a drop by 5 oil rigs in the week to September 9, taking the total US oil rigs to 591.
The initial up barrier facing the WTI in case of further rebound should appear at the September high at $90.37 (September 5) seconded by the 200-day SMA at $96.63 and the weekly top at $97.65 (August 30). If the WTI breaks above this level it could confront the psychological $100.00 mark. Conversely, if sellers regain the upper hand, the next contention zone should emerge at the September low at $81.21 (September 8) just prior to the key round level at $80.00 and the 2022 low at $74.30 (January 3).
Resistance levels: $87.18 $90.37 $91.02 (4H chart)
Support levels: $81.18 $77.82 $76.71 (4H chart)
-637985035514320674.png)
DOW JONES
US equities tracked by the three major stock indices ended the week in a strong note, managing to reverse a gloomy start of the week and close in the positive territory for the first time after three weekly drops in a row.
Friday’s extra improvement in the appetite for the riskier assets translated into the continuation of the upbeat mood among investors, who left behind – albeit temporarily – recession concerns and another plethora of hawkish messages from FOMC policy makers.
Adding to the renewed optimism also appeared the offered stance in the dollar, declining US yields in the belly and long end of the curve and the recovery in crude oil prices.
Closing the week then, the Dow Jones advanced 1.19% to 32,151, the S&P500 gained 1.53% to 4,067 and the tech-reference Nasdaq Composite rose 2,11% to 12,112.
Ideally, the Dow Jones would need to clear the September high at 32,227 (September 9) sooner rather than later to allow for the continuation of the recovery to the 33,364 level (August 26 high) just ahead of the key 200-day SMA at 33,582. The breakout of this region should lead up to a potential visit to the August peak at 34,281 (August 16) ahead of the April high at 35,492 (April 21) and the February top at 35,824 (February 9). On the downside, the September low at 31,048 (September 6) is expected to hold the initial test before the July low at 30,143 (July 14) and the 2022 low at 29,653 (June 17). The RSI extended the upside and surpassed 48.
Top Performers: Salesforce.com, Caterpillar, 3M
Worst Performers: UnitedHealth, Travelers, McDonald’s
Resistance levels: 32,227 33,364 34,281 (4H chart)
Support levels: 31,048 30,982 30,143 (4H chart)
-637985034872736093.png)
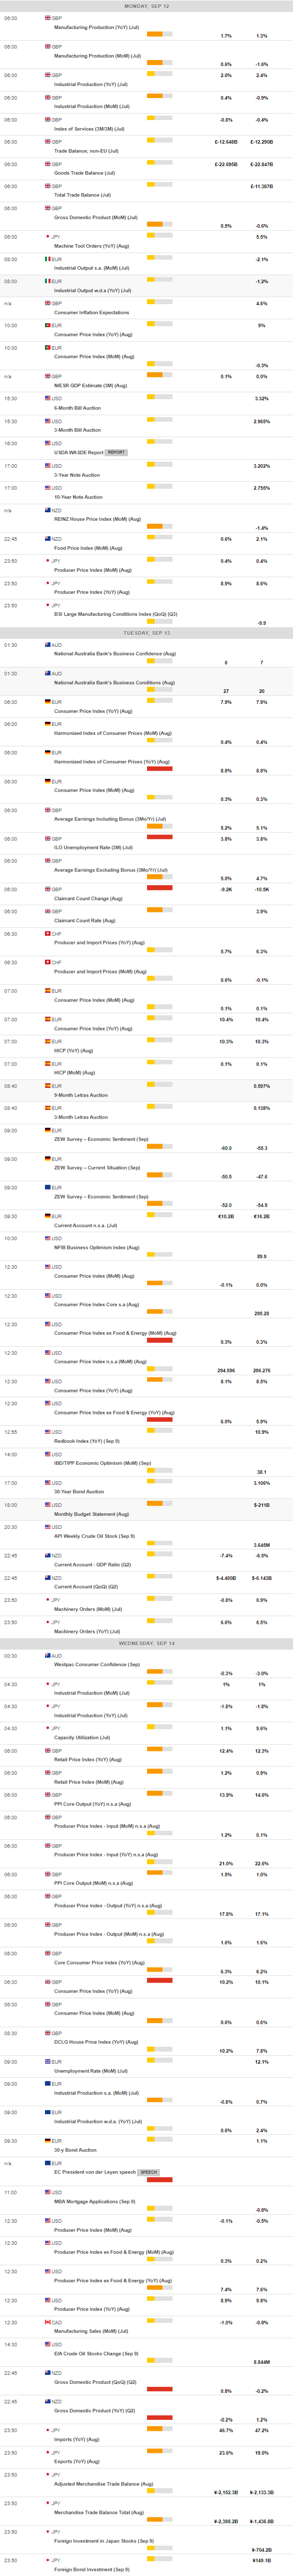
MACROECONOMIC EVENTS
All Information & Updates provided by:

All information relating to the financial markets available on this page has been prepared and issued by FXStreet (Forexstreet SL, Spain, Reg: B62498233) on the basis of publicly available information and all information believed to be reliable and does not conflict with Kuwaiti local laws, and all necessary care has been taken to before the company to ensure that the facts mentioned are correct from the source.
NCM Investment nor any of its directors or employees shall in any way be held responsible for the contents of this news, and the information contained on this page is intended only to provide clients with publicly available information and should not be construed as investment advice, report or analysis and/or constitute an offer or invitation to buy or sell financial instruments of any kind.
RISK WARNING: Forex and CFDs are highly risky leveraged products, as losses can exceed deposits. Please ensure you understand all the risks and take independent advice if necessary. NCM will segregate the clients based on the criteria of the regulator and its bylaws. NCM does not provide any advisory service; the material published does not constitute advice or a recommendation for a transaction in any financial instrument. NCM accepts no responsibility for any use of the content presented and any consequences of that use. Anyone acting on the information provided does so at their own risk.