
- Contact Us:
-

-

-

-


Daily Market Updates
13 Sep 2022
EURUSD
Further improvement in the risk complex lent extra wings to the EUR/USD and sponsored a visit to the 1.0200 zone, where the 7-month resistance line and a minor top (August 17) coincide.
In fact, the greenback intensified the leg lower following last week’s cycle highs well past the 110.00 mark and briefly probed the sub-108.00 zone, or multi-week lows, when tracked by the US Dollar Index (DXY).
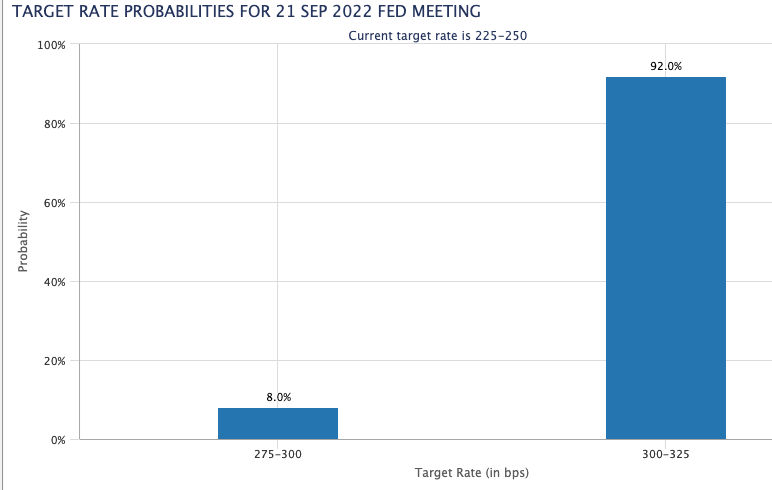
Daily gains in spot came on the back of the mixed performance in yields on both sides of the ocean, as investors continue to follow the post-ECB developments, while a 75 bps rate hike by the Federal Reserve later in the month appears more and more priced in.
On the latter, and according to CME Group’s FedWatch Tool, the probability of such a rate hovered around 92%, from 45% a month ago.
Nothing to write home about in both the domestic and US calendars on Monday, while the focus of attention is expected to be on Tuesday’s release of the US inflation figures for the month of August.
In case EUR/USD clears the 1.0200 region, the downside pressure could mitigate and allow for a challenge of the August top at 1.0368 (August 10) ahead of the weekly peak at 1.0615 (June 27). Further up comes the June high at 1.0773 (June 9) and the May top at 1.0786 (May 30). On the flip side, initial contention remains at the 2022 low at 0.9863 (September 6) closely followed by the December 2002 low at 0.9859 and the October 2002 low at 0.9685 (October 21). The daily RSI picked up pace and surpassed 56.
Resistance levels: 1.0197 1.0368 1.0488 (4H chart)
Support levels: 1.0032 0.9930 0.9863 (4H chart)
-637986069576369949.png)
USDJPY
USD/JPY started the week on the defensive and approached the 142.00 region on the back of the weaker dollar and despite a small improvement in US yields.
Indeed, the better note in the risk-linked galaxy weakened further the greenback on Monday and forced spot to extend the bearish note seen last Friday, while the Japanese yen bypassed a modest advance in US yields, particularly in the 10-year/30-year segment.
In Japan, August’s Machine Tool Orders expanded 10.7% from a year earlier in what was the sole release in the docket.
Bulls in USD/JPY still target the 2022 top at 144.99 (September 7) before the 145.41 level (August 21 1998 peak) and the all-time high at 147.67 (August 11 1998). Inversely, the 55-day SMA at 136.85 is expected to offer initial support prior to the weekly low at 135.80 (August 23) the 100-day SMA at 134.18. A deeper drop could see another weekly low at 131.73 (August 11) revisited ahead of the August low at 130.39 (August 2) and the psychological 130.00 yardstick. The daily RSI breached the 68 area following recent overbought levels.
Resistance levels: 143.49 144.44 144.99 (4H chart)
Support levels: 141.50 140.24 139.05 (4H chart)
-637986070397034748.png)
GBPUSD
The British pound followed the rest of the riskier assets and benefited from the broad-based weakness around the greenback, motivating GBP/USD to escalate to new 2-week highs beyond 1.1700 the figure on Monday.
In fact, cable kicked in the second consecutive week with gains amidst the persevering sell-off in the dollar, which encouraged sellers to drag the US Dollar Index (DXY) briefly to 3-week lows in the 107.80 region.
In the meantime, the sterling managed well to practically ignore poor results from the UK calendar after the annualized GDP expanded 2.3% in July and the GDP 3-Month Average came flat for the same month. Further disappointing releases saw Industrial Production and Manufacturing Production expand 1.1% and 1.1%, respectively, vs. July 2021 and Construction Output increased 4.3% YoY. On a more positive view, the Goods Trade Balance deficit shrank to £19.362B also in July.
Further recovery in GBP/USD now looks to target the weekly high at 1.1900 (August 26) ahead of the 55-day SMA at 1.1930. Further north appears the round level at 1.2000, which precedes the August top at 1.2293 (August 1) and the weekly peak at 1.2405 (June 16). Once cleared, a test of the 1.2666 level (May 27 top) should emerge on the horizon closely followed by the key 200-day SMA, today at 1.2736. In the opposite direction, the immediate contention aligns at the 2022 low at 1.1404 (September 7) prior to the weekly low at 1.1060 (March 1985). The daily RSI gathered traction and approached 46.
Resistance levels: 1.1710 1.1760 1.1900 (4H chart)
Support levels: 1.1550 1.1460 1.1404 (4H chart)
-637986070075459188.png)
AUDUSD
AUD/USD managed to extend the ongoing recovery to the boundaries of the key barrier at 0.6900 the figure on Monday, an area also coincident with the interim 55-day SMA.
The marked advance in spot came once again in response to the persistent selling pressure around the greenback, at the time when investors appear to have started to look past the Fed’s September event, when a 75 bps rate hike in the Fed Funds Target Range now appears largely anticipated.
Additionally, the Aussie dollar derived extra legs from the decent improvement in copper prices, while iron ore remained near Friday’s close just above the $102.00 mark per tonne, all amidst the broad-based better note surrounding the commodity universe.
The Australian docket was empty on Monday, leaving all the attention to Tuesday’s Consumer Confidence Index measured by Westpac.
AUD/USD should now shift the focus to the 100-day SMA at 0.6963 just ahead of the psychological 0.7000 mark and prior to the weekly peak at 0.7008 (August 26). Further north, the pair is expected to probe the 200-day SMA at 0.7112 before the August high at 0.7136 (August 11) and the June top at 0.7282 (June 3). On the downside, the September low at 0.6698 (September 7) should hold the initial test ahead of the 2022 low at 0.6681 (July 14). If the pair accelerates losses, it could then prompt the May 2020 low at 0.6372 (May 4) to re-emerge on the horizon prior to the weekly low at 0.6253 (April 21 2020). The daily RSI improves past 51.
Resistance levels: 0.6920 0.6956 0.7008 (4H chart)
Support levels: 0.6824 0.6713 0.6699 (4H chart)
-637986070685791290.png)
GOLD
Gold prices added to Friday’s advance and trespassed the $1,730 mark at the beginning of the week, printing at the same time new 2-week peaks.
Once again, the dollar magnified its sell-off and broke below the 108.00 level when gauged by the US Dollar Index (DXY), lending further oxygen to the USD-denominated assets and sponsoring the upside in the precious metal.
Also collaborating with the continuation of the bounce in the yellow metal appeared another mixed session in US yields, where the short term of the curve eased some ground vs. modest gains in the belly and the long end.
In the meantime, gold is expected to remain under scrutiny in the next sessions ahead of Tuesday’s publication of the US CPI and key results in other US fundamentals later in the week, all gauged against the Fed’s prospects for further tightening in the next months.
Gold clinched a new September peak at $1,735 (September 12). Once cleared, the metal could confront the interim 55-day SMA at $1,748 prior to the weekly high at $1,765 (August 25) and the August top at $1,807 (August 10). The breakout of the latter should expose the 200-day SMA at $1,833 prior to the June peak at $1,879 (June 13). Contrarily, initial support is seen emerging at the round level at $1,700 before the 2022 low at $1,680 (July 21). This contention zone appears bolstered by the proximity of the 2021 low at $1,1676 (March 8) and the June 2020 low at $1,670 (June 5).
Resistance levels: $1,735 $1,750 $1,765 (4H chart)
Support levels: $1,711 $1,704 $1,691 (4H chart)
-637986071006264762.png)
CRUDE WTI
Prices of the WTI kept the positive streak alive for the third session in a row on Monday, this time briefly surpassing the $89.00 mark per barrel.
Concerns regarding a price cap to Russian exports of crude oil coupled with further disappointing news coming from the Iran-West talks pushed crude oil prices to new 4-day highs at the beginning of the week.
In the meantime, Chinese zero-COVID lockdown measures remained still well in place and are expected to keep sapping traders’ hope of a more sustainable recovery, while prospects for a weaker demand look unabated.
As usual, the API and the EIA will report on US crude oil inventories in the week to September 9 on Tuesday and Wednesday, respectively.
The September top at $90.37 (September 5) still emerges as the initial hurdle for WTI bulls. If prices break above this level, then a potential visit to the 200-day SMA at $96.74 could start shaping up prior to the weekly peak at $97.65 (August 30) and seconded by the psychological $100.00 mark. On the other hand, there are no support levels of note until the September low at $81.21 (September 8), which anticipates the key round level at $80.00 ahead of the 2022 low at $74.30 (January 3).
Resistance levels: $89.06 $90.37 $90.81 (4H chart)
Support levels: $85.14 $81.18 $77.82 (4H chart)
-637986071670591563.png)
DOW JONES
US major indices started the week on a positive note and added to the strong bounce off monthly lows recorded last week.
In addition, daily gains in the Dow Jones reclaimed the area around the 50% Fibo retracement of the July-August rally.
Optimism around investors ran high on Monday on expectations of another below-consensus inflation readings for the month of August (due on Tuesday). Bolstering this view, the Survey of Consumer Expectations by the New York Fed showed a strong decline in 1-year and 3-year inflation expectations.
The lacklustre start of the week in US yield in combination with the persistent sell-off in the greenback also added to the upbeat mood around US equities.
All in all, the Dow Jones rose 0.77% to 32,398, the S&P500 advanced 1.10% to 4,112 and the tech-heavy Nasdaq Composite gained 1.13% to 12,248.
Next on the upside for the Dow Jones appear a Fibo level (of the July-August rally) at 32,700, which precedes the 33,364 level (August 26 high) and the key 200-day SMA at 33,565. The surpass of the latter could open the door to the August high at 34,281 (August 16) prior to the April top at 35,492 (April 21) and the February peak at 35,824 (February 9). On the contrary, decent contention emerges at the September low at 31,048 (September 6) ahead of the July low at 30,143 (July 14) and the 2022 low at 29,653 (June 17). The RSI improved further past the 51 level.
Top Performers: Apple, American Express, UnitedHealth
Worst Performers: Amgen, Home Depot, Intel
Resistance levels: 32,504 33,364 34,281 (4H chart)
Support levels: 31,048 30,982 30,143 (4H chart)
-637986072302885831.png)
MACROECONOMIC EVENTS

All Information & Updates provided by:

All information relating to the financial markets available on this page has been prepared and issued by FXStreet (Forexstreet SL, Spain, Reg: B62498233) on the basis of publicly available information and all information believed to be reliable and does not conflict with Kuwaiti local laws, and all necessary care has been taken to before the company to ensure that the facts mentioned are correct from the source.
NCM Investment nor any of its directors or employees shall in any way be held responsible for the contents of this news, and the information contained on this page is intended only to provide clients with publicly available information and should not be construed as investment advice, report or analysis and/or constitute an offer or invitation to buy or sell financial instruments of any kind.
RISK WARNING: Forex and CFDs are highly risky leveraged products, as losses can exceed deposits. Please ensure you understand all the risks and take independent advice if necessary. NCM will segregate the clients based on the criteria of the regulator and its bylaws. NCM does not provide any advisory service; the material published does not constitute advice or a recommendation for a transaction in any financial instrument. NCM accepts no responsibility for any use of the content presented and any consequences of that use. Anyone acting on the information provided does so at their own risk.