
- Contact Us:
-

-

-

-


Daily Market Updates
14 Sep 2022
EURUSD
Everything was alright around EUR/USD until US inflation figures came out.
Indeed, the violent change of direction in the dollar forced the pair to quickly surrender its daily gains and retreat below the psychological parity zone, where some initial contention seems to have turned up. This area also appears reinforced by the 200-hour SMA.
The greenback reversed its weekly losses and revisited the area north of the 109.00 barrier after US inflation figures showed the CPI rose 8.3% in the year to August, more than initially estimated although lower than the July’s reading. The Core CPI, in the meantime, rose 6.3% YoY vs. 6.1% expected and up from the previous 5.9% gain.

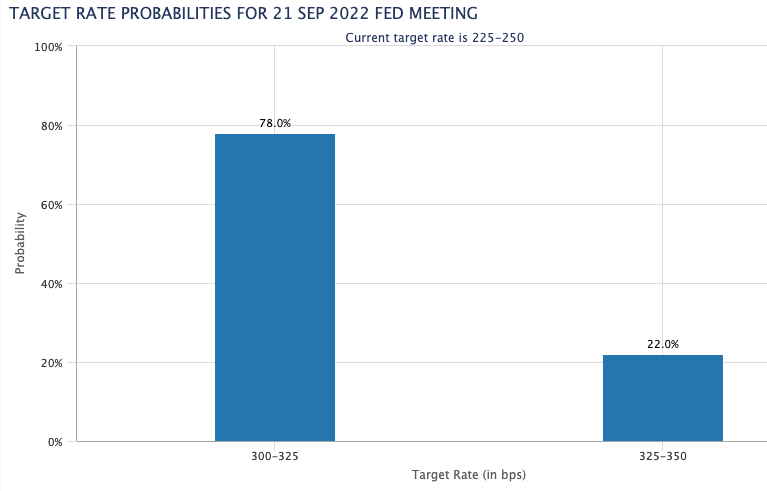
The sharp pullback in spot came in tandem with swelling speculation of a full-point interest rate hike at the Fed’s gathering on September 21, at the time when a 75 bps rate hike appeared already fully anticipated. CME Group’s FedWatch Tool now sees the probability of a 75 bps raise at nearly 80% and just above 20% when it comes to 100 bps.
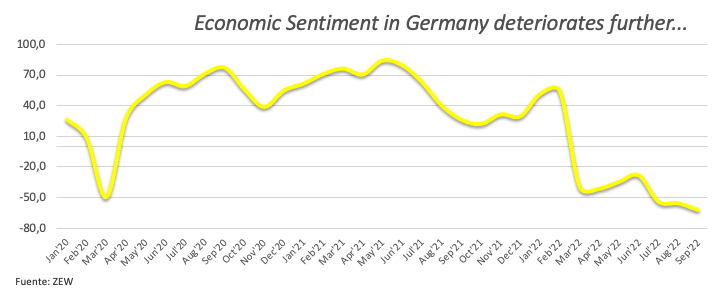
In the euro docket, final inflation figures in Germany came in line with the preliminary readings and showed the CPI rose 7.9% YoY in August and 0.3% vs. the previous month. In addition, the Economic Sentiment gauged by the ZEW Institute worsened further to -61.9 and -60.7 in Germany and the euro area, respectively, for the month of September.
In case sellers regain control of the market, EUR/USD faces initial contention at the parity level ahead of the 2022 low at 0.9863 (September 6). The breach of this level opens the door to the December 2002 low at 0.9859 and the October 2002 low at 0.9685 (October 21). Immediately to the upside comes the 1.0200 zone, where recent tops and the 7-month resistance line converge. Beyond the latter, the pair cold accelerate gains and test the 100-day SMA at 1.0332 prior to the August peak at 1.0368 (August 10). North from here turns up the weekly high at 1.0615 (June 27) seconded by the June top at 1.0773 (June 9) and the May peak at 1.0786 (May 30). The daily RSI dropped below the 46 level.
Resistance levels: 1.0197 1.0368 1.0488 (4H chart)
Support levels: 0.9989 0.9930 0.9863 (4H chart)
-637986894781039094.png)
USDJPY
The unanticipated shift in the greenback allowed USD/JPY to clinch the second consecutive daily advance and rise to multi-session highs near 144.70 on turnaround Tuesday.
Other than the magnified upside in the dollar, the pronounced uptick in US yields - particularly in the short end of the curve - ignited a strong depreciation in the Japanese safe haven.
In Japan, the BSI Large Manufacturing expanded 1.7% QoQ during the July-September period and Producer Prices rose 0.2% MoM in August and 9.0% over the last twelve months.
USD/JPY now focuses on the 2022 peak at 144.99 (September 7). Once cleared, a potential test of the 145.41 level (August 21 1998 high) could return to the investors’ radar ahead of the all-time top at 147.67 (August 11 1998). In the opposite direction, there is a minor support at 139.86 (September 2) prior to the 55-day SMA at 137.00. The loss of this region exposes the weekly low at 135.80 (August 23) before 100-day SMA at 134.35. If bears keep pushing, then the pair could slip further back to another weekly low at 131.73 (August 11) prior to the August low at 130.39 (August 2), which comes just ahead of the psychological 130.00 mark. The daily RSI returned to the overbought territory around 73.
Resistance levels: 144.68 144.99 145.41 (4H chart)
Support levels: 141.50 140.24 139.05 (4H chart)
-637986898155408569.png)
GBPUSD
GBP/USD extended the rebound to 2-week highs near 1.1740, where the 38.2% Fibo retracement (of the August-September drop) also coincide.
However, the hasty U-turn in the greenback sponsored a sudden and deep retracement in cable to the 1.1530 zone, or 2-day lows, on Tuesday.
The initial bull run in the quid was once again supported by the earlier offered stance in the buck, although all that changed following higher-than-expected US inflation figures for the month of August.
In addition, auspicious results from the UK labour market appear to have also bolstered the optimism in the quid after the UK Unemployment Rate ticked lower to 3.6% in July and the Employment Change increased by 40K persons (vs. 128K expected). Additional data from the labour market report showed the Average Earnings inc. Bonus expand 5.5% YoY in the 3-months to July and the Claimant Count Change went up by 6.3K persons in August.
The 2022 low at 1.1404 (September 7) still appears as the immediate support for GBP/USD ahead of the weekly low at 1.1060 (March 1985). Extra rebound in GBP/USD now focuses on the 50% Fibo retracement (of the August-September drop) at 1.1840 ahead of the weekly top at 1.1900 (August 26) and the 55-day SMA at 1.1921. Further up comes the round level at 1.2000 followed by the August peak at 1.2293 (August 1) and the weekly high at 1.2405 (June 16). The surpass of this level exposes the 1.2666 level (May 27 top) prior to the key 200-day SMA 1.2727. The daily RSI deteriorated to the sub-36 region.
Resistance levels: 1.1738 1.1760 1.1848 (4H chart)
Support levels: 1.1514 1.1460 1.1404 (4H chart)
-637986897561260944.png)
AUDUSD
AUD/USD collapsed to the 0.6760 region soon after climbing as high as to the vicinity of 0.6920, or multi-day peaks, on Tuesday.
The whetted drop in the Aussie dollar followed the equally acute bullish move in the greenback in the wake of the release of the unexpectedly higher US inflation figures for the month of August.
The mixed note in the commodity space failed to lend some support to the Aussie dollar, particularly since copper prices and the tonne of iron ore traded on the defensive.
Data wise Down Under, the always relevant Consumer Confidence Index tracked by Westpac improved to 84.4 in September (from 81.2).
A deeper decline should force AUD/USD to revisit the September low at 0.6698 (September 7) prior to the 2022 low at 0.6681 (July 14). Further south comes the May 2020 low at 0.6372 (May 4) ahead of the weekly low at 0.6253 (April 21 2020). Contrarily, the September peak at 0.6916 (September 13) emerges as the initial up barrier prior to the temporary 100-day SMA at 0.6959 and just before the psychological 0.7000 yardstick. Above the latter aligns the weekly high at 0.7008 (August 26) seconded by the 200-day SMA at 0.7110. North from here emerges the August top at 0.7136 (August 11) ahead of the June peak at 0.7282 (June 3). The daily RSI deflates below the 42 level.
Resistance levels: 0.6916 0.6956 0.7008 (4H chart)
Support levels: 0.6756 0.6713 0.6699 (4H chart)
-637986899165585389.png)
GOLD
Prices of the ounce troy of gold retreated to 4-day lows and briefly revisited the area below the $1,700 yardstick on Tuesday.
The noticeable pullback in the precious metal came in response to the acute bull run in the greenback, originated after US inflation figures were higher than what consensus was expecting in August.
Also weighing on bullion, US yields across the curve rose decidedly - with the 2-year note climbing to levels last seen back in November 2007 past 3.75% - pari passu with rising rumours of a probable full-point rate hike as soon as at the Fed’s September gathering.
If sellers regain momentum, then gold is expected to meet the next support of note at the 2022 low at $1,680 (July 21), which remains closely followed by the 2021 low at $1,1676 (March 8) and the June 2020 low at $1,670 (June 5). Inversely, the September high at $1,735 (September 12) appears as the initial up barrier ahead of the temporary 55-day SMA at $1,1746 and the weekly top at $1,765 (August 25). The breakout of this level could open the door to the August peak at $1,807 (August 10) prior to the key 200-day SMA at $1,832 and the June high at $1,879 (June 13).
Resistance levels: $1,735 $1,750 $1,765 (4H chart)
Support levels: $1,697 $1,688 $1,680 (4H chart)
-637986899514951149.png)
CRUDE WTI
Prices of the American reference for the sweet light crude oil set aside Monday’s gains and reignited the downtrend on Tuesday.
Indeed, omnipresent demand jitters offset the usual market chatter around the tight supply and motivated sellers to drag the WTI to the vicinity of the $85.00 mark per barrel in the second session of the week.
In addition, higher-than-expected US inflation figures in August triggered speculation of an even larger rate hike at the next Fed meeting on September 21, which resuscitated concerns over an economic slowdown sooner rather than later.
On the positives for crude oil on Tuesday, if any at all, emerged further rumours that an Iran-West nuclear deal looked like a long shot for the time being.
The API is expected to publish its weekly report on US crude oil supplies for the week ended on September 9 after the closing bell in the NA session.
Further weakness in the WTI should revisit the September low at $81.21 (September 8) in the near term, closely followed by the key round level at $80.00 and prior to the 2022 low at $74.30 (January 3). If bulls regain the initiative, the initial up barrier turns up at the September peak at $90.37 (September 5) before the 200-day SMA at $96.74 and the weekly high at $97.65 (August 30). Further up should come the psychological $100.00 mark.
Resistance levels: $89.29 $90.37 $92.72 (4H chart)
Support levels: $85.05 $81.18 $77.82 (4H chart)
-637986900133775665.png)
DOW JONES
US equities eroded part of the recent 4-session recovery and traded sharply in the negative territory on Tuesday.
Indeed, rising bets of further rate hikes by the Federal Reserve garnered extra pace after US inflation figures tracked by the CPI came in higher than initially estimated in August.
Speculation among market participants event considers the probability of a 100 bps rate hike at the Fed’s event later in the month.
Also collaborating with the sour sentiment in stocks came higher US yields and the strong bounce in the greenback.
That said, the Dow Jones retreated 2.53% to 31,557, the S&P500 dropped 2.85% to 3,993 and the tech-reference Nasdaq Composite shed 3.82% to 11,797.
If the Dow Jones accelerates losses, then a probable test of the September low at 31,048 (September 6) could re-emerge on the horizon prior to the July low at 30,143 (July 14) and the 2022 low at 29,653 (June 17). On the contrary, initial resistance emerges at the September high at 32,504 (September 12) seconded by a Fibo level (of the July-August rally) at 32,700 and the 33,364 level (August 26 top). A move beyond the latter could put the key 200-day SMA at 33,544 back on the radar before the August peak at 34,281 (August 16). Once cleared, the index could dispute the April high at 35,492 (April 21) ahead of the February top at 35,824 (February 9). The daily RSI lost the grip and breached 42.
Top Performers: Walmart, Merck&Co, Travelers
Worst Performers: Intel, Boeing, Dow
Resistance levels: 32,193 32,504 33,364 (4H chart)
Support levels: 31,455 31,048 30,982 (4H chart)
-637986900425681376.png)
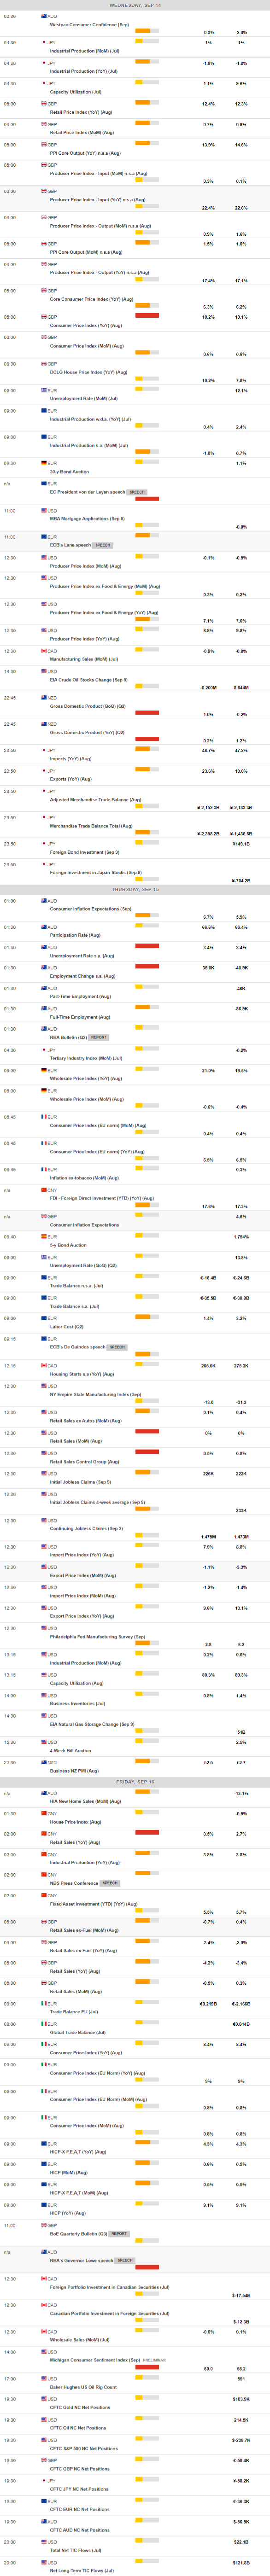
MACROECONOMIC EVENTS
All Information & Updates provided by:

All information relating to the financial markets available on this page has been prepared and issued by FXStreet (Forexstreet SL, Spain, Reg: B62498233) on the basis of publicly available information and all information believed to be reliable and does not conflict with Kuwaiti local laws, and all necessary care has been taken to before the company to ensure that the facts mentioned are correct from the source.
NCM Investment nor any of its directors or employees shall in any way be held responsible for the contents of this news, and the information contained on this page is intended only to provide clients with publicly available information and should not be construed as investment advice, report or analysis and/or constitute an offer or invitation to buy or sell financial instruments of any kind.
RISK WARNING: Forex and CFDs are highly risky leveraged products, as losses can exceed deposits. Please ensure you understand all the risks and take independent advice if necessary. NCM will segregate the clients based on the criteria of the regulator and its bylaws. NCM does not provide any advisory service; the material published does not constitute advice or a recommendation for a transaction in any financial instrument. NCM accepts no responsibility for any use of the content presented and any consequences of that use. Anyone acting on the information provided does so at their own risk.