
- Contact Us:
-

-

-

-


Daily Market Updates
15 Sep 2022
EURUSD
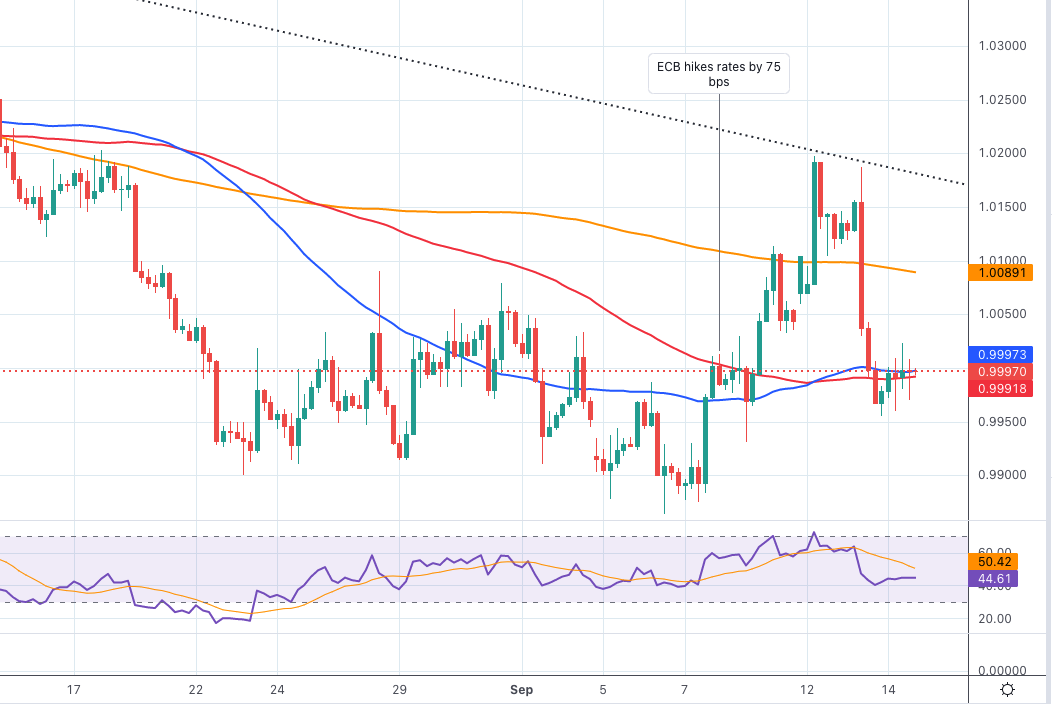
The corrective move in the greenback gave some breathing space to the risk-associated universe and sponsored Wednesday’s marked recovery in EUR/USD to the area north of the parity level.
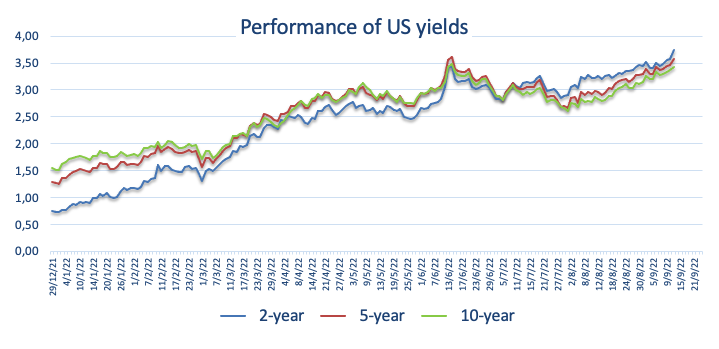
Indeed, after hitting 3-day tops in the wake of the publication of US inflation figures on Tuesday, the US Dollar Index (DXY) surrendered part of that noticeable advance and returned to the low-109.00s despite another positive session in US yields, which saw the short end climb past 3.80% for the first time since November 2007.
In the meantime, and particularly following the publication of the US CPI results, speculation among market participants over a probable full point interest rate hike by the Fed next week has started to gather traction. On this, FedWatch Tool measured by CME Group sees as possibility of such an outcome at around 26%. Consensus remains so far biased towards a 75 bps hike.
In the euro calendar, the Industrial Production in the euro area contracted 2.4% in the year to July. In the US data space, MBA Mortgage Applications contracted 1.2% in the week to September 9 and Producer Prices contracted 0.1% MoM in August and rose 8.7% over the last twelve months.
The continuation of the recovery in EUR/USD now targets the temporary 55-day SMA at 1.0125 ahead of the 1.0200 region, where the weekly top (September 12) and the 7-month resistance line coincide. The surpass of this region should see the downside pressure diminished and could sponsor an initial challenge to the 100-day SMA at 1.0325 before the August high at 1.0368 (August 10) and the weekly top at 1.0615 (June 27). Inversely, the weekly low at 0.9955 (September 14) emerges as the next contention area prior to the 2022 low at 0.9863 (September 6). A deeper decline could put the December 2002 low at 0.9859 back on the radar prior to the October 2002 low at 0.9685 (October 21). The daily RSI bounced past the 46 mark.
Resistance levels: 1.0089 1.0197 1.0368 (4H chart)
Support levels: 0.9955 0.9930 0.9863 (4H chart)
USDJPY
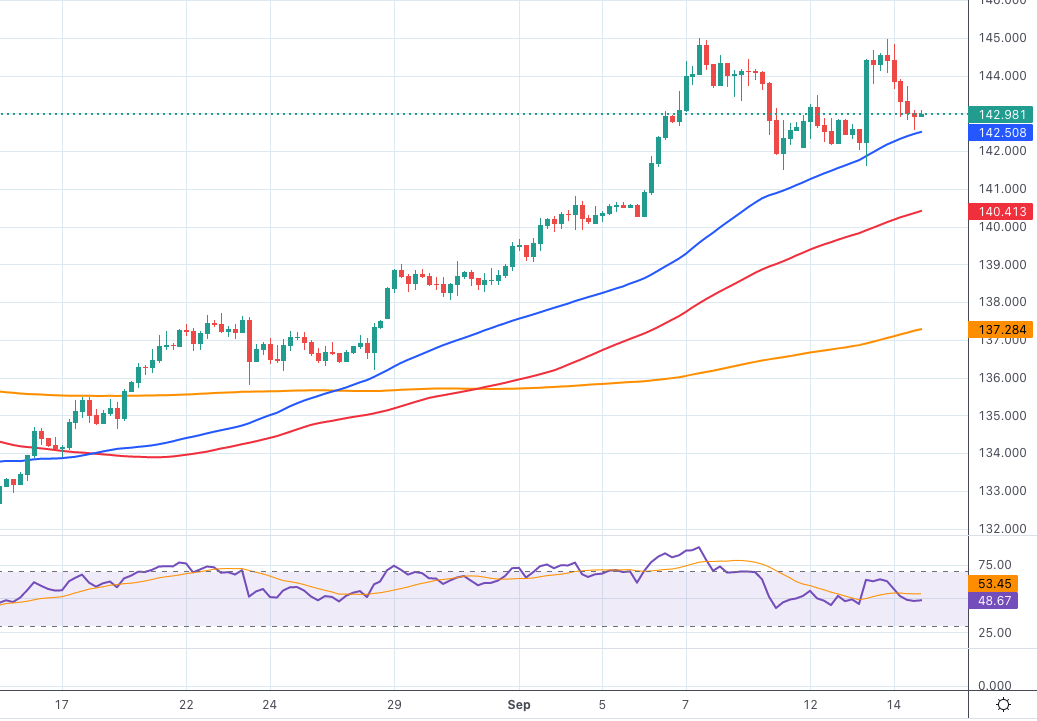
USD/JPY poked once again with recent 24-year highs around 145.00 before jumping off the cliff and dropping over 1% to the mid-142.00s against the backdrop of a noticeable decline in the dollar and despite further upside in US yields.
Indeed, the Japanese yen practically ignored the extra gains in US yields – particularly in the 2-year/10-year segment – backed by expectations of a tighter stance from the Federal Reserve, which were exacerbated following Tuesday’s release of higher-than-expected US inflation figures in August.
In addition, market chatter around the likelihood of FX intervention by the Japanese government seems to have underpinned the better tone in the safe haven on Wednesday. On this, Japan’s Chief Cabinet Sec. Matsuno stressed that currencies should move according to economic fundamentals and added that the impact of US inflation on the economy will be closely followed. Matsuno also suggested that any choices remain on the table when it comes to FX response (in light of the acute depreciation of the Japanese yen) and that sharp currency fluctuations are not acceptable. He also showed concerns regarding the presence of speculative moves behind recent quick and one-sided FX moves.
In the docket, the Reuters Tankan Index retreated to 10 in September (from 13) and Machinery Orders expanded 12.8% in the year to July. Lastly, final figures showed Industrial Production contract at an annualized 2.0% also in July.
No changes to the topside in USD/JPY, which continues to target the 2022 high at 144.99 (September 7) ahead of the 145.41 level (August 21 1998 high) and prior to the all-time peak at 147.67 (August 11 1998). On the flip side, the 141.50 level (September 9) emerges as a minor support ahead of the 55-day SMA at 137.12. South from here aligns the weekly low at 135.80 (August 23) prior to the interim 100-day SMA at 134.50 and the weekly low at 131.73 (August 11). A drop below the latter could expose the August low at 130.39 (August 2) just before the psychological 130.00 yardstick. The daily RSI deflated to the 63 region.
Resistance levels: 144.96 144.99 145.41 (4H chart)
Support levels: 141.50 140.24 139.05 (4H chart)
GBPUSD
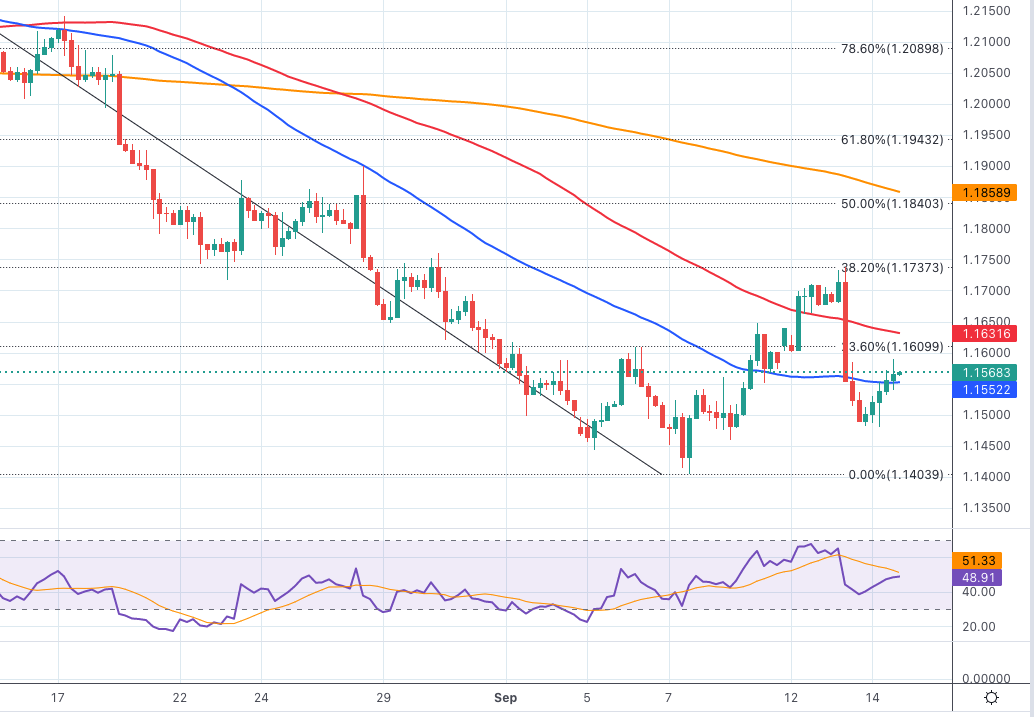
GBP/USD regained the smile and rebounded from weekly lows in the 1.1480 region in response to the renewed offered stance in the US dollar, reaching as high as the 1.1590 zone on Wednesday.
Indeed, the greenback gave away part of Tuesday’s CPI-induced strong gains and remained on the defensive, allowing cable and the rest of the riskier assets to embark on a decent recovery midweek.
No meaningful reaction in the quid after the UK Inflation Rate eased for the first time in nearly a year in August after the CPI rose 9.9% and 0.5% from the previous month, less than initially estimated. The Core Inflation Rate matched consensus and ticked a tad higher to 6.3% over the last twelve months (from 6.2).
It is worth recalling that the Bank of England is expected to hike the policy rate by 50 bps at Thursday’s event.
A more sustainable bounce in GBP/USD could start by clearing the September top at 1.1738 (September 13) ahead of the 50% Fibo retracement (of the August-September drop) at 1.1840. Further up comes the weekly peak at 1.1900 (August 26) followed by the 55-day SMA at 1.1907 and the round level at 1.2000. The surpass of the latter could pave the way for a visit to the August high at 1.2293 (August 1) prior to the weekly top at 1.2405 (June 16). North from here aligns the 1.2666 level (May 27 peak) ahead of the key 200-day SMA 1.2719. Sellers, in the meantime, could attempt to initially drag cable to the 2022 low at 1.1404 (September 7). Once this area is cleared, there are no support levels of note until the weekly low at 1.1060 (March 1985). The daily RSI ticked higher and flirted with the 40 zone.
Resistance levels: 1.1589 1.1738 1.1760 (4H chart)
Support levels: 1.1479 1.1460 1.1404 (4H chart)
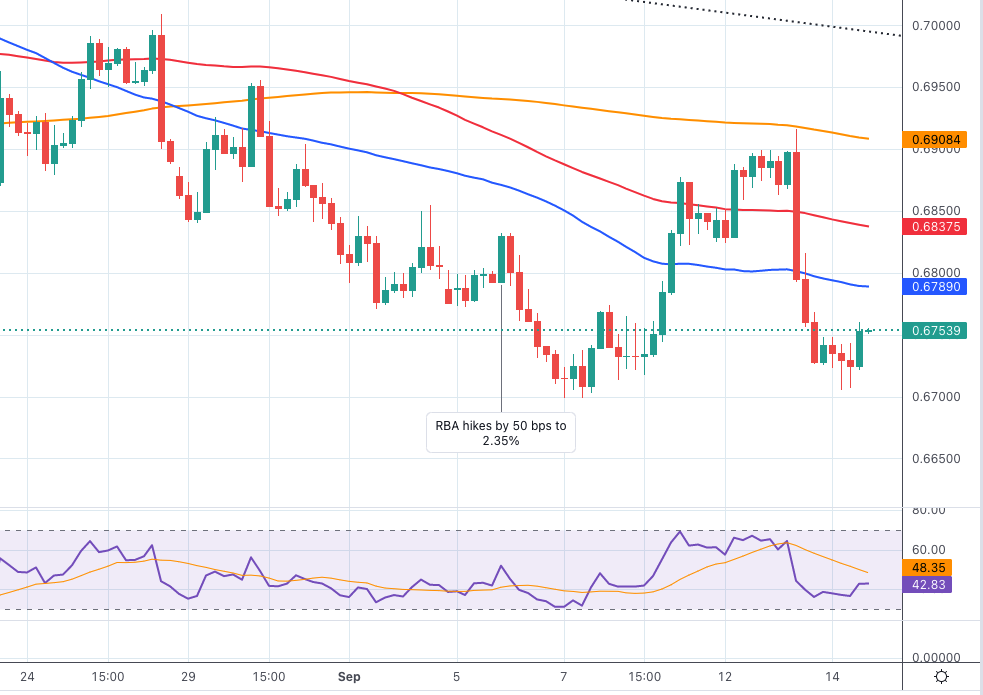
AUDUSD
In line with the rest of the riskier assets, AUD/USD attempted a decent recovery and reversed part of Tuesday’s pronounced decline, as the greenback gave away part of its post-US CPI gains.
Also propping up the daily bounce in the Aussie dollar, prices of the tonne of iron ore edged a tad higher, while copper prices corrected lower amidst the generalized mixed tone in the commodity universe.
Nothing worth mentioning in the Aussie docket, while the next salient event will be Thursday’s labour market report for the month of August as well as September’s Consumer Inflation Expectations.
Further downside in AUD/USD is expected to confront the September low at 0.6698 (September 7) ahead of the 2022 low at 0.6681 (July 14). The loss of the latter could prompt the May 2020 low at 0.6372 (May 4) to re-emerge on the horizon prior to the weekly low at 0.6253 (April 21 2020). The initial up barrier appears at the September high at 0.6916 (September 13) seconded by the temporary 100-day SMA at 0.6955, which also precedes the psychological 0.7000 mark. Extra gains could then retarget the weekly top at 0.7008 (August 26) prior to the 200-day SMA at 0.7108 and the August peak at 0.7136 (August 11). Once cleared, the focus of attention is seen gyrating to the June high at 0.7282 (June 3). The daily RSI reclaims the area above 42.
Resistance levels: 0.6760 0.6916 0.6956 (4H chart)
Support levels: 0.6706 0.6699 0.6681 (4H chart)
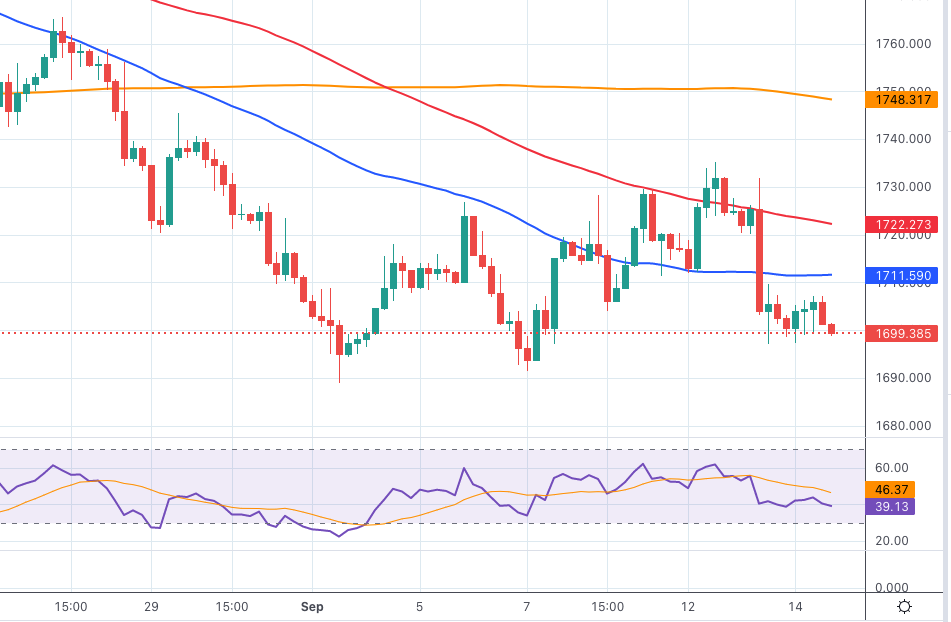
GOLD
Gold prices charted an indecisive session and kept the trade around the key $1,700 zone per ounce troy on Wednesday.
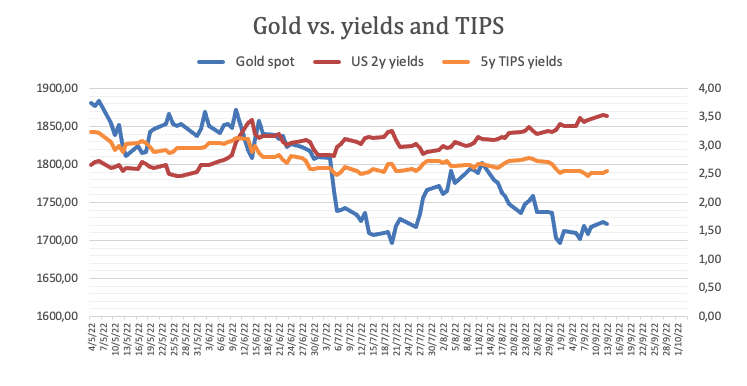
Bullion failed to capitalize on the markedly weaker greenback, although the firm note around US yields, mainly in the short end of the curve, kept buyers at bay midweek.
In the meantime, the precious metal found itself once again in a tug-of-war between unabated inflation pressures and the prospects of extra tightening by the Federal Reserve. Following Tuesday’s inflation figures, a potential full point interest rate hike is now on the table, although investors remain biased towards a ¾ point rate raise.
Gold bears continue to face the big magnet at the 2022 low at $1,680 (July 21), just ahead of the 2021 low at $1,1676 (March 8) and the June 2020 low at $1,670 (June 5). On the contrary, initial up barrier emerges at the September top at $1,735 (September 12) seconded by the temporary 55-day SMA at $1,744 and the weekly peak at $1,765 (August 25). Once the latter is cleared then the August high at $1,807 (August 10) could return to the radar ahead of the key 200-day SMA at $1,832 and the June top at $1,879 (June 13).
Resistance levels: $1,735 $1,750 $1,765 (4H chart)
Support levels: $1,697 $1,688 $1,680 (4H chart)
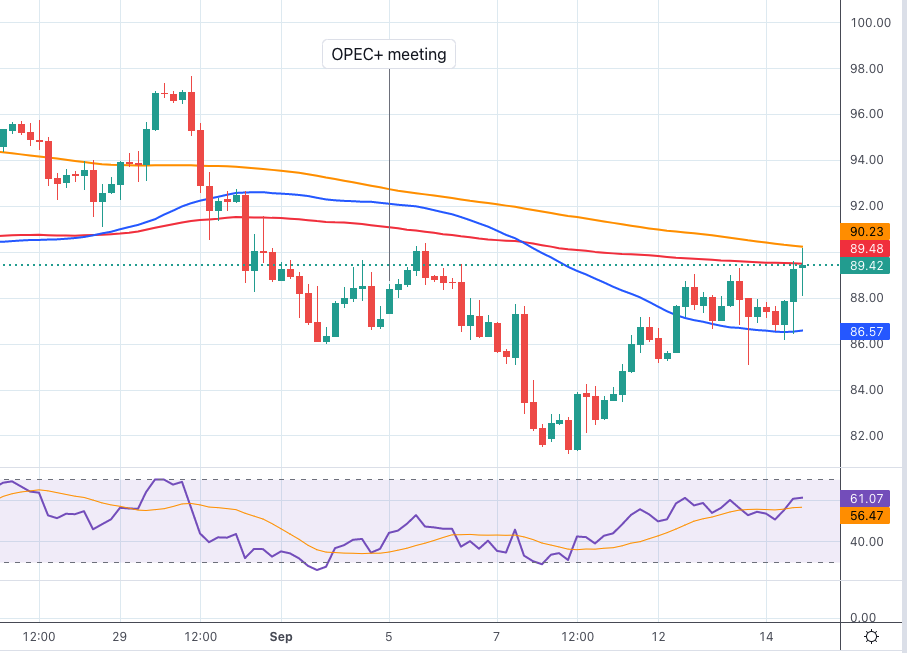
CRUDE WTI
Prices of the barrel of the West Texas Intermediate (WTI) resumed the weekly recovery and briefly surpassed the key barrier at the $90.00 mark on Wednesday. So far, crude oil remained on its way to close the first week with gains after two consecutive pullbacks.
This time, concerns around the current tight supply conditions of the market combined with the IEA’s forecast of a larger switch to oil from gas in the winter months due to the exorbitant prices of the latter seem to have been enough to keep the commodity well bid so far this week.
The upbeat tone in the commodity managed to bypass the EIA’s weekly report after US crude oil stockpiles rose by 2.442M barrels in the week to September 9, while supplies at Cushing dropped marginally by 0.135M barrels and gasoline inventories shrank by 1.767M barrels.
If prices of the WTI extends the upside, then the next hurdle of note is at the September high at $90.37 (September 5) seconded by the 200-day SMA at $96.94. The breakout of this region should prompt the weekly top at $97.65 (August 30) to re-emerge on the horizon ahead of the psychological $100.00 mark. On the other hand, the September low at $81.21 (September 8) is expected to hold the initial downside just before the key round level at $80.00 and ahead of the 2022 low at $74.30 (January 3).
Resistance levels: $90.37 $92.72 $97.75 (4H chart)
Support levels: $85.05 $81.18 $77.82 (4H chart)
DOW JONES
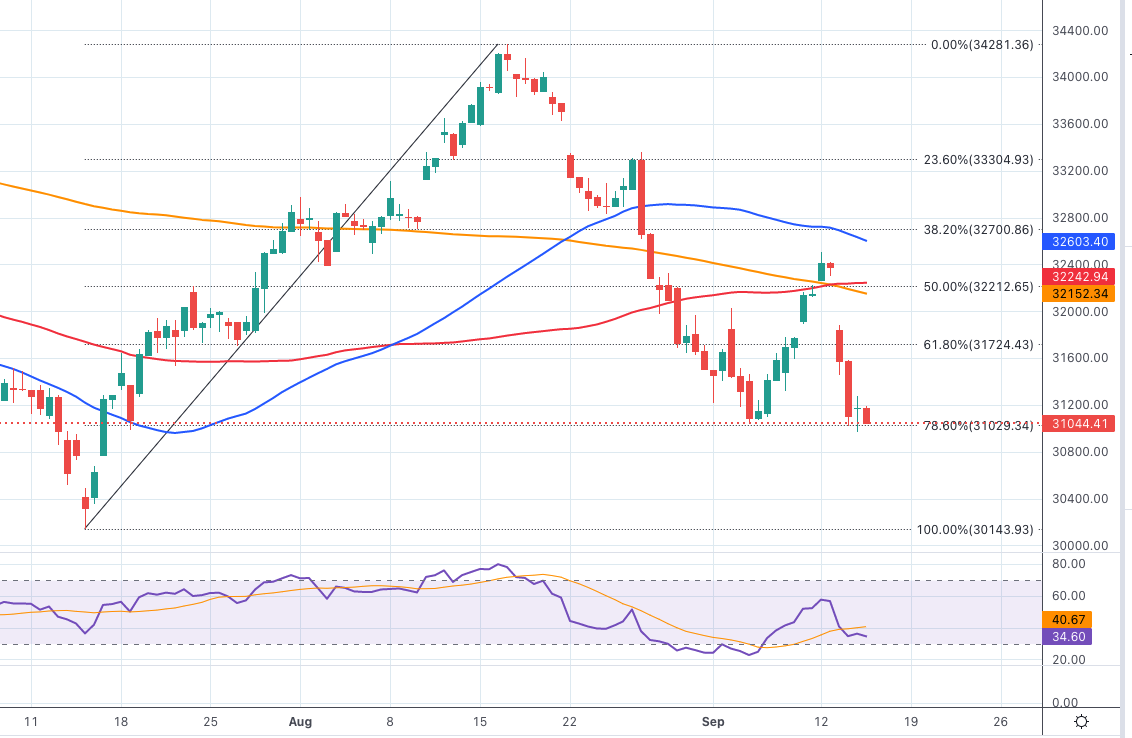
Equities measured by the Dow Jones advanced marginally on Wednesday, although not before reaching new 2-month lows in the sub-31,000 region.
The subsequent bounce partially reversed Tuesday’s CPI-led collapse amidst increasing conviction that the FOMC will hike the Fed Funds Target Range by 75 bps when they meet next week, as the perception of a potential full-point rate hike seems to have lost some traction in past hours.
The renewed selling bias in the US dollar also helped in the daily upside in stocks after the US Dollar Index (DXY) was firmly rejected around weekly highs near 110.00.
All in all, the Dow Jones gained 0.13% to 31,143, the S&P500 rose 0.34% to 3,945 and the tech-heavy Nasdaq Composite advanced 0.83% to 11,731.
The Dow Jones remains under pressure and the breakdown of the September low at 30,969 (September 14) could spark a deeper retracement to the July low at 30,143 (July 14) and the 2022 low at 29,653 (June 17). On the upside, the September top at 32,504 (September 12) still emerges as the initial hurdle seconded by a Fibo level (of the July-August rally) at 32,700 and the 33,364 level (August 26 peak). The surpass of this level exposes the key 200-day SMA at 33,523 ahead of the August high at 34,281 (August 16). Further north aligns the April top at 35,492 (April 21) prior to the February peak at 35,824 (February 9). The daily RSI looks stable around 38.
Top Performers: Chevron, J&J, Salesforce Inc.
Worst Performers: Honeywell, 3M, Dow
Resistance levels: 32,152 32,504 33,364 (4H chart)
Support levels: 30,969 30,143 29,653 (4H chart)
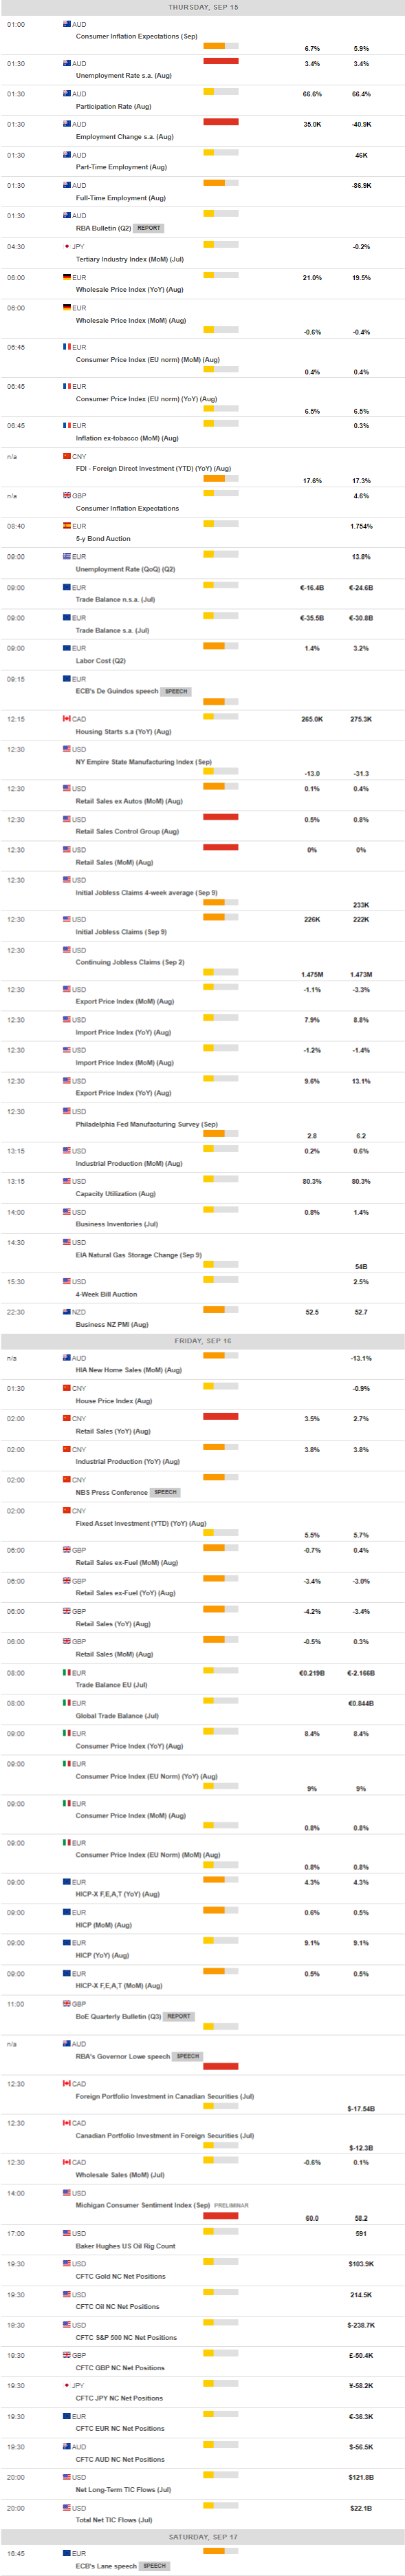
MACROECONOMIC EVENTS
All Information & Updates provided by:

All information relating to the financial markets available on this page has been prepared and issued by FXStreet (Forexstreet SL, Spain, Reg: B62498233) on the basis of publicly available information and all information believed to be reliable and does not conflict with Kuwaiti local laws, and all necessary care has been taken to before the company to ensure that the facts mentioned are correct from the source.
NCM Investment nor any of its directors or employees shall in any way be held responsible for the contents of this news, and the information contained on this page is intended only to provide clients with publicly available information and should not be construed as investment advice, report or analysis and/or constitute an offer or invitation to buy or sell financial instruments of any kind.
RISK WARNING: Forex and CFDs are highly risky leveraged products, as losses can exceed deposits. Please ensure you understand all the risks and take independent advice if necessary. NCM will segregate the clients based on the criteria of the regulator and its bylaws. NCM does not provide any advisory service; the material published does not constitute advice or a recommendation for a transaction in any financial instrument. NCM accepts no responsibility for any use of the content presented and any consequences of that use. Anyone acting on the information provided does so at their own risk.