
- Contact Us:
-

-

-

-


Daily Market Updates
16 Sep 2022
EURUSD
It was an uneventful session for EUR/USD, as alternating risk appetite trends dominated the scenery on Thursday amidst the equally lack of direction in the greenback and the continuation of the march north in US yields across the curve.
On the latter, the short end rose north of the 3.80% level and kept the trade at multi-year highs, while the belly and the long end approached the 3.50% region, all against the backdrop of investors’ firmer conviction of a 75 bps rate raise by the Fed at its event next week.
No news in the more macro panorama in the euro area other than omnipresent concerns around the energy crunch vs. upcoming EU measures to try to contain spiraling gas prices, which directly impact on the inflation prospects.
Data wise in Euroland, final August inflation figures in France showed the CPI rose 0.5% inter-month and 5.9% from a year earlier. In addition, the trade deficit in the broader euro region increased to €34B in July.
Interesting calendar across the Atlantic, as Retail Sales expanded 0.3% MoM in August, Initial Claims rose by 213K in the week to September 10 and the Philly Fed Manufacturing Index eased to -9.9 for the current month. Further data saw Industrial Production contract 0.2% MoM in August and 3.7% YoY and Business Inventories increase 0.6% in July vs. the previous month.
Further upside in EUR/USD should meet initial resistance at the interim 55-day SMA at 1.0116 prior to the 7-month resistance line around 1.0180. Above this area, the pair could mitigate the downside pressure and attempt a test of the September high at 1.0197 (September 12) ahead of the 100-day SMA at 1.0320. North from here aligns the August top at 1.0368 (August 10) followed by the weekly peak at 1.0615 (June 27). On the contrary, initial contention is seen at the weekly low at 0.9955 (September 14) before the 2022 low at 0.9863 (September 6). The breach of the latter could prompt the December 2002 low at 0.9859 to emerge on the horizon ahead of the October 2002 low at 0.9685 (October 21). The daily RSI improves slightly to the vicinity of 46.
Resistance levels: 1.0023 1.0084 1.0197 (4H chart)
Support levels: 0.9955 0.9930 0.9863 (4H chart)
-637988637429669859.png)
USDJPY
The inconclusive price action in dollar and the march higher in US yields seems to have been enough to sponsor the recovery in USD/JPY to the vicinity of the 144.00 area on Thursday, partially reversing Wednesday’s decline.
Indeed, while the indecision dominated the greenback’s price action, US yields across the curve prolonged the upside momentum, with the 2-year note in multi-year highs near 3.90% and the 10-year benchmark approaching the 3.50%.
In the Japanese docket, the trade deficit widened to ¥2817.3B in August and Foreign. Bond Investment shrank to ¥140.7B in the week to September 10. Further data saw the Tertiary Industry Index contract 0.6% MoM in July.
USD/JPY remains firm and further gains should revisit the 2022 top at 144.99 (September 7) prior to the 145.41 level (August 21 1998) and followed by the all-time top at 147.67 (August 11 1998). Adversely, there is a minor support at the 141.50 level (September 9) ahead of the 55-day SMA at 137.27 and the weekly low at 135.80 (August 23). A deeper retracement could revisit the temporary 100-day SMA at 134.63 before the weekly low at 131.73 (August 11) and the August low at 130.39 (August 2), which is the last defense before an assault of the psychological 130.00 mark. The daily RSI advanced a tad beyond 66.
Resistance levels: 143.80 144.99 145.41 (4H chart)
Support levels: 142.54 141.50 140.24 (4H chart)
-637988638100404059.png)
GBPUSD
GBP/USD resumed the downside and dropped to multi-day lows in the 1.1460 region on Thursday.
The negative performance of the sterling came in response to the persistent bid bias in the greenback despite the US Dollar Index (DXY) advancing modestly on a daily basis and failing to retest/surpass the 110.00 barrier.
There were no data releases in the UK calendar on Thursday, as the BoE MPC meeting originally due on September 15 was postponed to September 22 following the death of Queen Elizabeth.
Next of relevance in the UK docket will be Friday’s Retail Sales for the month of August.
GBP/USD remains under heavy pressure and the continuation of the selling bias could drag the pair to the 2022 low at 1.1404 (September 7) ahead of the weekly low at 1.1060 (March 1985). On the upside, there is initial resistance at the September peak at 1.1738 (September 13) prior to the 50% Fibo retracement (of the August-September drop) at 1.1840. The trespass of this level could open the door to the weekly high at 1.1900 (August 26) seconded by the round level at 1.2000. North from here emerges the August top at 1.2293 (August 1) before the weekly peak at 1.2405 (June 16) and the 1.2666 level (May 27 high), which precedes the key 200-day SMA 1.2710. The daily RSI deflated to the 35 level.
Resistance levels: 1.1589 1.1738 1.1760 (4H chart)
Support levels: 1.1462 1.1460 1.1404 (4H chart)
-637988637730469019.png)
AUDUSD
The broad-based offered stance in the risk-associated galaxy weighed on the Aussie dollar and forced AUD/USD to revisit the 0.6700 neighbourhood on Thursday.
Also collaborating with the selling pressure surrounding AUD, the Australian labour market report disappointed expectations after the Unemployment Rate ticked higher to 3.5% in August (from 3.4%) and the Employment Change rose by 33.5K people (vs. 35k expected). In addition, Consumer Inflation Expectations eased to 5.4% in September (from 5.9%).
No help from the commodity space either following another downtick in copper prices while the tonne of iron ore kept hovering around the $100.00 mark.
The September low at 0.6698 (September 7) appears as the next support of note for in case sellers continue to dominate the sentiment around AUD/USD. The breach of this level could open the door to the 2022 low at 0.6681 (July 14) prior to the May 2020 low at 0.6372 (May 4) and the weekly low at 0.6253 (April 21 2020). On the upside, the immediate hurdle comes at the September top at 0.6916 (September 13) followed by the interim 100-day SMA at 0.6951. Further gains could retest the psychological 0.7000 yardstick prior to the weekly peak at 0.7008 (August 26) and the 200-day SMA at 0.7106. In case the bullish impulse accelerates, the August high at 0.7136 (August 11) could re-emerge on the horizon ahead of the June top at 0.7282 (June 3). The daily RSI eases below the 40 yardstick.
Resistance levels: 0.6770 0.6916 0.6956 (4H chart)
Support levels: 0.6702 0.6699 0.6681 (4H chart)
-637988638400892419.png)
GOLD
Prices of the ounce troy of gold finally capitulated to the bearish pressure and tumbled to levels last seen back in April 2020 around $1,660 on Thursday.
Despite the greenback traded without a clear direction, US yields accelerated their gains across the curve and sponsored the strong pullback in the yellow metal. In fact, while the short end returned to an area last seen in November 2007 near 3.90%, the belly flirted with the key 3.50% region.
Bullion, in the meantime, is expected to remain under scrutiny and at the mercy of the next steps from the Federal Reserve when it comes to normalizing its monetary conditions. Unfortunately for the precious metal, it looks likely that the Fed will keep its tighter-for-longer stance for quite some time.
Having broken below the 2022 low ($1,680), the door has now opened wider to further decline to, initially, the $1,641 level (April 8 2020) ahead of the April 2020 low at $1,572 (April 1). Conversely, the September peak at $1,735 (September 12) remains the initial up barrier followed by the interim 55-day SMA at $1,741 and the weekly high at $1,765 (August 25). The breakout of this level could pave the way for the August top at $1,807 (August 10) before the key 200-day SMA at $1,831 and the June peak at $1,879 (June 13).
Resistance levels: $1,735 $1,750 $1,765 (4H chart)
Support levels: $1,660 $1,641 $1,572 (4H chart)
-637988638788372327.png)
CRUDE WTI
WTI prices debilitated to weekly lows around $84.50 in response to omnipresent demand concerns, prospects of an economic slowdown and news citing an agreement between parties to avert a rail strike in the US.
Indeed, jitters surrounding prospects for a reduced demand for crude oil towards year end weighed on sentiment, particularly following gloomy forecasts from the Paris-based IEA on Wednesday.
In addition, the tighter stance from the Fed and the perception that further (and larger?) rate hikes remain in store for the next months added to persistent worries that a potential US recession could be in the offing.
Next on the downside for the WTI emerges the September low at $81.21 (September 8) prior to the key round level at $80.00 and before the 2022 low at $74.30 (January 3). In the opposite direction, the weekly high at $90.17 (September 14) comes first and precedes the September top at $90.37 (September 5). Beyond this level turns up the 200-day SMA at $97.01 ahead of the weekly peak at $97.65 (August 30) and the psychological $100.00 mark.
Resistance levels: $89.91 $90.37 $92.72 $97.75 (4H chart)
Support levels: $84.56 $81.18 $77.82 (4H chart)
-637988639558260058.png)
DOW JONES
Stocks gauged by the three major US stock indices added to the weekly leg lower amidst the generalized sour sentiment among market participants.
Indeed, expectations for further tightening by the Fed – including a ¾-point rate hike in September – were almost confirmed after US Retail Sales and weekly Claims came in on the strong side earlier on Thursday.
In addition, recent gains in the dollar coupled with the relentless move higher in US yields undermined the mood in the risk complex and added to the daily decline in equities.
That said, the Dow Jones retreated 0.14% to 31,091, the S&P500 dropped 0.76% to 3,916 and the tech-reference Nasdaq Composite receded 0.74% to 11,633.
If the Dow Jones breaches the September low at 30,885 (September 14) it could prompt the July low at 30,143 (July 14) to return to the investors’ radar prior to the 2022 low at 29,653 (June 17). On the contrary, there is an initial up barrier at the September peak at 32,504 (September 12) ahead of a Fibo level (of the July-August rally) at 32,700 and the 33,364 level (August 26). If the index breaks above the latter it could then dispute the key 200-day SMA at 33,503 before the August top at 34,281 (August 16). Extra recovery from here could see the April peak at 35,492 (April 21) revisited ahead of the February high at 35,824 (February 9). The daily RSI deflated below 38.
Top Performers: UnitedHealth, JPMorgan, Boeing.
Worst Performers: Salesforce Inc, Microsoft, IBM
Resistance levels: 32,124 32,504 33,364 (4H chart)
Support levels: 30,885 30,143 29,653 (4H chart)
-637988639916031497.png)
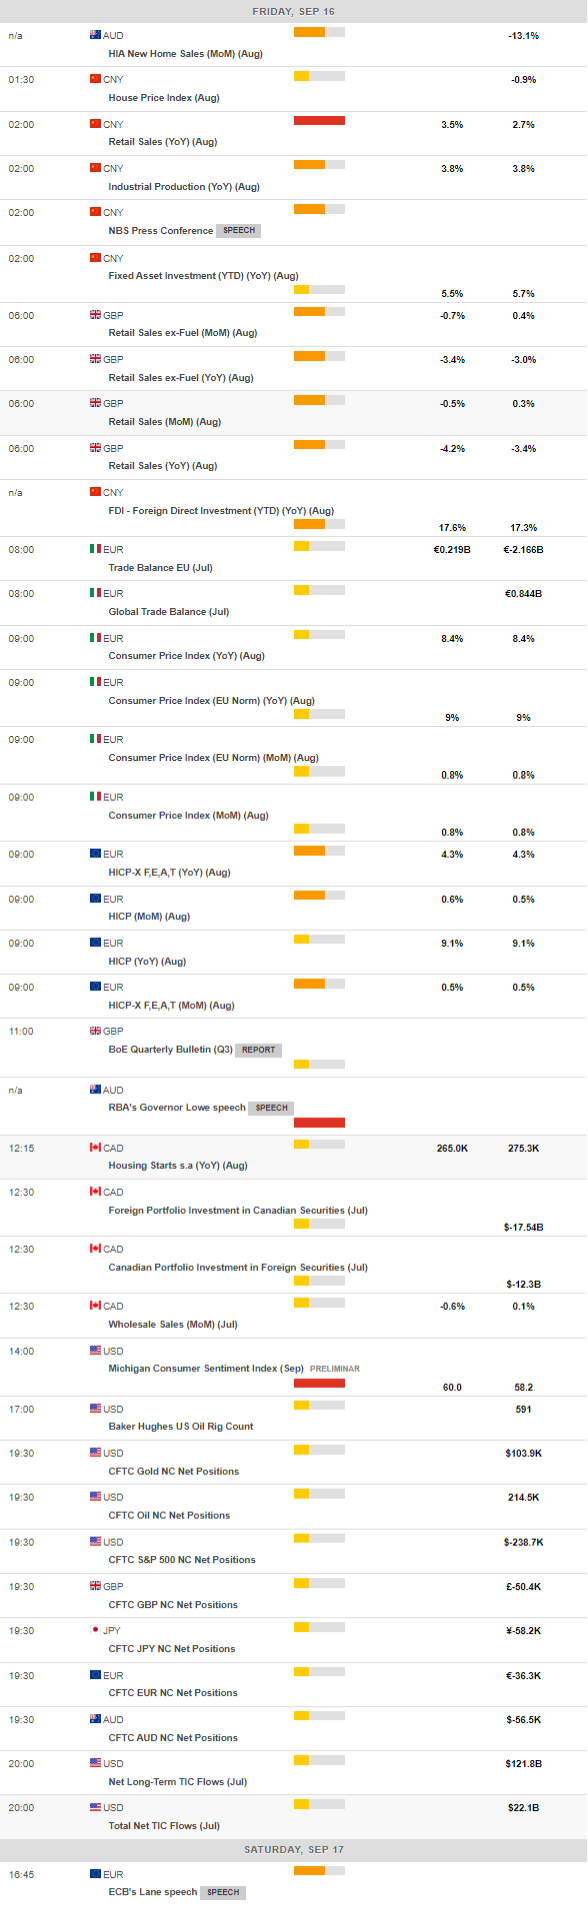
MACROECONOMIC EVENTS
All Information & Updates provided by:

All information relating to the financial markets available on this page has been prepared and issued by FXStreet (Forexstreet SL, Spain, Reg: B62498233) on the basis of publicly available information and all information believed to be reliable and does not conflict with Kuwaiti local laws, and all necessary care has been taken to before the company to ensure that the facts mentioned are correct from the source.
NCM Investment nor any of its directors or employees shall in any way be held responsible for the contents of this news, and the information contained on this page is intended only to provide clients with publicly available information and should not be construed as investment advice, report or analysis and/or constitute an offer or invitation to buy or sell financial instruments of any kind.
RISK WARNING: Forex and CFDs are highly risky leveraged products, as losses can exceed deposits. Please ensure you understand all the risks and take independent advice if necessary. NCM will segregate the clients based on the criteria of the regulator and its bylaws. NCM does not provide any advisory service; the material published does not constitute advice or a recommendation for a transaction in any financial instrument. NCM accepts no responsibility for any use of the content presented and any consequences of that use. Anyone acting on the information provided does so at their own risk.