
- Contact Us:
-

-

-

-


Daily Market Updates
20 Sep 2022
EURUSD
EUR/USD started the FOMC-week on the back foot and reversed three consecutive daily advances, probing once again the 0.9960 region before reclaiming the parity zone.
The corrective retracement came once again in response to increasing buying interest in the greenback, which translated into another bull run by the USD Index to the area north of the 110.00 mark.
Another positive session in US yields accompanied the daily strength in the buck, with the 2-year note already flirting with the 4.00% mark for the first time since October 2007 and the 10-year benchmark hovering around the 3.50% region, an area last seen in April 2011.
The relentless upside in yields and the improvement in the dollar remained underpinned by expectations of further tightening by the Fed. On this, a 75 bps rate hike on Wednesday appears largely priced in already, while the probability of a full-point raise gyrates around 20% as per CME Group’s FedWatch Tool.
Nothing worth mentioning in the domestic calendar, while ECB’s De Guindos reiterated that the size of the next rate hike remains data dependent and the Council did not discuss the exact level of the neutral rate. His colleague de Cos warned against second-round effects of inflation and stressed that weaker growth is not enough to bring down inflation.
A very light US docket saw the NAHB Housing Market Index worsen to 46 in September (from 49).
Extra weakness in EUR/USD should meet initial contention at the weekly low at 0.9944 (September 16) ahead of the 2022 low at 0.9863 (September 6). South from here emerges the December 2002 low at 0.9859 seconded by the October 2002 low at 0.9685 (October 21). On the flip side, bouts of strength are expected to initially revisit the 55-day SMA at 1.0101 before the 7-month resistance line near 1.0160. Above this region, the pair should see its downside pressure mitigated and this could open the door to a potential visit to the September peak at 1.0197 (September 12) prior to the 100-day SMA at 1.0310 and the August high at 1.0368 (August 10). The surpass of the latter could prompt the weekly top at 1.0615 (June 27) to re-emerge on the horizon. The daily RSI eased below the 46 level.
Resistance levels: 1.0036 1.0069 1.0197 (4H chart)
Support levels: 0.9944 0.9930 0.9863 (4H chart)
-637992089162199170.png)
USDJPY
USD/JPY seems to have now moved into a consolidative phase in the upper end of the yearly range, always tracking dollar dynamics and the developments from the US debt market.
Further improvement in US yields in the 2-year/10-year segment coupled with the late pick-up in the appetite for the riskier assets helped spot to stay in the positive territory and leave behind Friday’s humble pullback.
No data releases scheduled in the Japanese calendar at the beginning of the week left all the attention on the publication of inflation figures on Tuesday.
If USD/JPY breaks above the multi-session range bound it should dispute the 2022 high at 144.99 (September 7) prior to the 145.41 level (August 21 1998) and the all-time top at 147.67 (August 11 1998). In the opposite direction, there is initial support at the 141.50 level (September 9) ahead of the 55-day SMA at 137.54. The loss of this level exposes a probable drop to the weekly low at 135.80 (August 23) ahead of the 100-day SMA at 134.89 followed by the weekly low at 131.73 (August 11). If sellers remain in control, then the August low at 130.39 (August 2) could re-emerge on the horizon prior to the psychological 130.00 yardstick. The daily RSI improves marginally above 64.
Resistance levels: 143.80 144.99 145.41 (4H chart)
Support levels: 143.12 142.54 141.50 (4H chart)
-637992089951746654.png)
GBPUSD
GBP/USD managed to reverse another test of the mid-1.1300s in response to the initial strength in the dollar, although the later loss of momentum in the USD Index (DXY) sponsored the rebound in the sterling and the rest of its risk-associated peers.
Despite the bounce off levels seen back in 1985, the British pound is expected to remain under the microscope in the next sessions in light of the FOMC event and the BoE MPC meeting, on Wednesday and Thursday, respectively.
It is worth noting that the “Old Lady” is forecast to extend its hiking cycle, this time by 50 bps, amidst the deteriorating outlook for the UK economy.
In addition, UK markets and the calendar were empty on Monday following the State Funeral of Queen Elizabeth II holiday.
GBP/USD continues to face immediate contention at the 2022 low 1.1350 (September 16). The breach of this level is expected to meet the next support of note at the weekly low at 1.1060 (March 1985). Contrarily, there is initial resistance at the September top at 1.1738 (September 13) seconded by the weekly peak at 1.1900 (August 26) and the round level at 1.2000. Further north comes the August high at 1.2293 (August 1) ahead of the weekly top at 1.2405 (June 16). If cable breaks below the latter it could then challenge the 1.2666 level (May 27) before the key 200-day SMA 1.2692. The daily RSI looks stable near 33.
Resistance levels: 1.1446 1.1589 1.1738 (4H chart)
Support levels: 1.1350 1.1060 1.0805 (4H chart)
-637992089512302638.png)
AUDUSD
AUD/USD traded on the defensive at the beginning of the week, retesting the area of 2022 lows near 0.6670 and resuming the downside after Friday’s small advance.
The intense upside momentum in the US dollar put the pair under pressure, while the generalized negative performance of the commodity galaxy added to the sour mood around the Aussie dollar. On this, prices of copper reversed the recent improvement, while the tonne of iron ore dropped to fresh lows in the $98.00 zone.
Nothing worth mentioning data wise Down Under, whereas the release of the RBA Minutes of the September meeting is expected to grab all the attention on Tuesday.
No changes to the downside in AUD/USD, as a breakdown of the 2022 low at 0.6669 (September 16) could pave the way for a visit to the May 2020 low at 0.6372 (May 4) seconded by the weekly low at 0.6253 (April 21 2020). The initial up barrier aligns at the September high at 0.6916 (September 13), which is closely followed by the temporary 100-day SMA at 0.6944 ahead of the psychological 0.7000 level. Once cleared, the weekly top at 0.7008 (August 26) should return to the investors’ radar prior to the 200-day SMA at 0.7102. A trespass of the latter could facilitate a move to the August peak at 0.7136 (August 11) ahead of the June high at 0.7282 (June 3). The daily RSI appears directionless around 40.
Resistance levels: 0.6734 0.6770 0.6885 (4H chart)
Support levels: 0.6669 0.6567 0.6505 (4H chart)
-637992090270387023.png)
GOLD
Prices of the ounce troy of the precious metal partially faded Friday’s positive session and charted modest losses in a context where investors favoured the dollar and US yields rose for yet another session, particularly in the short end and the belly of the curve.
The upcoming Fed’s decision on interest rates (Wednesday) is expected to keep bullion prices depressed and refocused on the downside following the recent drop to new lows in an area last seen in mid-April 2020 near $1,650.
The continuation of the downtrend in gold should clear the 2022 low at $1,654 ahead of the $1,641 level (April 8 2020) and the April 2020 low at $1,572 (April 1). Inversely, the September top at $1,735 (September 12) emerges as the immediate target in case of any bullish attempts. This area remains propped up by the 55-day SMA at $1,736 and precedes the $1,765 level (August 25) ahead of the 100-day SMA at $1,783. Beyond this region appears the August high at $1,807 (August 10) seconded by the key 200-day SMA at $1,830 and the June top at $1,879 (June 13).
Resistance levels: $1,680 $1,707 $1,735 (4H chart)
Support levels: $1,654 $1,641 $1,572 (4H chart)
-637992090599485823.png)
CRUDE WTI
WTI prices opened the week in a volatile fashion, dropping to as low as the vicinity of the $82.00 mark per barrel just to reverse that move later and reclaim the area above the $85.00 yardstick.
Price action in crude oil moved back and forth following usual tight supply concerns along with demand woes stemming from recession fears, which remained in turn bolstered by the ongoing tightening cycle by the Federal Reserve and other major central banks.
Further developments around the commodity came from the possibility that the Iran-West talks to revive the 2015 nuclear deal could resume in the near term, while easing lockdown measures in China and the recent failure by the OPEC to hit their output goals in August also added to Monday’s high volatility.
Later in the session, the API and the EIA will report on the usual US crude oil stockpiles in the week to September 16.
If sellers keep WTI under pressure, then the next target aligns at the September low at $81.21 (September 8), which is closely followed by the key round level at $80.00. The breakdown of this level could pave the way for another visit to the 2022 low at $74.30 (January 3). Next on the upside, in the meantime, emerges the weekly peak at $90.17 (September 14) before the September high at $90.37 (September 5). If the rebound gathers steam, then the 200-day SMA at $97.14 could return to the radar ahead of the weekly top at $97.65 (August 30) and the psychological $100.00 mark.
Resistance levels: $86.58 $89.62 $90.37 (4H chart)
Support levels: $82.08 $81.18 $77.82 (4H chart)
-637992091324387877.png)
DOW JONES
The broad-based lack of a clear direction in prices and rising prudence among investors dominated the sentiment in the US stock markets at the beginning of the week.
Indeed, market participants remained cautious on Monday ahead of the upcoming FOMC event, while persistent recession concerns kept the buying interest subdued against the backdrop of the firm conviction of a ¾ point rate hike later on Wednesday.
That said, the Dow Jones shed 0.12% to 30,785, the S&P500 dropped 0.14% to 3,867 and the tech-benchmark Nasdaq Composite retreated 0.02% to 11,446.
The September low at 30,550 (September 16) is expected to hold the downside in the short-term horizon in the Dow Jones. The breach of this level could lead up to a probable retracement to the July low at 30,143 (July 14) prior to the 2022 low at 29,653 (June 17). On the other hand, there is an initial hurdle at the September top at 32,504 (September 12) ahead of a Fibo level (of the July-August rally) at 32,700, which is followed by the 33,364 level (August 26). North from here turns up the key 200-day SMA at 33,468 before the August high at 34,281 (August 16). If the Dow clears the latter, then it could challenge the April top at 35,492 (April 21) ahead of the February peak at 35,824 (February 9). The daily RSI eased a tad and approached 35.
Top Performers: Nike, Apple, Caterpillar
Worst Performers: Merck&Co, J&J, Walgreens Boots
Resistance levels: 31,277 32,067 32,504 (4H chart)
Support levels: 30,550 30,143 29,653 (4H chart)
-637992091705980959.png)
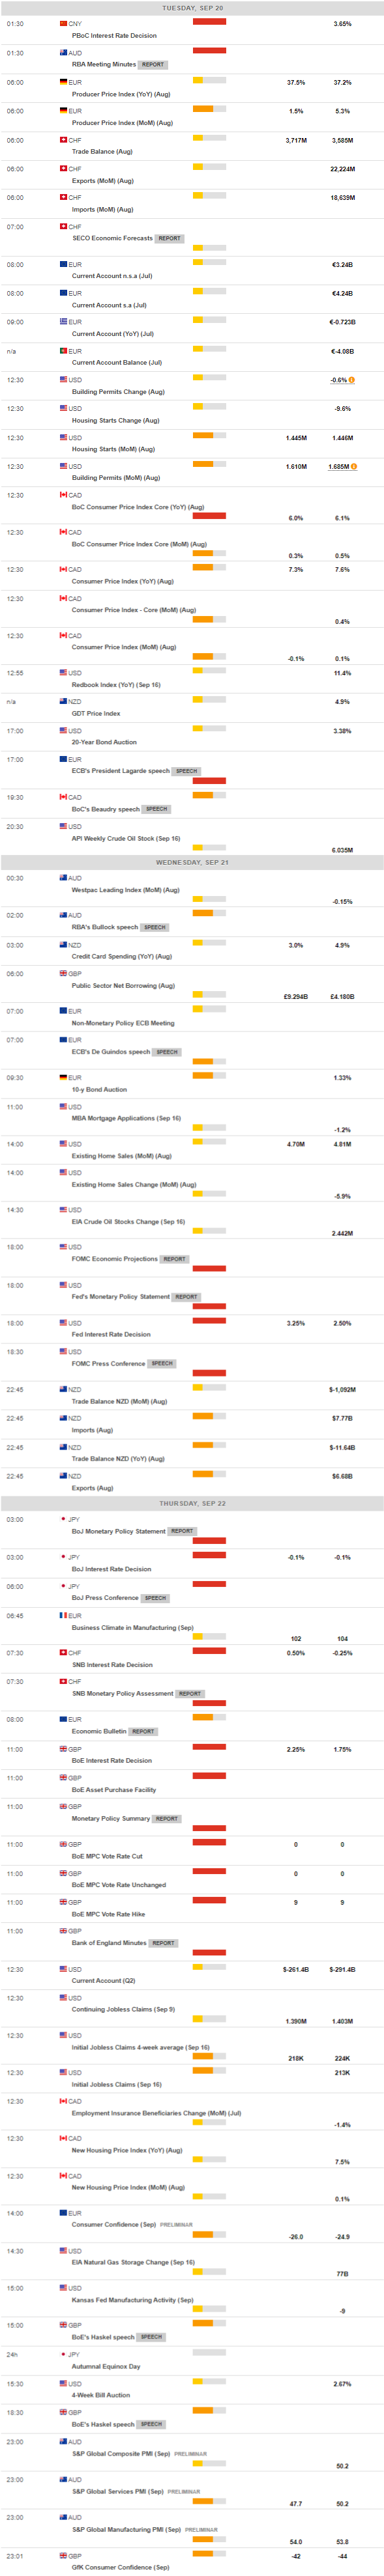
MACROECONOMIC EVENTS
All Information & Updates provided by:

All information relating to the financial markets available on this page has been prepared and issued by FXStreet (Forexstreet SL, Spain, Reg: B62498233) on the basis of publicly available information and all information believed to be reliable and does not conflict with Kuwaiti local laws, and all necessary care has been taken to before the company to ensure that the facts mentioned are correct from the source.
NCM Investment nor any of its directors or employees shall in any way be held responsible for the contents of this news, and the information contained on this page is intended only to provide clients with publicly available information and should not be construed as investment advice, report or analysis and/or constitute an offer or invitation to buy or sell financial instruments of any kind.
RISK WARNING: Forex and CFDs are highly risky leveraged products, as losses can exceed deposits. Please ensure you understand all the risks and take independent advice if necessary. NCM will segregate the clients based on the criteria of the regulator and its bylaws. NCM does not provide any advisory service; the material published does not constitute advice or a recommendation for a transaction in any financial instrument. NCM accepts no responsibility for any use of the content presented and any consequences of that use. Anyone acting on the information provided does so at their own risk.