
- Contact Us:
-

-

-

-


Daily Market Updates
21 Sep 2022
EURUSD
EUR/USD reversed part of the gradual weekly upside and revisited the 0.9950 region after meeting quite decent resistance in the 1.0050 zone on turnaround Tuesday.
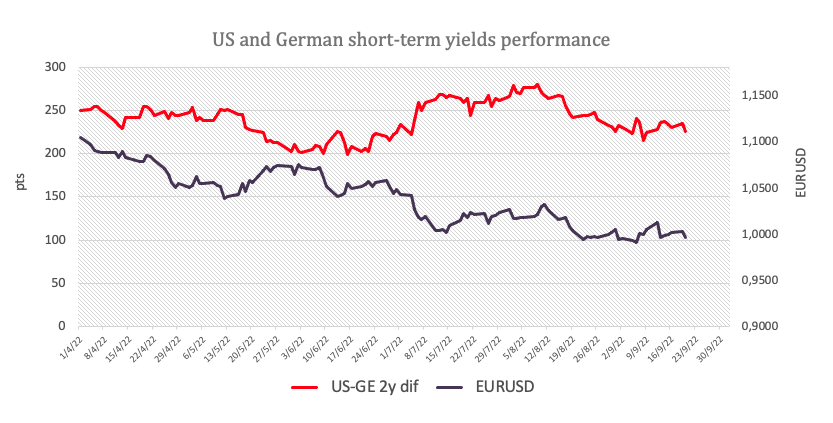
The renewed upside bias in the greenback prompted the USD Index (DXY) to leave behind two daily pullbacks in a row and reclaim the area beyond the 110.00 yardstick on the back of another daily gain in US yields.
On the latter, expectation of the tighter-for-longer stance from the Federal Reserve continued to underpin the rally in the short end of the curve to levels last seen in October 2007 near 4.0%, while the belly printed fresh tops near 3.55%, an area last traded back in April 2011.
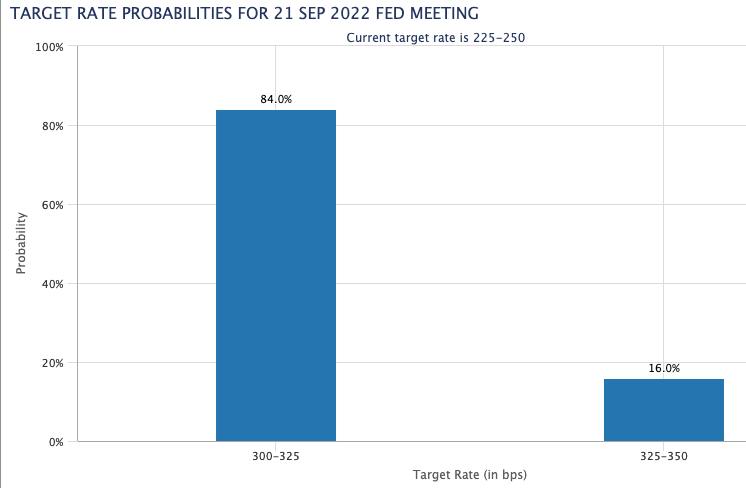
No news regarding the upcoming rate hike by the Federal Reserve, as investors remained largely biased towards a ¾ point raise, while the probability of a 100 bps hike looked marginal around 16% as per CME Group’s FedWatch Tool.
Nothing to write home about in the euro docket left the attention to the US calendar, which saw Housing Starts expand 12.2% MoM in August – or 1.575M units – and Building Permits contract 10.0% MoM – or 1.517M units.
In case the correction in EUR/USD picks up pace, then the next contention is expected at the weekly low at 0.9944 (September 16) prior to the 2022 low at 0.9863 (September 6). The loss of the latter could put the December 2002 low at 0.9859 back on the radar ahead of the October 2002 low at 0.9685 (October 21). On the upside, there is a minor hurdle at the weekly peak at 1.0050 (September 20) followed by the 55-day SMA at 1.0097. Beyond this level emerges the the 7-month resistance line around 1.0150, which, once surpassed, it should reduce the pair’s downside pressure and allow for a probable move to the September high at 1.0197 (September 12) followed by the 100-day SMA at 1.0305 and the August top at 1.0368 (August 10. The daily RSI deflated a tad below 44.
Resistance levels: 1.0050 1.0065 1.0197 (4H chart)
Support levels: 0.9965 0.9944 0.9930 (4H chart)
-637992960184986755.png)
USDJPY
USD/JPY added to the optimism seen at the beginning of the week and charted decent gains on Tuesday. The pair’s bull run, however, faltered just ahead of the key 144.00 hurdle.
The solid resumption of the upside bias in the dollar in combination with soaring US yields across the curve maintained the bullish stance in spot, which kept the side-lined mood unchanged in the upper end of the range and always with the Fed-BoJ policy divergence playing in the background.
In Japan, the Inflation Rate ticked higher to 3.0% YoY in August (from 2.6%), while the Core Inflation Rate rose above estimates 2.8% from a year earlier and Inflation Rate Ex-Food and Energy increased 1.6% YoY (from 1.2%).
USD/JPY continues to face the immediate up barrier at the 2022 top at 144.99 (September 7) ahead of the 145.41 level (August 21 1998) and the all-time peak at 147.67 (August 11 1998). Contrarily, immediate contention emerges at the 141.50 level (September 9) followed by the 55-day SMA at 137.69. The breakdown of the latter could open the door to the weekly low at 135.80 (August 23) prior to the 100-day SMA at 135.02 and before the weekly low at 131.73 (August 11). A deeper correction could expose the August low at 130.39 (August 2), which precedes the psychological 130.00 mark. The daily RSI advances modestly above 65.
Resistance levels: 143.92 144.99 145.41 (4H chart)
Support levels: 142.93 142.63 141.50 (4H chart)
-637992961698155253.png)
GBPUSD
The quite strong rebound in the greenback weighs on the risk complex and sponsors another negative session in GBP/USD.
Indeed, the dollar’s advance forced cable to surrender earlier gains to the 1.1460 region and spark a corrective decline to the 1.1360 zone on Tuesday, just pips away from the 2022 low.
The poor performance of the British pound came in stark contrast to the move higher in the UK 10-year Gilt yields to levels last seen back in July 2011 beyond 3.30%.
The UK calendar was empty on Tuesday and the next releases of note will be Wednesday’s Public Sector Net Borrowing figures as well as the CBI Industrial Trends Orders results for the current month.
Further losses in GBP/USD target the 2022 low 1.1350 (September 16), while a deeper pullback is not expected to meet any support levels of note until the weekly low at 1.1060 (March 1985). On the other hand, the September peak at 1.1738 (September 13) should emerge as the initial up barrier seconded by the weekly high at 1.1900 (August 26) and the round level at 1.2000. The surpass of the latter could open the door to the August top at 1.2293 (August 1) prior to the weekly peak at 1.2405 (June 16). Beyond this region, a potential test of the 1.2666 level (May 27) could emerge on the horizon before the key 200-day SMA 1.2683. The daily RSI eased further and approached the key 30 mark.
Resistance levels: 1.1460 1.1589 1.1738 (4H chart)
Support levels: 1.1350 1.1060 1.0805 (4H chart)
-637992961277007861.png)
AUDUSD
The dollar’s recovery put the high-beta currencies under pressure and forced AUD/USD to surrender two consecutive sessions with gains and refocus on the downside on turnaround Tuesday.
The pair derived extra weakness from the poor performance of the commodity space, where copper prices saw another day with losses and the iron ore remained on the defensive around the $98.00 zone per tonne.
No impact whatsoever on the Aussie dollar from the release of the RBA Minutes of the September meeting, where the Board acknowledged that interest rates rose rapidly and are now approaching normal levels. In addition, members expect inflation to peak later this year, while further rate hikes are likely in the upcoming months.
Next on tap in the Australian calendar will be the Westpac Leading Index, due on Wednesday.
If bears push harder, AUD/USD could dispute the 2022 low at 0.6669 (September 16) ahead of the May 2020 low at 0.6372 (May 4) and the weekly low at 0.6253 (April 21 2020). On the upside, the September top at 0.6916 (September 13) comes first just before the interim 100-day SMA at 0.6940 and the psychological 0.7000 mark. Beyond the latter, a test of the weekly peak at 0.7008 (August 26) could emerge on the horizon ahead of the 200-day SMA at 0.7100. North from here turns up the August high at 0.7136 (August 11) before the June top at 0.7282 (June 3). The daily RSI lost the grip and revisited the 38 area.
Resistance levels: 0.6747 0.6770 0.6885 (4H chart)
Support levels: 0.6669 0.6567 0.6505 (4H chart)
-637992962104875404.png)
GOLD
Gold prices resumed the downside and left behind two straight daily advances on Tuesday, returning to the $1,660 region per ounce troy.
In fact, the relentless rally in US yields pushed once again the short end and the belly of the curve to fresh multi-year highs near 4.00% and past 3.50%, respectively, all against the backdrop of the strong comeback of the dollar.
No easy hours ahead for bullion, as the Fed is expected to raise the FFTR by 75 bps at its event on Wednesday and Chief Powell’s press conference is unlikely to fall on the dovish camp.
If the downside pressure around gold gathers steam and the yellow metal breaks below the 2022 low at $1,654, then it could confront the $1,641 level (April 8 2020) prior to the April 2020 low at $1,572 (April 1). In the opposite direction, there is an immediate resistance at the September peak at $1,735 (September 12), which remains reinforced by the 55-day SMA and comes ahead of the $1,765 level (August 25). The surpass of this area exposes the 100-day SMA at $1,781 before the August top at $1,807 (August 10). Extra gains could see the key 200-day SMA at $1,830 revisited prior to the June peak at $1,879 (June 13).
Resistance levels: $1,680 $1,707 $1,735 (4H chart)
Support levels: $1,654 $1,641 $1,572 (4H chart)
-637992962556268565.png)
CRUDE WTI
Usual recession concerns fuelled by the upcoming extra tightening by the Federal Reserve (and other major central banks) weighed on traders’ sentiment on Tuesday and sponsored the second daily pullback in a row in prices of the American reference for the sweet light crude oil, this time revisiting the $83.00 mark per barrel.
Somewhat limiting the downside appeared unabated supply jitters coupled with recent news that the OPEC failed to meet its production goal during last month.
Later in the NA session, the American Petroleum Institute will publish its weekly report on US crude oil inventories in the week to September 16.
There is a minor support at the so far weekly low at $82.11 (September 19) just ahead of the September low at $81.21 (September 8). The breakdown of this level is expected to put a visit of the key round level at $80.00 back on the traders’ radar prior to the 2022 low at $74.30 (January 3). Inversely, the weekly high at $90.17 (September 14) appears as the immediate hurdle ahead of the September top at $90.37 (September 5) and the 200-day SMA at $97.20. If the WTI leaves behind the latter, it could then challenge the weekly peak at $97.65 (August 30) followed by the psychological $100.00 mark.
Resistance levels: $86.58 $89.62 $90.37 (4H chart)
Support levels: $82.08 $81.18 $77.82 (4H chart)
-637992963262496088.png)
DOW JONES
Equities gauged by the three major US stock indices extended further the monthly pullback, as investors braced for impact ahead of the largely anticipated 75 bps rate hike by the Fed at its gathering on Wednesday.
Indeed, sellers dominated Tuesday’s session against the backdrop of rising concerns over the probability of a tighter stance by the FOMC in the next months, an expected hawkish tilt at Powell’s press conference and potentially gloomy updates for economic projections.
Against that, the Dow Jones retreated 1.42% to 30,580, the S&P500 shed 1.41% to 3,845 and the tech-heavy Nasdaq Composite dropped 1.46% to 11,367.
The Dow Jones clinched a new September low at 30,465 (September 20). If this level is breached, then a potential test of the July low at 30,143 (July 14) could start shaping up ahead of the 2022 low at 29,653 (June 17). Occasional bullish attempts, in the meantime, are expected to meet the initial hurdle at the September peak at 32,504 (September 12) before a Fibo level (of the July-August rally) at 32,700. If the Dow breaks above this area it could then confront the 33,364 level (August 26) prior to the key 200-day SMA at 33,448 and the August top at 34,281 (August 16). In case the recovery picks up pace, the April peak at 35,492 (April 21) could resurface on the horizon before the February high at 35,824 (February 9). The daily RSI recedes to the sub-35 zone.
Top Performers: Apple, Boeing, Procter&Gamble
Worst Performers: Nike, Caterpillar, Home Depot
Resistance levels: 31,277 32,039 32,504 (4H chart)
Support levels: 30,465 30,143 29,653 (4H chart)
-637992963849426432.png)
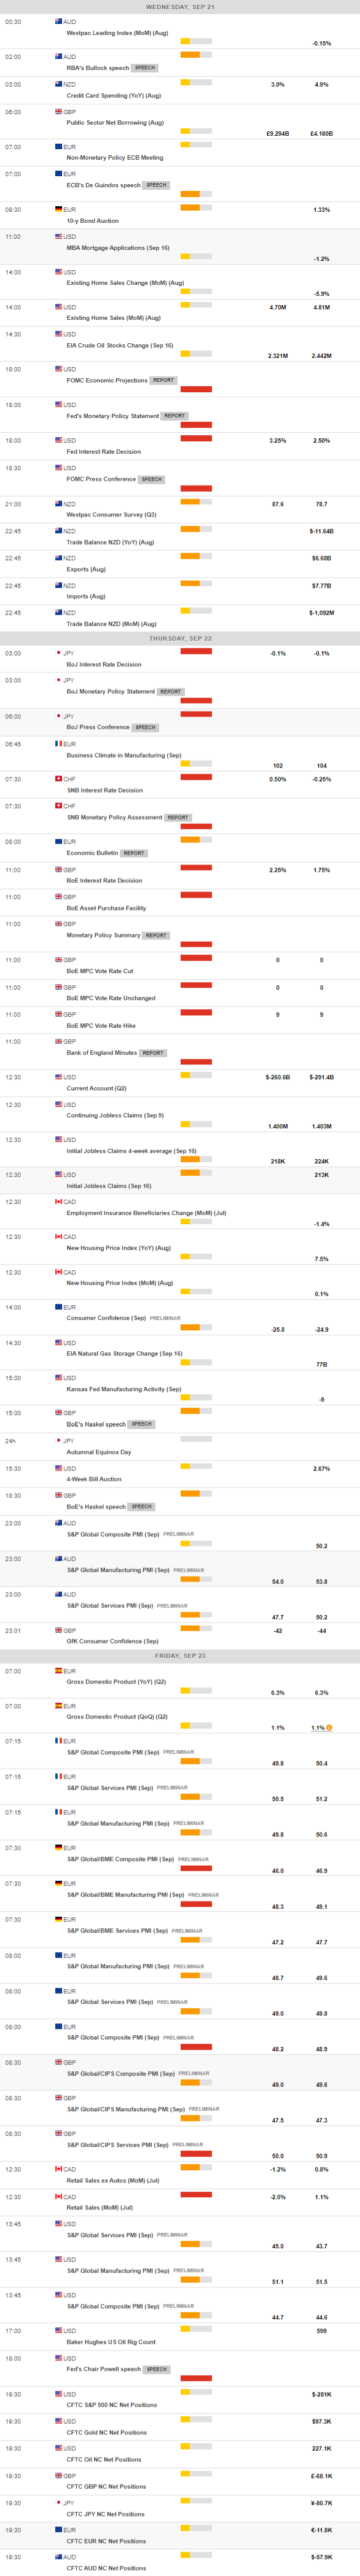
MACROECONOMIC EVENTS
All Information & Updates provided by:

All information relating to the financial markets available on this page has been prepared and issued by FXStreet (Forexstreet SL, Spain, Reg: B62498233) on the basis of publicly available information and all information believed to be reliable and does not conflict with Kuwaiti local laws, and all necessary care has been taken to before the company to ensure that the facts mentioned are correct from the source.
NCM Investment nor any of its directors or employees shall in any way be held responsible for the contents of this news, and the information contained on this page is intended only to provide clients with publicly available information and should not be construed as investment advice, report or analysis and/or constitute an offer or invitation to buy or sell financial instruments of any kind.
RISK WARNING: Forex and CFDs are highly risky leveraged products, as losses can exceed deposits. Please ensure you understand all the risks and take independent advice if necessary. NCM will segregate the clients based on the criteria of the regulator and its bylaws. NCM does not provide any advisory service; the material published does not constitute advice or a recommendation for a transaction in any financial instrument. NCM accepts no responsibility for any use of the content presented and any consequences of that use. Anyone acting on the information provided does so at their own risk.