
- Contact Us:
-

-

-

-


Daily Market Updates
22 Sep 2022
EURUSD
EUR/USD dropped to fresh 2-decade lows around 0.9800 on the back of the acute upside in the greenback, which managed to clinch fresh cycle highs well past the 111.00 barrier when tracked by the USD Index (DXY) on Wednesday. The pair, however, met some dip-buying sentiment and rebounded to the vicinity of the 0.9900 region during Powell’s press conference, as the dollar also gave away part of the initial violent uptick.
The continuation of the upside bias in the greenback came soon after the Federal Reserve hiked rates by 75 bps to 3.00%-3.25%, as largely telegraphed, while the lack of surprises from Chair Powell encouraged some sellers to return to the dollar.
From the statement, the Fed revised up its interest rate projections for the 1st year at 4.6% (from 3.8%), the 2nd year at 3.9% (from 3.4%) and the 3rd year at 2.9% (from 2.1%).
Furthermore, the Committee now sees the real GDP expanding 0.2% in 2022 and 1.2% in 2023, the unemployment rate at 3.8% this year and 4.4% in the next one and the headline PCE at 5.4% in 2022 and 2.8% in 2023.
Additionally, the vote to raise rates was unanimous and the Committee added that ongoing rate hikes will be appropriate, while it remains ready to adjust policy as needed and reiterated the pledge to bring inflation down to the Fed’s goal. The updated dots plot showed the median forecast now signals rates around 4.4% by year end.
On his usual press conference, Chair Powell reiterated the Fed’s commitment to bring inflation back to the 2% target, at the time when he noted that the economy slowed down from 2021, the housing sector weakened significantly and that the labour market remained extremely tight. Regarding inflation expectations, Powell noted that they remained anchored and that reducing inflation will come in tandem with a softer labour market and economic conditions. In addition, the pace of the upcoming rate hikes will be data dependent and that the Fed Funds will need to be in the restrictive territory for some time. He also suggested that the terminal rate in 2023 will be around 4.6% and reiterated that at some point it will be appropriate to slow the pace of the tightening process. Powell also noted the dwindling chances of a soft landing.
Following the FOMC event and Powell’s presser, US yields in the belly and the long end of the curve came under pressure and reversed initial gains, while the short end remained above the 4.00 mark, or multi-year highs.
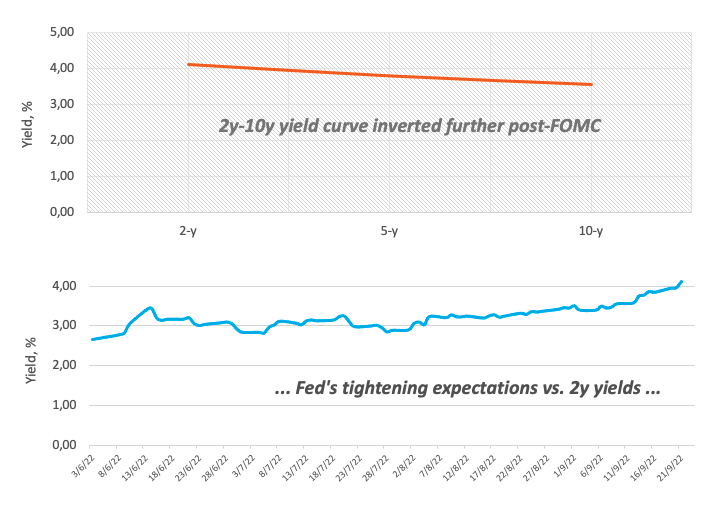
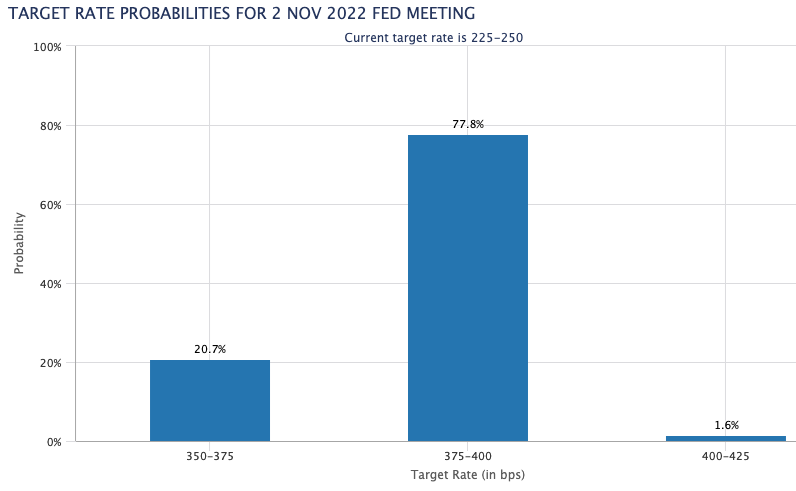
According to CME Group’s FedWatch Tool, the probability of another 75 bps rate hike at the November 2 gathering is now at nearly 78%.
Other than the FOMC meeting, the US docket showed MBA Mortgage Applications expanded 3.8% in the week to September 16 and Existing Home Sales contracted 0.4% MoM in August, or 4.8M units.
EUR/USD recorded a new 2022 low at 0.9812 (September 21) and by doing so it has opened the door to a deeper pullback which should meet the next contention of note not before the October 2002 low at 0.9685 (October 21). On the flip side, initial resistance aligns at the weekly high at 1.0050 (September 20) seconded by the 55-day SMA at 1.0090. Beyond this region, the pair should face the 7-month resistance line around 1.0140. Spot needs to clear the latter to allow for a potential challenge of the September top at 1.0197 (September 12) prior to the 100-day SMA at 1.0297 and the August peak at 1.0368 (August 10). The daily RSI lost extra ground and revisited the 37 region.
Resistance levels: 1.0050 1.0065 1.0197 (4H chart)
Support levels: 0.9812 0.9685 0.9608 (4H chart)
-637993857283423201.png)
USDJPY
USD/JPY added to the weekly rebound and reclaimed the 144.70 area just to give away all of that advance and drop to the negative ground in response to the loss of upside traction in the dollar and the US 10-year and 30-year bond yields.
In fact, the pair climbed to new multi-session highs on the back of the intense upside in the dollar, this time exacerbated after the Fed raised rates by 75 bps. However, the initial optimism faded after Chair Powell failed to ignite a more lasting upside momentum in the currency, while yields returned to the negative territory.
The Fed’s decision to hike rates sharply contrast with the ultra-accommodative stance from the BoJ and remains supportive of further upside in the pair for the time being. Furthermore, the BoJ is broadly forecast to keep its monetary conditions unchanged at its meeting early on Thursday.
The were no data releases scheduled in the Japanese calendar on Wednesday, leaving all the attention to the BoJ Interest Rate decision early on Thursday.
USD/JPY trades at shouting distance from the 2022 peak at 144.99 (September 7). The surpass of this zone exposes the 145.41 level (August 21 1998) ahead of the all-time high at 147.67 (August 11 1998). On the contrary, the 141.50 level (September 9) emerges as the initial support for bears seconded by the 55-day SMA at 137.84 and the weekly low at 135.80 (August 23). Still on the downside emerges the temporary 100-day SMA at 135.18 prior to the weekly low at 131.73 (August 11) and the August low at 130.39 (August 2), just before the psychological 130.00 yardstick. The daily RSI dropped to the sub-65 region.
Resistance levels: 144.70 144.99 145.41 (4H chart)
Support levels: 142.93 142.63 141.50 (4H chart)
-637993860261205484.png)
GBPUSD
There was no respite for the downside pressure in GBP/USD, which this time broke below the 1.1300 neighbourhood to visit the 1.1235/30 band for the first time since mid-March 1985. Cable, however, managed to reverse that sharp drop and regained the 1.1300 region afterwards, in line with the broad-based bounce in the risk complex from daily lows.
As usual, dollar dynamics were behind the second consecutive daily drop in the pair, a trend that has been gathering traction pari passu with the deteriorating outlook for the UK economy since the beginning of August.
The bearish note in the sterling intensified on Wednesday after the Fed raised the Fed Funds Target Range (FFTR) by ¾ point, a move that was widely expected by the FX community.
In the UK, Public Sector Net Borrowing shrank to £11.06B during August and CBI Industrial Trends Orders improved to -2 for the current month.
The loss of the 2022 low at 1.1234 (September 21) should prompt GBP/USD to refocus the attention on the weekly low at 1.1060 (March 1985). On the upside, there is a minor resistance at the weekly peak at 1.1460 (September 20) ahead of the September high at 1.1738 (September 13) and the weekly top at 1.1900 (August 26). Further up awaits the round level at 1.2000 before the August peak at 1.2293 (August 1) and ahead of the weekly high at 1.2405 (June 16). The daily RSI entered the oversold territory around 29.
Resistance levels: 1.1460 1.1589 1.1738 (4H chart)
Support levels: 1.1234 1.1060 1.0805 (4H chart)
-637993859932219192.png)
AUDUSD
Gains in the greenback picked up extra pace after the Fed delivered a 75 bps rate hike, although Chief Powell’s message at his press conference disappointed dollar bulls.
Against that, AUD/USD surrendered further ground and dropped to fresh lows in an area last traded back in June 2020 near 0.6620 just to reverse that deep pullback and regain the vicinity of 0.6900 towards the end of the session.
The generalized negative performance in the commodity universe also weighed on the Aussie dollar, with copper prices retreating for the third session in a row and the tonne of iron ore treading water around the $98.00 zone.
No consequences for the currency after RBA Deputy Governor M.Bullock suggested earlier on Wednesday that monthly inflation figures in Australia are unlikely to have an impact on the central bank’s meeting next month. Bullock also showed concerns over the health of the Chinese economy as well as the current zero-COVID policy and developments from the housing market.
In Oz, the Westpac Leading Index contracted at a monthly 0.1% in August.
A drop below the 2022 low at 0.6621 (September 21) could pave the way for AUD/USD to revisit the May 2020 low at 0.6372 (May 4) followed by the weekly low at 0.6253 (April 21 2020). On the other hand, there is a minor up barrier at the weekly top at 0.6747 (September 20). If the rebound picks up pace, then the September peak at 0.6916 (September 13) could emerge on the horizon ahead of the 100-day SMA at 0.6934, which is closely followed by the psychological 0.7000 yardstick. If the pair clears this region, it could then dispute the weekly high at 0.7008 (August 26) prior to the 200-day SMA at 0.7097 and the August top at 0.7136 (August 11). The daily RSI deflated further and broke below 38.
Resistance levels: 0.6747 0.6770 0.6885 (4H chart)
Support levels: 0.6621 0.6567 0.6505 (4H chart)
-637993860658690057.png)
GOLD
Gold managed well to climb to the proximity of the $1,690 region and clinch fresh multi-session highs despite the persistent dollar strength and following the rate hike by the Federal Reserve.
The yellow metal bounced off lows near $1,650 along with the retracement from cycle highs in the USD Index (DXY) and the later pullback in US yields in the belly and the long end of the curve, both after hitting fresh peaks soon after the Fed’s decision to raise the FFTR to 3.00%-3.25% on Wednesday.
The 2022 low at $1,653 (September 21) is expected to initially hold the downside ahead of the $1,641 level (April 8 2020) and before the April 2020 low at $1,572 (April 1). Immediately to the upside comes the September high at $1,735 (September 12), which still appears propped up by the 55-day SMA and emerges prior to the $1,765 level (August 25). If bullion trespasses the latter, then a potential test the 100-day SMA at $1,779 could start shaping up ahead of the August peak at $1,807 (August 10) and the key 200-day SMA at $1,829.
Resistance levels: $1,688 $1,707 $1,735 (4H chart)
Support levels: $1,653 $1,641 $1,572 (4H chart)
-637993861005146500.png)
CRUDE WTI
Prices of the WTI extended the negative mood and kept the weekly decline well and sound around the $83.00 region per barrel on Wednesday.
In fact, persevering recession concerns did nothing but intensify after the Federal Reserve raised rates at its meeting on Thursday. Also collaborating with the downbeat mood in the commodity, the dollar climbed to new 20-year peaks when tracked by the USD Index (DXY) and the EIA’s weekly report noted the demand for gasoline shrank to levels last seen back in February.
Still on the EIA, US crude oil inventories went up by 1.142M barrels in the week to September 16, while supplies at Cushing rose by 0.343M barrels and gasoline stockpiles increased by 1.569M barrels.
-637993861772684871.png)
WTI bears still face the next support at the weekly low at $82.11 (September 19) prior to the September low at $81.21 (September 8). If crude oil breaks below the latter, it could then attempt a move to the key round level at $80.00 ahead of the 2022 low at $74.30 (January 3). On the other hand, there is an initial up barrier at the weekly top at $90.17 (September 14) closely followed by the September peak at $90.37 (September 5). North from here turns up the 200-day SMA at $97.26 before the weekly high at $97.65 (August 30), which is deemed as the last defense for an assault of the psychological $100.00 mark.
Resistance levels: $86.66 $89.04 $90.37 (4H chart)
Support levels: $82.58 $81.18 $77.82 (4H chart)
-637993861690512473.png)
DOW JONES
US equities traded on a volatile mood post-FOMC event, where the Fed hiked rates by 75 bps at its meeting on Wednesday.
At his press conference, Powell did reiterate the Fed’s strong commitment to bring inflation down and suggested that chances of a soft landing have diminished. He also emphasized that the policy stance will be restrictive for some time and that the decision-making process regarding upcoming rate hikes will remain data dependent.
Investors faded the initial uptick in stocks, as worries over a tighter-for-longer Fed remained well in place.
That said, the Dow Jones dropped 0.12% to 30,665, the S&P500 retreated 0.01% to 3,855 and the tech-benchmark Nasdaq Composite advanced 0.80% to 11,511.
If the Dow Jones breaches the September low at 30,409 (September 20) it could expose a deeper decline to, initially, the July low at 30,143 (July 14) prior to the 2022 low at 29,653 (June 17). On the upside, the September high at 32,504 (September 12) emerges as the initial hurdle for bulls ahead of a Fibo level (of the July-August rally) at 32,700 and the 33,364 level (August 26). The breakout of this zone could put a test of the key 200-day SMA at 33,431 back on the investors’ radar seconded by the August peak at 34,281 (August 16). Further up comes the April high at 35,492 (April 21) before the February top at 35,824 (February 9). The daily RSI loses momentum and drops to 35.
Top Performers: Walmart, Boeing, Goldman Sachs
Worst Performers: Verizon, Visa A, Travelers
Resistance levels: 31,277 32,040 32,504 (4H chart)
Support levels: 30,409 30,143 29,653 (4H chart)
-637993862179012219.png)
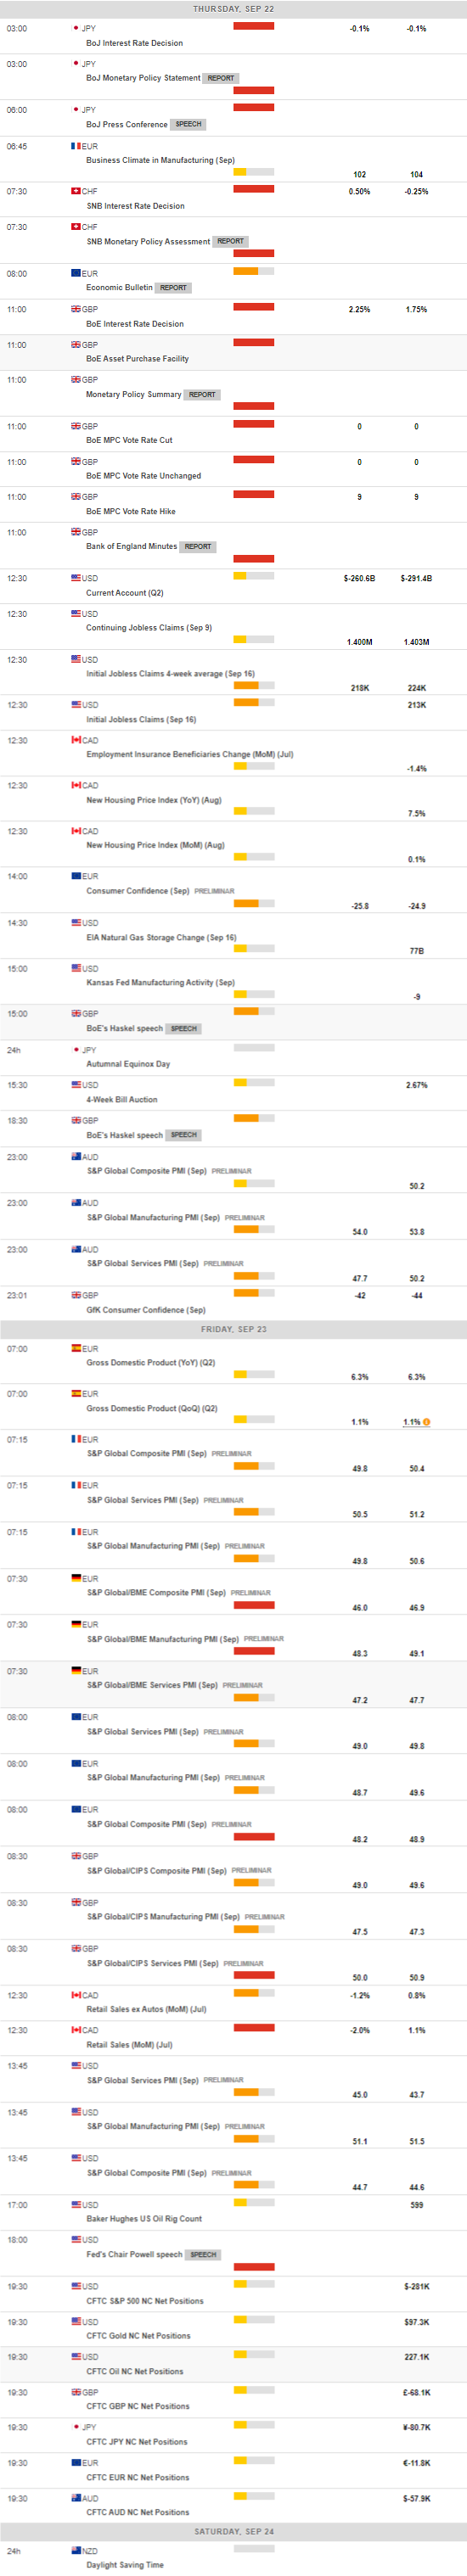
MACROECONOMIC EVENTS
All Information & Updates provided by:

All information relating to the financial markets available on this page has been prepared and issued by FXStreet (Forexstreet SL, Spain, Reg: B62498233) on the basis of publicly available information and all information believed to be reliable and does not conflict with Kuwaiti local laws, and all necessary care has been taken to before the company to ensure that the facts mentioned are correct from the source.
NCM Investment nor any of its directors or employees shall in any way be held responsible for the contents of this news, and the information contained on this page is intended only to provide clients with publicly available information and should not be construed as investment advice, report or analysis and/or constitute an offer or invitation to buy or sell financial instruments of any kind.
RISK WARNING: Forex and CFDs are highly risky leveraged products, as losses can exceed deposits. Please ensure you understand all the risks and take independent advice if necessary. NCM will segregate the clients based on the criteria of the regulator and its bylaws. NCM does not provide any advisory service; the material published does not constitute advice or a recommendation for a transaction in any financial instrument. NCM accepts no responsibility for any use of the content presented and any consequences of that use. Anyone acting on the information provided does so at their own risk.