
- Contact Us:
-

-

-

-


Daily Market Updates
23 Sep 2022
EURUSD
EUR/USD reversed two consecutive daily drops and charted mmodest gains on the back of the sudden shift in the sentiment surrounding the greenback.
Indeed, and after hitting fresh nearly 20-year lows in the boundaries of the 0.9800 mark, the pair managed to regain composure helped by bargain hunters and the renewed offered stance in the buck.
Still around the dollar, the USD Index (DXY) climbed to new cycle highs around 111.80 early in the European session, as market participants were adjusting to Wednesday’s rate hike by the Federal Reserve. Some profit taking mood in combination with the FX intervention in the Japanese yen later forced the dollar to give away part of those gains.
In the US debt markets, the rout in bonds accelerated and morphed into extra upside in US yields, which in turn managed to clinch fresh multi-year highs across the curve.
Data wise in Euroland, flash figures from the European Commission saw the Consumer Confidence worsening to -28.8 for the current month.
In the US data space, Initial Claims rose by 213K in the week to September 17 and the CB Leading Index contracted at a monthly 0.3% in August.
If sellers push harder, then EUR/USD could break below the 2022 low at 0.9806 (September 22) and put another visit to the October 2002 low at 0.9685 (October 21) back on the traders’ radar. On the contrary, the next up barrier awaits at the weekly top at 1.0050 (September 20) prior to the 55-day SMA at 1.0085 and the 7-month resistance line around 1.0135. Beyond this region, the pair’s downside pressure is expected to mitigate and allow for a probable move to the September peak at 1.0197 (September 12) ahead of the 100-day SMA at 1.0290 and the August high at 1.0368 (August 10). The daily RSI bounced to the area above 38.
Resistance levels: 0.9907 0.9968 1.0050 (4H chart)
Support levels: 0.9806 0.9685 0.9608 (4H chart)
-637994667175469420.png)
USDJPY
USD/JPY clinched new highs in levels just shy of the 146.00 mark on Thursday.
The move higher in spot, however, motivated the Japanese government and the BoJ to intervene in the FX markets to buy the yen for the first time since 1998, and eventually dragged spot back to the 140.00 region, where it met some upside bias (once again).
Following the FX intervention MoF Kanda said that the decision does not target a certain level of the exchange rate and stressed that there are no plans to shift to a fixed-rate market.
In the meantime, the Japanese yen posted no reaction to another uneventful BoJ gathering where the central bank kept the ultra-accommodative monetary stance unchanged as well as the policy rate at -0.10%.
Immediately to the upside in USD/JPY now comes the 2022 high at 145.90 (September 7) ahead of August 1998 top at 147.67 (August 11 1998) and the August 1990 peak at 151.65. In the opposite direction, the weekly low at 140.34 (September 22) should initially hold the downside prior to the 55-day SMA at 137.94 and the weekly low at 135.80 (August 23). South from here aligns the interim 100-day SMA at 135.29 before the weekly low at 131.73 (August 11) and the August low at 130.39 (August 2). A drop below the latter should put a test of the psychological 130.00 mark back to the investors’ radar. The daily RSI broke below the 55 level.
Resistance levels: 145.90 146.97 147.67 (4H chart)
Support levels: 140.34 139.06 138.05 (4H chart)
-637994667995946960.png)
GBPUSD
GBP/USD bounced off new cycle lows in the proximity of the 1.1200 yardstick on Thursday against the backdrop of the renewed offered stance in the greenback. The bull run, however, and as usual around the sterling, died off towards the end of the session.
On the dollar, the USD Index (DXY) came under pressure soon after printing new cycle highs near 112.00 earlier in the session. The corrective move in the buck came in response to some profit taking and following the BoJ intervention to buy the yen.
The British pound remained largely apathetic after the BoE voted 5-4 to raise the policy rate by 50 bps to 2.25%, as broadly anticipated. While MPC members Haskel, Mann and Ramsden leant to a 75 bps rate hike, his colleague Dhingra voted for a 25 bps move. The central bank suggested that inflation could climb to just below 11% in the next month (vs. 13.3% forecast in August), while it sees the economy falling into technical recession in Q3 (-0.1% QoQ exp.).
Despite the daily bounce, GBP/USD remains under pressure and probe to extra losses in the short term. That said, the breach of the 2022 low at 1.1211 (September 22) is expected to meet the next contention of relevance not until the weekly low at 1.1060 (March 1985). On the flip side, the weekly high at 1.1460 (September 20) offers initial hurdle prior to the September top at 1.1738 (September 13), which is followed by the 55-day SMA at 1.1834 and the weekly peak at 1.1900 (August 26). North from here comes the round level at 1.2000 ahead of the 100-day SMA at 1.2058 and followed by the August high at 1.2293 (August 1). The daily RSI rebounded from the oversold territory and surpassed 32.
Resistance levels: 1.1460 1.1589 1.1738 (4H chart)
Support levels: 1.1211 1.1060 1.0805 (4H chart)
-637994667548494738.png)
AUDUSD
AUD/USD successfully reversed the earlier slump to new lows in the 0.6570 region and later reclaimed the area beyond 0.6600 the figure on Thursday.
Indeed, the initial sharp uptick in the dollar put the risk complex under heavy pressure at the beginning of Thursday’s session, although that move quickly changed direction as the profit taking mood took over the dollar, while the joint FX intervention by the BoJ and the Japanese government added to the selling pressure in the buck.
The recovery in the commodity universe also accompanied the rebound in the Aussie dollar, as copper prices reversed three daily pullbacks in a row and the iron ore advanced modestly although still below the $100.00 mark per tonne.
No data releases Down Under on Thursday left the attention to Friday’s publication of preliminary figures for Manufacturing/Services PMI.
The resumption of the selling pressure in AUD/USD now faces the next support at the 2022 low at 0.6573 (September 22) ahead of the May 2020 low at 0.6372 (May 4) and the weekly low at 0.6253 (April 21 2020). Inversely, there are minor hurdles at 0.6747 (September 20) and 0.6770 (September 15) ahead of the September high at 0.6916 (September 13). Beyond the latter is expected to emerge the 100-day SMA at 0.6930 just before the psychological 0.7000 mark. Once cleared, the next up barrier aligns at the weekly top at 0.7008 (August 26) seconded by the 200-day SMA at 0.7094 and the August top at 0.7136 (August 11). The daily RSI gathered some pace and approached 37.
Resistance levels: 0.6705 0.6747 0.6770 (4H chart)
Support levels: 0.6573 0.6567 0.6505 (4H chart)
-637994668492161312.png)
GOLD
Gold charted an indecisive session on Thursday on the back of the increased volatility around the greenback, while the unabated rally in US yields kept serious bullish attempts in the yellow metal on check.
Speaking about the greenback, the USD Index (DXY) clinched fresh 20-year tops just below the 112.00 yardstick during early trade, although that intense move fizzled out following the opening bell in the old continent.
Indeed, US yields navigate the area of multi-year tops across the curve, having particularly gathered extra pace following the interest rate hike by the Federal Reserve on Wednesday as well as the perspective for a more restrictive policy in the upcoming months.
While gold seems to have entered a consolidative phase, the 2022 low at $1,653 (September 21) remains an initial contention prior to the $1,641 level (April 8 2020) and ahead of the April 2020 low at $1,572 (April 1). On the other hand, bulls remain focused on the September top at $1,735 (September 12), while the 55-day SMA also propped up this region. Further up turns up the $1,765 level (August 25) followed by the 100-day SMA at $1,777. Once the precious metal leaves this area behind, it could challenge the August high at $1,807 (August 10) prior to the key 200-day SMA at $1,829.
Resistance levels: $1,688 $1,707 $1,735 (4H chart)
Support levels: $1,653 $1,641 $1,572 (4H chart)
-637994668876604815.png)
CRUDE WTI
Escalating concerns around the war in Ukraine reignited supply fears and bolstered a humble advance in prices of the WTI, which halted a 3-session negative streak on Thursday.
Extra wings for the commodity, in addition, came from news citing a pick-up in crude oil demand in China, while exports from the OPEC appeared to have settled somewhat.
Traders, in the meantime, remained wary of developments from EU plans to cap Russian oil prices and the implementation of further sanctions.
Next on the downside for WTI appears the weekly low at $82.11 (September 19) which is closely followed by the September low at $81.21 (September 8). The breach of the latter could open the door to another visit to the key round level at $80.00 prior to the 2022 low at $74.30 (January 3). Conversely, bulls should look to retest the weekly peak at $90.17 (September 14) just before the September high at $90.37 (September 5) and the 200-day SMA at $97.33. Further recovery could see the weekly top at $97.65 (August 30) revisited ahead of the psychological $100.00 hurdle.
Resistance levels: $85.98 $86.66 $89.04 (4H chart)
Support levels: $82.39 $81.18 $77.82 (4H chart)
-637994669760228921.png)
DOW JONES
US equities added to Wednesday’s losses and extended the weekly corrective downside on the back of omnipresent concerns surrounding a potential hard landing of the US economy and the rising perception that a recession is in the offing.
Indeed, all those fears did nothing but intensify on Thursday following another 75 bps rate hike by the Fed at its meeting on the previous day and the growing feeling that the tightening stance could last longer than estimated.
Against that, the Dow Jones retreated 0.16% to 30,130, the S&P500 lost 0.65% to 3,765 and the tech-heavy Nasdaq Composite dropped 1.36% to 11,068.
The breakout of the September low at 29,994 (September 22) could leave the Dow Jones vulnerable to a deeper retracement to the 2022 low at 29,653 (June 17). On the flip side, there are no resistance levels of relevance until the September peak at 32,504 (September 12) before a Fibo level (of the July-August rally) at 32,700 and the 33,364 level (August 26). The latter now appears reinforced by the key 200-day SMA at 33,402 ahead of the August high at 34,281 (August 16). Up from here, the index could confront the April top at 35,492 (April 21) prior to the February peak at 35,824 (February 9). The daily RSI flirted with the oversold territory near 31.
Top Performers: Merck&Co, J&J, Verizon
Worst Performers: American Express, Boeing, Goldman Sachs
Resistance levels: 31,020 31,975 32,504 (4H chart)
Support levels: 30,226 30,143 29,653 (4H chart)
-637994670240116557.png)
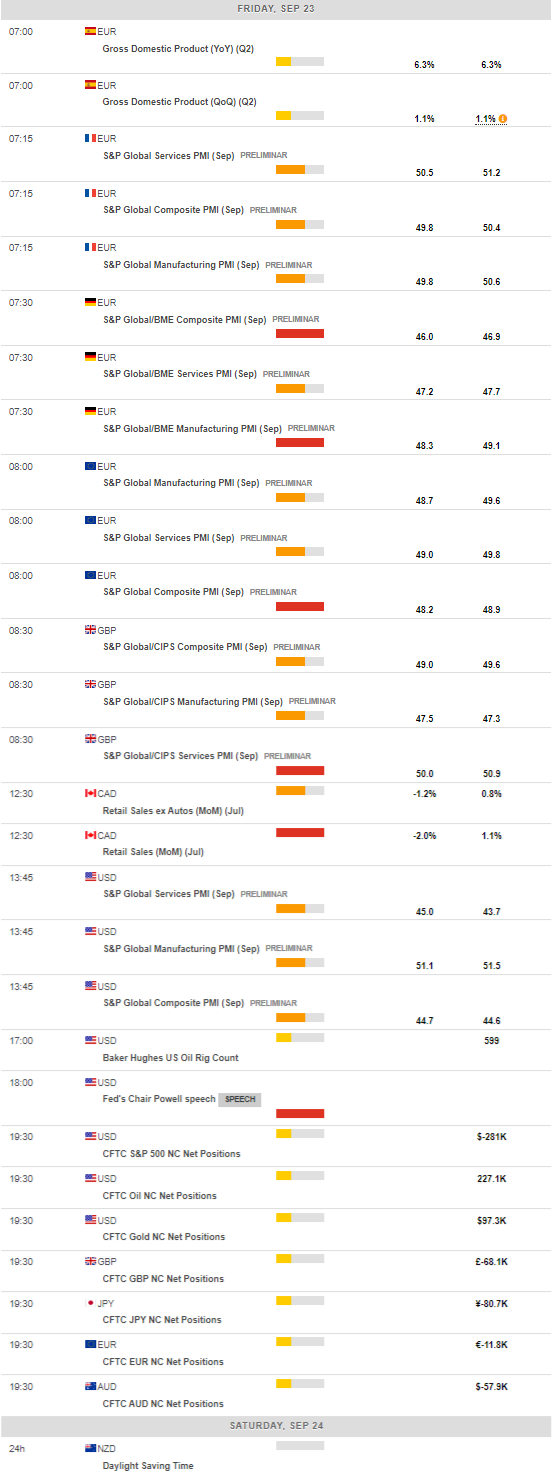
MACROECONOMIC EVENTS
All Information & Updates provided by:

All information relating to the financial markets available on this page has been prepared and issued by FXStreet (Forexstreet SL, Spain, Reg: B62498233) on the basis of publicly available information and all information believed to be reliable and does not conflict with Kuwaiti local laws, and all necessary care has been taken to before the company to ensure that the facts mentioned are correct from the source.
NCM Investment nor any of its directors or employees shall in any way be held responsible for the contents of this news, and the information contained on this page is intended only to provide clients with publicly available information and should not be construed as investment advice, report or analysis and/or constitute an offer or invitation to buy or sell financial instruments of any kind.
RISK WARNING: Forex and CFDs are highly risky leveraged products, as losses can exceed deposits. Please ensure you understand all the risks and take independent advice if necessary. NCM will segregate the clients based on the criteria of the regulator and its bylaws. NCM does not provide any advisory service; the material published does not constitute advice or a recommendation for a transaction in any financial instrument. NCM accepts no responsibility for any use of the content presented and any consequences of that use. Anyone acting on the information provided does so at their own risk.