
- Contact Us:
-

-

-

-


Daily Market Updates
26 Sep 2022
EURUSD
It was all about the dollar once again on Friday.
Indeed, the USD Index (DXY) climbed to levels last seen back in May 2002 beyond 113.00, while EUR/USD accentuated the decline to more than 20-year lows in the 0.9670 region. The move in the pair was widely mimicked by the rest of the risk-associated universe.
The intense move higher in the dollar has been exacerbated after the FOMC event on Wednesday, when the Fed raised rates by 75 bps and Chief Powell’s press conference fell in line with the hawkish tone already seen at the Jackson Hole Symposium, that is: The Federal Reserve will keep hiking rates until it sees compelling evidence that inflation is moving down.
The acute upside in the greenback was also underpinned by another cycle highs in US yields across the curve, although the 10-year/30-year segment eventually ended the session with humble losses.
In the domestic calendar, preliminary figures saw the Manufacturing PMI in Germany and the Euroland at 48.3 and 48.5, respectively, for the current month, and 45.4 and 48.9 when it came to the Services PMI.
It was also PMI-day across the pond, and advanced readings expect the Manufacturing and Services gauges to improve to 51.8 and 49.2, respectively.
If sellers push harder, then EUR/USD could break below the 2022 low at 0.9667 (September 22) and put another visit to the September 2002 low at 0.9608 (September 17) back on the traders’ radar. On the contrary, the next up barrier awaits at the weekly top at 1.0050 (September 20) prior to the 55-day SMA at 1.0075 and the 7-month resistance line around 1.0125. Beyond this region, the pair’s downside pressure is expected to mitigate and allow for a probable move to the September peak at 1.0197 (September 12) ahead of the 100-day SMA at 1.0281 and the August high at 1.0368 (August 10). The daily RSI dipped to the oversold zone and approached 28.
Resistance levels: 0.9907 0.9968 1.0030 (4H chart)
Support levels: 0.9667 0.96.08 0.8995 (4H chart)
-637997278028694701.png)
USDJPY
USD/JPY managed to leave behind part of Thursday’s intervention-induced loses and rebounded to the area past 143.00 at the end of the week. This week’s move by the Japanese government and the BoJ, however, did not prevent the yen from clinching its sixth consecutive week with losses vs. the dollar.
The decent recovery in the pair came in response to the abrupt uptick in the greenback, which pushed the USD Index (DXY) to the 113.00 region for the first time since late May 2002.
Further gains in spot followed another positive session in US yields in the short end of the curve, while corrective pullbacks in the belly and the long end somewhat limited the upside potential on Friday.
Looking at the big picture, the Fed-BoJ wider divergence in monetary policy are poised to keep dictating the price action in the pair, although further bouts of volatility should not be rule out since FX intervention is now on the table.
The were no data releases scheduled in the Japanese calendar on Friday.
USD/JPY remains focused on the 2022 top at 145.90 (September 7). The surpass of this level exposes the August 1998 peak at 147.67 (August 11 1998) followed by the August 1990) high at 151.65. On the flip side, the post-intervention low at 140.34 (September 22) emerges as the initial contention before the 55-day SMA at 138.08 and the weekly low at 135.80 (August 23). The breakdown of the latter should open the door to the temporary 100-day SMA at 135.42 ahead of the weekly low at 131.73 (August 11) and the August low at 130.39 (August 2). The daily RSI regained some balance and bounced above 60.
Resistance levels: 143.46 145.90 146.97 (4H chart)
Support levels: 141.76 140.34 139.06 (4H chart)
-637997278696256539.png)
GBPUSD
Another forgettable session for the sterling.
Indeed, the British pound collapsed and depreciated to fresh 37-year lows vs. the dollar, taking GBP/USD to low-1.0800s in a context utterly dominated by the unabated demand for the greenback.
In fact, other than the generalized preference for the dollar, the continuously deteriorating outlook for the UK economy also played its part on Friday, while Chancellor Kwarteng’s mini-budget announcement of massive debt-financed tax cuts collaborated with the sour sentiment around the quid. On the latter, the UK 10-year Gilt yields climbed to more than 11-year peaks near 3,85%.
In the UK, flash Manufacturing and Services PMIs are seen at 48.5 and 49.2, respectively, for the month of September. Adding to the sour sentiment surrounding the quid, the Gfk Consumer Confidence worsened to -49 for the current month (from -44).
No matter how deep into the oversold territory is in, GBP/USD risks further losses in the short-term. The breach of the 2022 low at 1.0834 (September 23) could expose a deeper pullback to weekly lows at 1.0805 (March 14 1985) and 1.0640 (March 8 1985). In case of occasional bullish attempts, there is a minor initial hurdle at the weekly top at 1.1460 (September 20) ahead of the September peak at 1.1738 (September 13). North from here turns up the 55-day SMA at 1.1813 seconded by the weekly high at 1.1900 (August 26). A surpass of the round level at 1.2000 ahead should put the 100-day SMA at 1.2043 back on the radar before the August top at 1.2293 (August 1). The daily RSI deepens into the oversold territory below 19.
Resistance levels: 1.1364 1.1460 1.1589 (4H chart)
Support levels: 1.0834 1.0805 1.0640 (4H chart)
-637997278372700320.png)
AUDUSD
AUD/USD extended the deep leg lower and revisited the vicinity of the 0.6500 neighbourhood on Friday, an area last traded back in May 2020.
Indeed, the Aussie dollar succumbed to the extreme upside pressure in the greenback and shed further ground along with the rest of the risky peers and the commodity universe.
On the latter, copper prices tumbled to levels last seen in late July and the iron ore looked indecisive near the $98.00 mark per tonne.
In Oz, preliminary readings saw the Manufacturing PMI improving a tad to 53.9 in September (from 53.8) and the Services PMI following suit, up to 50.4 (from 50.2).
The continuation of the downside bias in AUD/USD should initially challenge the 2022 low at 0.6511 (September 23). If cleared, then the pair could attempt to visit the May 2020 low at 0.6372 (May 4) followed by the weekly low at 0.6253 (April 21 2020). On the other hand, minor resistance levels are at 0.6747 (September 20) and 0.6770 (September 15) ahead of the September top at 0.6916 (September 13). The surpass of this level could open the door to the 100-day SMA at 0.6924 prior to the psychological 0.7000 mark and just before the weekly pek at 0.7008 (August 26). The daily RSI poked with the oversold territory at 30.
Resistance levels: 0.6705 0.6747 0.6770 (4H chart)
Support levels: 0.6511 0.6505 0.6402 (4H chart)
-637997279004492111.png)
GOLD
Prices of the ounce troy of gold added to Thursday’s pullback and tumbled to an area last seen in April 2020 near $1,640 at the end of the week.
Same as in these past weeks, Friday was no exception and saw the increased demand for the greenback put the yellow metal under extra downside pressure amidst usual market chatter surrounding the Fed’s aggressive plans to bring down inflation.
The late pullback in US yields in the 10-year and 30-year notes appear, however, to have limited the downside in the precious metal somewhat.
A deeper retracement in bullion now targets the round level at $1,600, while the break below it should put a potential visit to the April 2020 low at $1,572 (April 1) back on the radar. Inversely, the weekly top at $1,688 (September 21) emerges as the initial hurdle for bulls ahead of the the September peak at $1,735 (September 12). This level remains bolstered by the proximity of the 55-day SMA, while north from this zone awaits the $1,765 level (August 25) seconded by the 100-day SMA at $1,775 and the August high at $1,807 (August 10).
Resistance levels: $1,688 $1,707 $1,735 (4H chart)
Support levels: $1,639 $1,606 $1,572 (4H chart)
-637997279305756409.png)
CRUDE WTI
Prices of the American reference for the sweet light crude oil tumbled more than 5% to clinch fresh 8-month lows in the sub-$80.00 region on Friday.
Indeed, the relentless move higher in the dollar – which reached the highest level in more than 20 years when tracked by the USD Index – coupled with magnified recession concerns – all derived after major central banks embarked on quite an aggressive tightening cycle – kept buyers well at bay and sponsored the free-fall in prices.
Closing the weekly calendar, driller Baker Hughes reported that US oil rig count increased by 3 in the week to September 23, taking the total US oil active rigs to 602.
Further south for the WTI now emerges the 2022 low at $74.30 (January 3) ahead of the weekly low at $66.15 (December 20 2021) and the December 2021 low at $62.46 (December 2). On the upside, the weekly peak at $86.66 (September 21) comes first before another weekly high at $90.17 (September 14), which turns up just ahead of the September top at $90.37 (September 5). Further gains could prompt the 200-day SMA at $97.37 to re-emerge on the horizon prior to the weekly peak at $97.65 (August 30) and the psychological $100.00 mark.
Resistance levels: $85.98 $86.66 $88.56 (4H chart)
Support levels: $78.03 $77.82 $74.26 (4H chart)
-637997279908346378.png)
DOW JONES
The fierce rally in the dollar and increasing distress among investors regarding the likelihood of a US (and global) economic slowdown kept US equities under heightened downside pressure and dragged the Dow Jones to levels last seen in October 2020 around the 29,200 points at the end of the week.
Recession fears also morphed into further weakness in the US debt market, which saw yields in the short end of the curve extend the rally vs. some modest losses in the belly and the long end, all following Wednesday’s FOMC event, where Chief Powell hinted at a tighter-for-longer stance from the Fed.
That said, the Dow Jones retreated 1.62% to 29,590, the S&P500 dropped 1.72% to 3,693 and the tech-heavy Nasdaq Composite lost 1.80% to 10,867.
The Dow Jones clinched the fourth consecutive session with losses on Friday and a breakdown of the now 2022 low at 29,250 could pave the way for a potential test of the weekly low at 28,902 (November 12 2020) ahead of the October 2020 low at 26,143 (October 30). Next on the upside for the index appears the weekly peak at 31,026 (September 19) seconded by the September high at 32,504 (September 12) and the 33,364 level (August 26), which remains propped up by the key 200-day SMA at 33,371. North from here emerges the August top at 34,281 (August 16) followed by the April peak at 35,492 (April 21). The daily RSI flirted sank in the oversold territory near 27.
Top Performers: Home Depot, J&J, Amgen
Worst Performers: Chevron, Boeing, Caterpillar
Resistance levels: 31,026 31,941 32,504 (4H chart)
Support levels: 29,250 28,902 26,143 (4H chart)
-637997280203850918.png)
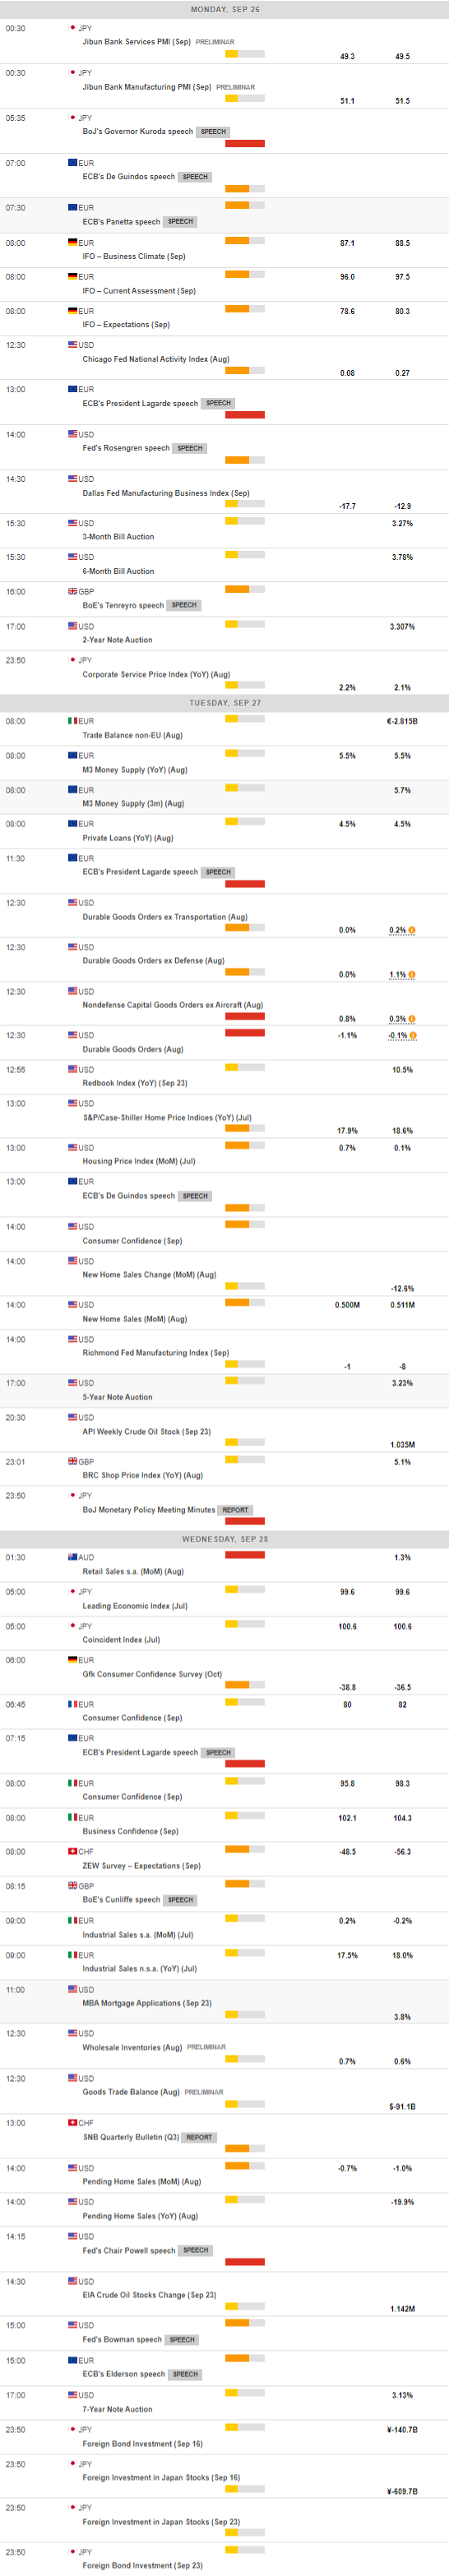
MACROECONOMIC EVENTS
All Information & Updates provided by:

All information relating to the financial markets available on this page has been prepared and issued by FXStreet (Forexstreet SL, Spain, Reg: B62498233) on the basis of publicly available information and all information believed to be reliable and does not conflict with Kuwaiti local laws, and all necessary care has been taken to before the company to ensure that the facts mentioned are correct from the source.
NCM Investment nor any of its directors or employees shall in any way be held responsible for the contents of this news, and the information contained on this page is intended only to provide clients with publicly available information and should not be construed as investment advice, report or analysis and/or constitute an offer or invitation to buy or sell financial instruments of any kind.
RISK WARNING: Forex and CFDs are highly risky leveraged products, as losses can exceed deposits. Please ensure you understand all the risks and take independent advice if necessary. NCM will segregate the clients based on the criteria of the regulator and its bylaws. NCM does not provide any advisory service; the material published does not constitute advice or a recommendation for a transaction in any financial instrument. NCM accepts no responsibility for any use of the content presented and any consequences of that use. Anyone acting on the information provided does so at their own risk.