
- Contact Us:
-

-

-

-


Daily Market Updates
27 Sep 2022
EURUSD
Quite a volatile start of the week for the European currency.
Indeed, EUR/USD dropped to fresh lows in the 0.9550 region during early trade, an area last seen more than 20 years ago (June 2002), always on the back of the abrupt move higher in the greenback, which in turn rose to new cycle highs well north of the 114.00 barrier when measured by the USD Index (DXY).
However, the strength around the buck lost some momentum following the closing bell in Asia and eventually sponsored the pair’s marked albeit brief rebound just above the 0.9700 hurdle.
The bearish session in the pair came in tandem with another strong performance of yields in the US debt market, while the German 10-year bund yields climbed to new highs near 2.15%.
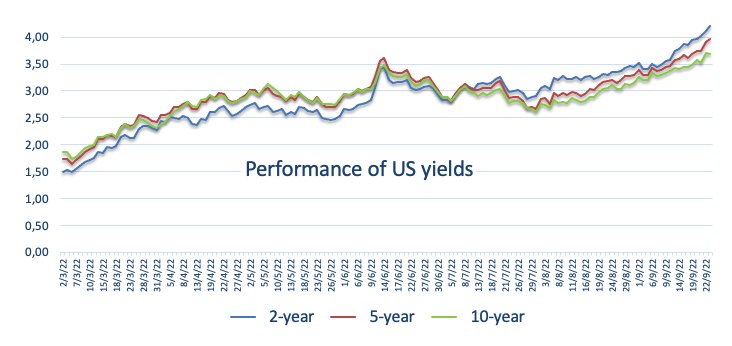
In the meantime, the dollar is expected to remain propped up by the investors’ adjustment to the latest FOMC move on rates as well as the hawkish tone from Fed’s rate-setters.
Chair Lagarde was on the wires in the European afternoon, although the lack of any surprise in her speech kept the skepticism among investors well in place. Lagarde reiterated the data-dependent stance from the ECB when it comes to policy decisions and stressed that risks to the inflation outlook remain tilted to the upside. She also anticipated raising rates further over the next sessions.
In the euro docket, the German Business Climate tracked by the IFO institute worsened to 84.3 for the current month (from 88.6).
In the US data space, the Chicago Fed National Activity Index deflated to 0 in August (from 0.27), in what was the sole release across the Atlantic.
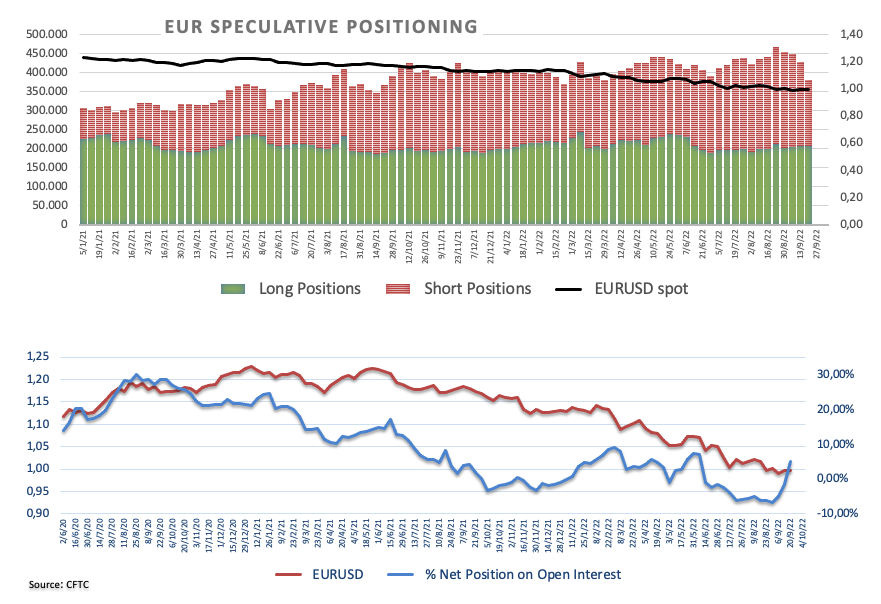
Of note from the latest CFTC Positioning Report is that speculators were net longs in the EUR for the first time since early June in the week ended on September 20.
EUR/USD remains under heavy pressure and the breach of the 2022 low at 0.9552 (September 26) could pave the way for a test of the round level at 0.9500 ahead of the weekly low at 0.9411 (June 17 2002). On the other hand, the weekly peak at 1.0050 (September 20) still emerges as the initial resistance closely followed by the 55-day SMA at 1.0067 and the 7-month resistance line in the 1.0110/5 band. The pair is expected to see its downside bias alleviate above the latter and could then attempt a test of the September high at 1.0197 (September 12) prior to the 100-day SMA at 1.0272 and the August top at 1.0368 (August 10). The daily RSI remained in the oversold territory near 26.
Resistance levels: 0.9701 0.9774 0.9907 (4H chart)
Support levels: 0.9552 0.9411 0.9337 (4H chart)
-637998134059340680.png)
USDJPY
USD/JPY advanced for the second straight session and returned to the area above 144.00 the figure helped by the continuation of the buying interest around the greenback, while another day of decent gains in US yields also collaborated with the upside.
Bulls thus regained the upper hand and motivated the spot to trade at shouting distance from recent peaks near the 145.00 neighbourhood, which it is worth recalling, triggered a BoJ-MoF joint FX intervention last week.
Speaking about the latter, BoJ Governor H.Kuroda deemed last week’s move as appropriate, adding that intervention and the current ultra-loose monetary conditions are complementary (well…).
In Japan, preliminary results showed the Jibun Bank Manufacturing PMI at 51.0 and 51.9 when it came to the Services gauge, both for the month of September.
Further gains in USD/JPY keep targeting the 2022 peak at 145.90 (September 7) prior to the August 1998 high at 147.67 (August 11 1998) and the August 1990 top at 151.65. On the contrary, immediate contention comes at the post-intervention low at 140.34 (September 22) ahead of the 55-day SMA at 138.2 and prior to the weekly low at 135.80 (August 23). The loss of this level could pave the way for a test of the temporary 100-day SMA at 135.57 before the weekly low at 131.73 (August 11) and the August low at 130.39 (August 2). The daily RSI regained some balance and bounced near 65.
Resistance levels: 144.73 145.90 146.97 (4H chart)
Support levels: 141.76 140.34 139.06 (4H chart)
-637998135427404684.png)
GBPUSD
The weakness around the sterling did nothing but accelerate at the beginning of the week, forcing GBP/USD to drop to an all-time low at 1.0356.
Indeed, the abrupt move higher in the US dollar in combination with omnipresent concerns surrounding the UK economic outlook kept the bearish bias unchanged around the quid, while comments from Chancellor Kwarteng over the weekend that “more is coming” when it comes to tax cuts hurt further the sentiment and underpinned the sterling’s drop to record lows vs. the buck.
The UK calendar will be empty until Friday’s release of the final figures of the Q2 GDP Growth Rate, although several MPC members are expected to speak throughout the week.
Considering the recent price action, GBP/USD faces the next support of note at the all-time low at 1.0356 (September 26). On the flip side, the weekly peak at 1.1460 (September 20) should emerge as the initial up barrier prior to the September high at 1.1738 (September 13). A move further north faces the 55-day SMA at 1.1789 ahead of the weekly top at 1.1900 (August 26). North from here emerges the round level at 1.2000 before the 100-day SMA at 1.2026 and the August peak at 1.2293 (August 1). The daily RSI dropped further into the oversold territory and breached 15.
Resistance levels: 1.0930 1.1364 1.1460 (4H chart)
Support levels: 1.0356 (4H chart)
-637998135104416237.png)
AUDUSD
AUD/USD returned to an area last traded back in May 2020 well in the sub-0.6500 region, inaugurating at the same time the third consecutive week with losses.
As per usual, another positive day in the greenback put the risk-linked galaxy and USD-denominated assets under extra pressure, forcing the Aussie dollar to accelerate losses and break below the 0.6500 key support.
In addition, further decline in copper prices and the apathetic mood in the iron ore added to the persevering weakness around AUD.
Monday's empty docket Down Under left the attention on Wednesday’s release of flash Retail Sales for the month of august.
If AUD/USD breaches the 2022 low at 0.6437 (September 26) it could motivate sellers to drag the pair to the May 2020 low at 0.6372 (May 4) prior to the weekly low at 0.6253 (April 21 2020). Immediately to the upside appear minor resistance levels at 0.6747 (September 20) and 0.6770 (September 15) before the September peak at 0.6916 (September 13). The temporary 100-day SMA at 0.6919 should come next ahead of the psychological 0.7000 mark, which just precedes the weekly high at 0.7008 (August 26). The daily RSI retreated further and remained in the oversold territory near 26.
Resistance levels: 0.6532 0.6670 0.6705 (4H chart)
Support levels: 0.6437 0.6402 0.6378 (4H chart)
-637998135743456126.png)
GOLD
Gold prices extended their leg lower and revisited the region last traded in early April 2020 near the $1,620 level per ounce troy on Monday.
The sustained upside momentum in the greenback and US yields kept weighing on the precious metals and motivated bullion to start its third consecutive week in the negative territory.
Moving forward, the macro scenario looks unaltered for the yellow metal, as its price action largely hinges on the prospects for extra tightening by the Federal Reserve in a context where inflation pressures have so far given no signs of losing traction.
If sellers remain in control, gold could dispute the round level at $1,600 sooner rather than later ahead of the April 2020 low at $1,572 (April 1). In the opposite direction, there is an initial hurdle at the weekly peak at $1,688 (September 21) before the September high at $1,735 (September 12). The vicinity of the 55-day SMA still underpins this resistance zone ahead of the $1,765 level (August 25) and the 100-day SMA at $1,772. North from here turns up the August top at $1,807 (August 10).
Resistance levels: $1,649 $1,688 $1,707 (4H chart)
Support levels: $1,625 $1,606 $1,572 (4H chart)
-637998136050992914.png)
CRUDE WTI
Prices of the West Texas Intermediate (WTI) retreated further and broke below the $77.00 mark per barrel on Monday, trading at shouting distance from the so far 2022 low at $74.26 (January 3).
Once again, recession concerns on the back of the persevering tightening plans by major central banks in economies across the world and the negative impact on the demand for crude oil hurt the sentiment among traders and forced the WTI to add to Friday’s decline and shed around 8% in the last couple of sessions.
The stronger greenback – which hit fresh cycle highs vs. a bundle of its main rival currencies – also played its part and depressed oil prices as well as the rest of the USD-labeled assets.
As always, the API and the EIA will report on the US crude oil supplies for the week ended on September 23.
Extra losses in WTI are now expected to target the 2022 low at $74.30 (January 3) prior to the weekly low at $66.15 (December 20 2021) and the December 2021 low at $62.46 (December 2). On the other hand, there is a minor up-barrier at the weekly high at $86.66 (September 21) ahead of another weekly top at $90.17 (September 14) and the September peak at $90.37 (September 5). North from here comes the 200-day SMA at $97.39 before the weekly high at $97.65 (August 30) and the psychological $100.00 mark.
Resistance levels: $80.29 $85.98 $86.66 (4H chart)
Support levels: $76.52 $74.26 $72.55 (4H chart)
-637998136691518233.png)
DOW JONES
Tireless concerns around the likelihood of a US recession (amidst a global slowdown) continued to weigh on equities at the beginning of the week, motivating the three main US stock indices to extend losses to levels last traded in October/November 2020.
Also adding to the already sour mood among market participants, the greenback extended the rally for yet another session to more than 20-year highs, while the broad-based upside in US yields kept navigating multi-year peaks.
All in all, the Dow Jones dropped 1.01% to 29,296, the S&P500 shed 0.87% to 3,661 and the tech-benchmark Nasdaq Composite retreated 0.43% to 10,820.
Another session in the red for the Dow Jones leaves the index vulnerable to a potential drop to the now 2022 low at 29,161 (September 26) ahead of the weekly low at 28,902 (November 12 2020) and the October 2020 low at 26,143 (October 30). Contrarily, occasional bullish attempts should meet the next hurdle at the weekly high at 31,026 (September 19) ahead of the September top at 32,504 (September 12) and the 33,364 level (August 26). The latter still looks bolstered by the proximity of the key 200-day SMA. The breakout of this level exposes the August peak at 34,281 (August 16) before the April high at 35,492 (April 21). The daily RSI sank to the oversold territory near 25.
Top Performers: Walmart, Apple, Microsoft
Worst Performers: Travelers, Boeing, Goldman Sachs
Resistance levels: 31,026 31,941 32,504 (4H chart)
Support levels: 29,161 28,902 26,143 (4H chart)
-637998137103335330.png)
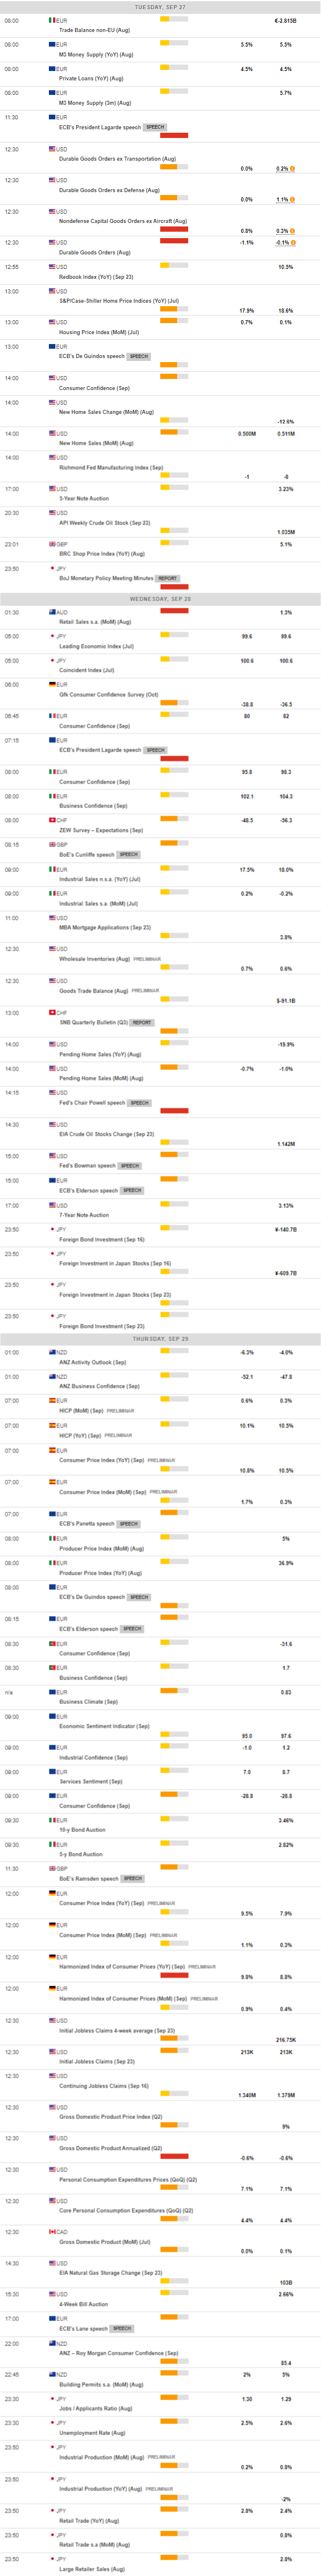
MACROECONOMIC EVENTS
All Information & Updates provided by:

All information relating to the financial markets available on this page has been prepared and issued by FXStreet (Forexstreet SL, Spain, Reg: B62498233) on the basis of publicly available information and all information believed to be reliable and does not conflict with Kuwaiti local laws, and all necessary care has been taken to before the company to ensure that the facts mentioned are correct from the source.
NCM Investment nor any of its directors or employees shall in any way be held responsible for the contents of this news, and the information contained on this page is intended only to provide clients with publicly available information and should not be construed as investment advice, report or analysis and/or constitute an offer or invitation to buy or sell financial instruments of any kind.
RISK WARNING: Forex and CFDs are highly risky leveraged products, as losses can exceed deposits. Please ensure you understand all the risks and take independent advice if necessary. NCM will segregate the clients based on the criteria of the regulator and its bylaws. NCM does not provide any advisory service; the material published does not constitute advice or a recommendation for a transaction in any financial instrument. NCM accepts no responsibility for any use of the content presented and any consequences of that use. Anyone acting on the information provided does so at their own risk.