
- Contact Us:
-

-

-

-


Daily Market Updates
30 Sep 2022
EURUSD
Increasing weakness in the dollar lent extra legs to EUR/USD and propelled spot to fresh peaks in levels just shy of the 0.99800 hurdle on Thursday.
However, while the strong retracement in the greenback could follow technical reasons due to extreme overbought conditions of the USD Index (DXY), its underlying bullish bias remains unchanged and always underpinned by investors’ adjustment to the Fed’s aggressive tightening stance.
Back to the ECB, Board members Müller and Simkus leant towards a 50 bps and 75 bps interest rate hike, respectively, at the October meeting, always following the elevated-for-longer narrative around inflation in the region. Furthermore, member Rehn suggested that recession risks in the region have been growing further, while his colleague Centeno warned that a faster than warranted increase in rates may backfire.
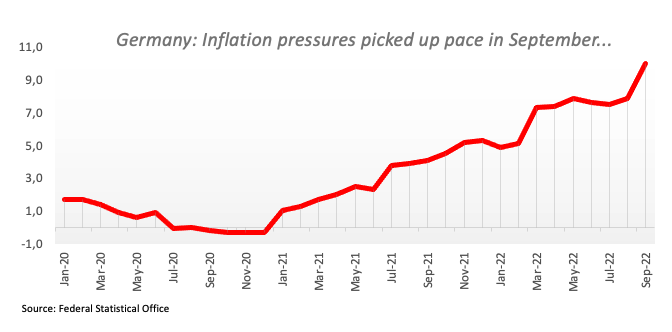
Data wise in Euroland, final figures saw the Consumer Confidence at -28.8 and the Economic Sentiment at 93.7, both for the month of September. In addition, preliminary readings expect Germany’s CPI to rise 1.9% MoM in September and 10.0% from a year earlier.
In the US, Initial Claims rose by 193K in the week to September 24 and the final GDP Growth Rate saw the economy contract 0.6% in the April-June period.
The resumption of the selling pressure could see EUR/USD revisit the 2022 low at 0.9535 (September 28) in the near term prior to the round level at 0.9500 and the weekly low at 0.9411 (June 17 2002). On the flip side, the weekly top at 0.9797 (September 28) should emerge as the initial hurdle for bulls ahead of the weekly peak at 1.0050 (September 20), which remains bolstered by the proximity of the 55-day SMA North from here turns up the 7-month resistance line near 1.0090, above which the pair’s selling bias could alleviate and thus allow for a potential advance to the September high at 1.0197 (September 12) seconded by the 100-day SMA at 1.0248 and the August top at 1.0368 (August 10). The daily RSI edged higher and trespassed the 41 level.
Resistance levels: 0.9797 0.9852 0.9907 (4H chart)
Support levels: 0.9535 0.9411 0.9386 (4H chart)
-638000729482390146.png)
USDJPY
USD/JPY advanced modestly on Thursday, although always within the multi-session consolidative phase in the upper end of the range above the 144.00 yardstick.
The resumption of the uptrend in US yields across the curve seems to have been enough to keep spot navigating in positive waters, offsetting another negative session in the greenback at the same time.
In the Japanese calendar, Foreign Bond Investment shrank to ¥1102.5B in the week to September 24.
Further upside could see the 2022 peak at 145.90 (September 7) revisited ahead of the August 1998 high at 147.67 (August 11 1998) and the August 1990 top at 151.65. In the opposite direction, the post-intervention low at 140.34 (September 22) emerges as the big magnet for bears prior to the 55-day SMA at 138.58 and the 100-day SM at 136.01. Down from here emerges the weekly low at 135.80 (August 23) seconded by the weekly low at 131.73 (August 11) and the August low at 130.39 (August 2). The daily RSI looks consolidative above 62.
Resistance levels: 144.90 145.90 146.97 (4H chart)
Support levels: 143.90 143.50 141.76 (4H chart)
-638000730429836119.png)
GBPUSD
GBP/USD extended the rebound from Monday’s all-time lows and climbed to new weekly highs past 1.1100 the figure on Thursday. Moreover, the British pound has already gained more than seven cents since those lows and keeps well in place the positive performance so far this week.
Daily gains in cable also accelerated after the greenback failed to cling to daily highs near 113.80 when tracked by the USD Index (DXY), and sparked another abrupt U-turn to the low-112.00s.
The UK docket remained empty on Thursday ahead of Friday’s release of the final Q2 GDP Growth Rate and Mortgage Approvals/Lending.
If the rebound in GBP/USD gets more serious, then the next hurdle of note is expected to emerge at the weekly peak at 1.1460 (September 20) ahead of the September high at 1.1738 (September 13), which looks reinforced by the 55-day SMA. Beyond this zone, a probable visit to the weekly top at 1.1900 (August 26) could return to the investors’ radar prior to the 100-day SMA at 1.1984 and just before the psychological 1.2000 mark. On the downside, there are no support levels of significance until the all-time low at 1.0356 (September 26). The daily RSI abandoned the oversold ground and retested the 33 zone.
Resistance levels: 1.1108 1.1281 1.1364 (4H chart)
Support levels: 1.0761 1.0538 1.0356 (4H chart)
-638000730079706447.png)
AUDUSD
AUD/USD traded on the defensive and was unable to continue with Wednesday’s recovery despite another negative performance in the US dollar.
Indeed, sellers returned to the Aussie dollar and trimmed part of the strong uptick recorded in the previous session, although the generalized upbeat tone in the commodity universe appears to have limited the downside in the pair.
On the latter, copper prices added to Wednesday’s rebound, while prices of iron ore dropped to multi-session lows near $95.00 per tonne.
There were no data releases scheduled in the Australian docket on Thursday. The next publication of note will be Monday’s final Manufacturing PMI for the month of September.
A deeper retracement in AUD/USD is expected to retest the 2022 low at 0.6363 (September 28), while the breach of this level could put the weekly low at 0.6253 (April 21 2020) back on the radar in the short-term horizon. Contrarily, minor resistance levels turn up at 0.6747 (September 20) and 0.6770 (September 15) ahead of the 55-day SMA at 0.6843. Further north aligns the 100-day SMA at 0.6906 closely followed by the September peak at 0.6916 (September 13), which is deemed as the latest defense for an assault of the psychological 0.7000 mark before the weekly high at 0.7008 (August 26). The daily RSI corrects lower and revisits the 33 zone.
Resistance levels: 0.6530 0.6580 0.6670 (4H chart)
Support levels: 0.6435 0.6363 0.6337 (4H chart)
-638000730779022176.png)
GOLD
Gold prices charted an inconclusive session and ended around the $1,660 zone on Thursday.
Indeed, the precious metal managed to reverse an earlier drop to daily lows near $1,640 pari passu with the continuation of the downside momentum in the dollar, although the resumption of the march north in US yields limited further attempts of recovery in bullion.
No changes to the broader outlook for the yellow metal, as it remains under the mercy of the Fed dynamics amidst the persistent investors’ repricing of its normalization process.
Further gains in gold now target the weekly peak at $1,688 (September 21) prior to the September high at $1,735 (September 12) and the $1,765 level (August 25), which appears underpinned by the 100-day SMA. Beyond this level comes the key $1,800 barrier before the August top at $1,807 (August 10). On the other hand, the 2022 low at $1,614 (September 28) should hold the initial downside tests seconded by the round level at $1,600 and the April 2020 low at $1,572 (April 1).
Resistance levels: $1,664 $1,688 $1,707 (4H chart)
Support levels: $1,641 $1,621 $1,606 (4H chart)
-638000731055158021.png)
CRUDE WTI
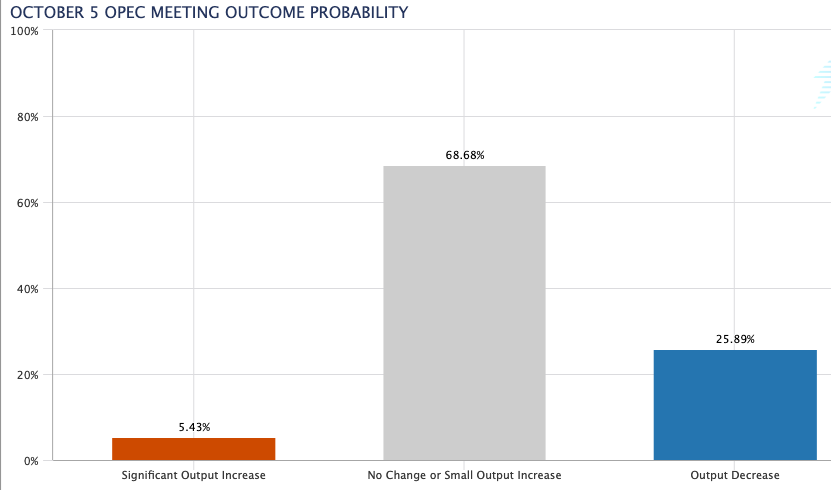
Prices of the WTI clinched the third consecutive daily gain on the back of further correction in the dollar and rising market chatter that the OPEC+ could announce a production cut to offset part of the multi-month weakness in crude oil prices.
On the latter, and according to CME Group’s OPEC Watch Tool, the probability of an output reduction at the cartel’s next meeting on October 5 hovers around 26%.
Volatility in the commodity was also underpinned by omnipresent concerns around the ongoing monetary tightening by major central banks and the likelihood of a global slowdown with direct impact on the demand for oil.
Next on the upside for WTI aligns the weekly highs at $86.66 (September 21) and $90.17 (September 14), which appears preceded by the September top at $90.37 (September 5). If WTI clears the latter, then it could prompt the 200-day SMA at $97.54 to resurface on the horizon prior to the weekly peak at $97.65 (August 30) and the psychological $100.00 mark. Inversely, there is an immediate contention zone at the September low at $76.28 (September 26) ahead of the 2022 low at $74.30 (January 3). The drop below this level could open the door to the weekly low at $66.15 (December 20 2021) before the December 2021 low at $62.46 (December 2).
Resistance levels: $82.92 $85.98 $86.66 (4H chart)
Support levels: $80.32 $76.54 $74.26 (4H chart)
-638000731671131679.png)
DOW JONES
Equities tracked by the three major US stock indices sold off and revisited the area of 2-year lows, rapidly leaving behind Wednesday’s bullish attempt.
Once again, recession fears derived from the ongoing tightening cycle across the world weighed on investors’ sentiment. However, rising concerns that the sell-off in some currencies and bonds could spread to the stock markets also seems to have aggravated the already sour mood among market participants.
That said, the Dow Jones dropped 2.14% to 29,043, the S&P500 retreated 2.73% to 3,617 and the tech-heavy Nasdaq Composite shed 3.27% to 10,690.
Dow Jones faces initial support at the 2022 low at 28,958 (September 27) ahead of the weekly low at 28,902 (November 12 2020) and the October 2020 low at 26,143 (October 30). Bouts of strength are expected to meet the first hurdle at the weekly peak at 29,811 (September 28) followed by another weekly high at 31,026 (September 19). Above the latter comes the September top at 32,504 (September 12) prior to the 33,364 level (August 26), which looks reinforced by the vicinity of the key 200-day SMA. Once cleared, the index could then confront the August peak at 34,281 (August 16) before the April high at 35,492 (April 21). The daily RSI entered the oversold territory after dropping to 29.
Top Performers: Travelers, Visa A, Merck&Co
Worst Performers: Boeing, Apple, Walgreen Boots
Resistance levels: 29,668 31,026 31,784 (4H chart)
Support levels: 28,958 28,902 26,143 (4H chart)
-638000732092892924.png)
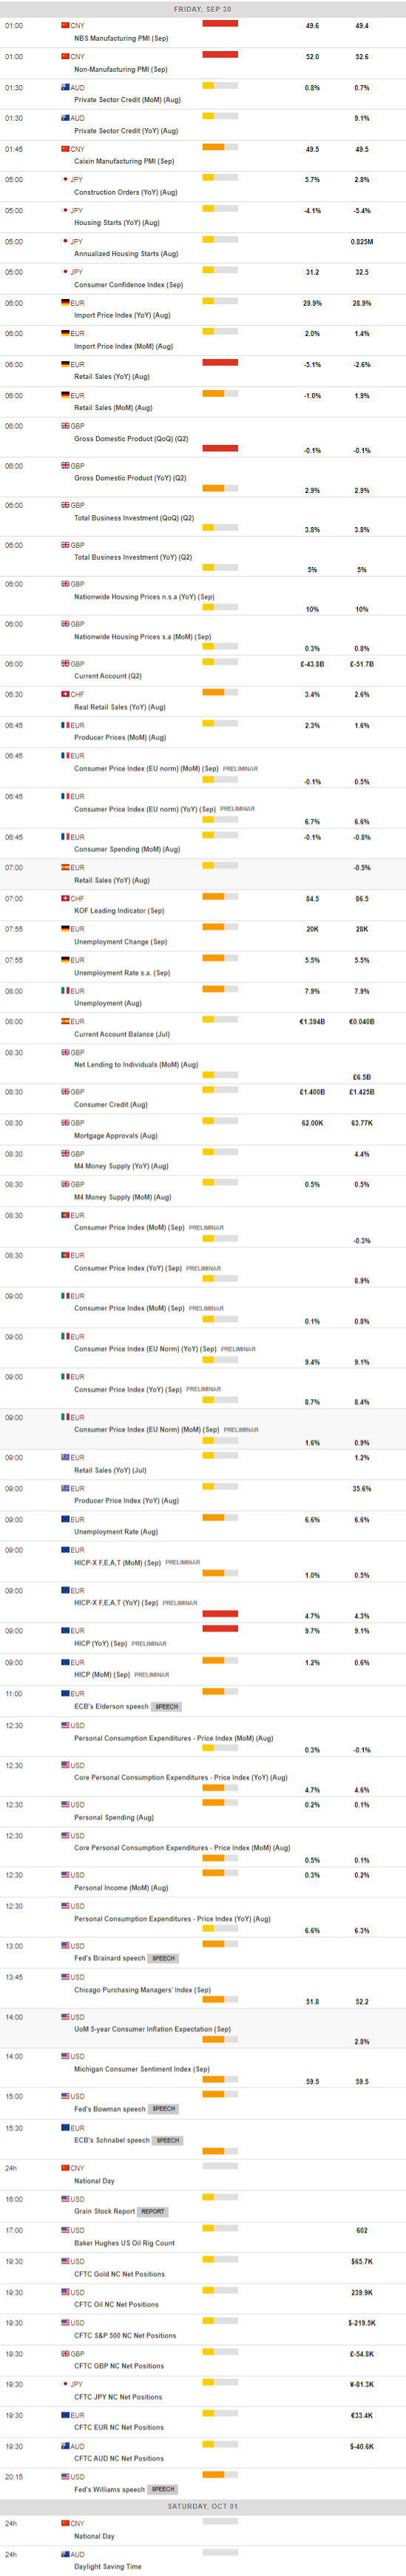
MACROECONOMIC EVENTS
All Information & Updates provided by:

All information relating to the financial markets available on this page has been prepared and issued by FXStreet (Forexstreet SL, Spain, Reg: B62498233) on the basis of publicly available information and all information believed to be reliable and does not conflict with Kuwaiti local laws, and all necessary care has been taken to before the company to ensure that the facts mentioned are correct from the source.
NCM Investment nor any of its directors or employees shall in any way be held responsible for the contents of this news, and the information contained on this page is intended only to provide clients with publicly available information and should not be construed as investment advice, report or analysis and/or constitute an offer or invitation to buy or sell financial instruments of any kind.
RISK WARNING: Forex and CFDs are highly risky leveraged products, as losses can exceed deposits. Please ensure you understand all the risks and take independent advice if necessary. NCM will segregate the clients based on the criteria of the regulator and its bylaws. NCM does not provide any advisory service; the material published does not constitute advice or a recommendation for a transaction in any financial instrument. NCM accepts no responsibility for any use of the content presented and any consequences of that use. Anyone acting on the information provided does so at their own risk.