
- Contact Us:
-

-

-

-


Daily Market Updates
03 Oct 2022
EURUSD
After advancing to new multi-session highs around 0.9850, EUR/USD met a wave of selling orders and ended Friday’s session around the 0.9800 region on the back of the strong rebound in the dollar.
Indeed, the greenback managed to reverse the initial pessimism and encouraged the USD Index (DXY) to regain the area north of the 112.00 yardstick on Friday helped by the extra gains in US yields across the curve.
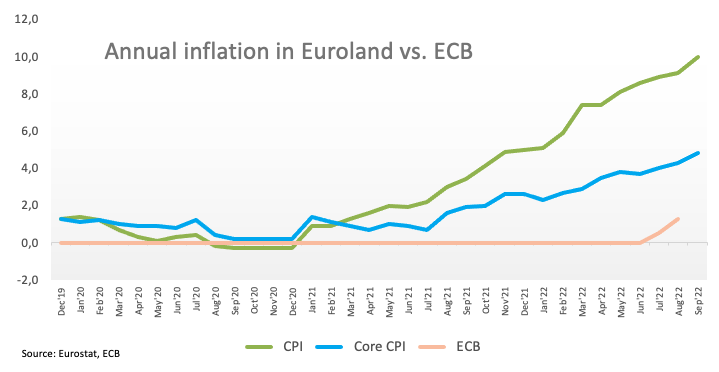
In the domestic calendar, the German labour market report was out and showed the Unemployment Rate unchanged at 5.5% in September, while the Unemployment Change rose by 14K persons in the same period. Later in the session, flash inflation figures in the broader Euroland now see the headline CPI rising 10.0% in the year to September and 4.8% YoY when it comes to the Core CPI. Still in the euro area, the Unemployment Rate stayed the same in August at 6.6%.
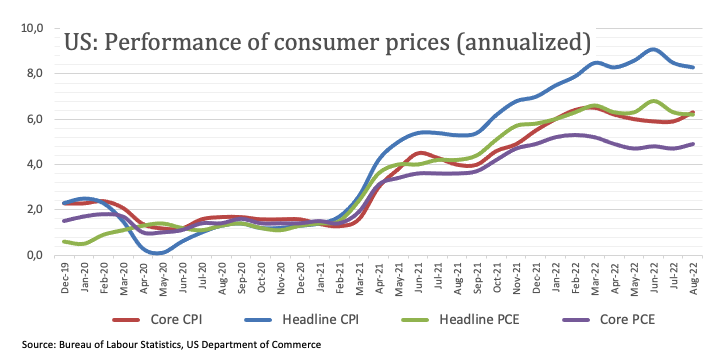
Across the Atlantic, inflation measured by the PCE – the Fed’s preferred gauge – rose 6.2% YoY in August and the Core PCE gained 4.9% YoY. In addition, Personal Income expanded 0.3% MoM also in August and Personal Spending rose 0.4% vs. the previous month.
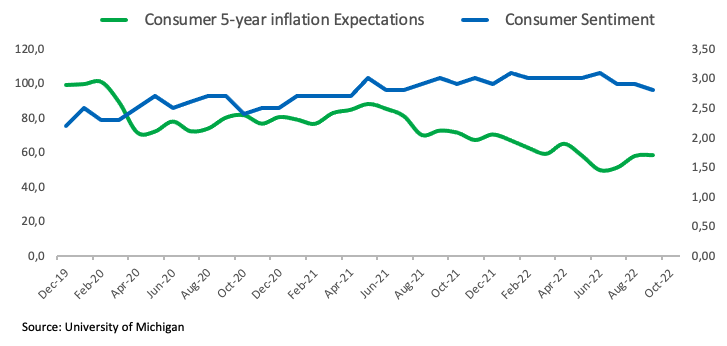
Lastly, final figures saw the Michigan Consumer Sentiment improve to 58.6 for the month of September.
A deeper correction in EUR/USD should meet the next support of note at the 2022 low at 0.9535 (September 28) ahead of the round level at 0.9500 and the weekly low at 0.9411 (June 17 2002). On the other hand, there is an initial hurdle at the weekly peak at 0.9853 (September 30) seconded by the weekly high at 1.0050 (September 20), which appears propped up by the vicinity of the 55-day SMA, and the 7-month resistance line near 1.0080. The pair’s downtrend is expected to lose traction once the latter is cleared, therefore allowing a probable test of the September top at 1.0197 (September 12) ahead of the 100-day SMA at 1.0242 and the August peak at 1.0368 (August 10). The daily RSI deflated a tad to the proximity of 41.
Resistance levels: 0.9853 0.9907 0.9945 (4H chart)
Support levels: 0.9734 0.9635 0.9535 (4H chart)
-638003340599730513.png)
USDJPY
USD/JPY clinched the second daily gain in a row on the back of the decent recovery in the dollar and further rebound in US yields across the curve.
Indeed, US yields added to the positive performance in the second half of the week and approached the area of recent multi-year highs, while the USD Index (DXY) managed to return beyond 112.00 the figure following a steep correction soon after hitting new cycle tops around 114.80 (September 28).
In Japan, August’s Unemployment Rate ticked lower to 2.5% (from 2.6%), flash Industrial Production is expected to expand 5.1% in the year to August and Retail Sales rose 4.1% YoY in the same period. In addition, Consumer Confidence eased to 30.8 (from 32.5) in September and Housing Starts expanded 4.6% YoY during August.
USD/JPY appears poised to extend its ongoing consolidation for the time being. Against that, the 2022 high at 145.90 (September 7) remains as the big magnet for bulls prior to the August 1998 top at 147.67 (August 11 1998) and the August 1990 peak at 151.65. Contrarily, there is an initial contention at the post-intervention low at 140.34 (September 22) ahead of the 55-day SMA at 138.70 and the 100-day SMA at 136.17. Further south comes the weekly low at 135.80 (August 23) before the weekly low at 131.73 (August 11) and followed by the August low at 130.39 (August 2). The daily RSI looks stable around 63.
Resistance levels: 144.90 145.90 146.97 (4H chart)
Support levels: 143.90 143.50 141.76 (4H chart)
-638003342468980896.png)
GBPUSD
What a roller-coaster of a week for the British pound.
Indeed, after dropping to all-time lows in the 1.0350 region at the beginning of the week, GBP/USD managed to regain composure and close the next four consecutive sessions with gains, closing at the same time the first week in the positive territory after two retracements in a row.
However, the acute rebound in the pair came almost exclusively on the back of renewed dollar weakness and at some extent following the better tone in the riskier assets, leaving the fragile domestic background largely unchanged and emerging as a challenge for the sterling in the months to come.
Extra support for the quid came after final Q2 GDP figures surprised to the upside and expanded 4.4% YoY and 0.2% QoQ. In addition, Mortgage Approvals increased more than expected to 74.34K in August and the Nationwide Housing Prices expanded 9.5% in the year to September.
Further recovery in GBP/USD now targets the weekly high at 1.1234 (September 30) ahead of the September top at 1.1738 (September 13), which also seems bolstered by the proximity of the 55-day SMA. Once cleared, cable could extend the upside to the weekly peak at 1.1900 (August 26) seconded by the 100-day SMA at 1.1975 and prior to the psychological 1.2000 yardstick. On the flip side, there is a minor support at 1.0538 (September 28) followed by the all-time low at 1.0356 (September 26). The daily RSI rebounded further and retested 42.
Resistance levels: 1.1234 1.1264 1.1364 (4H chart)
Support levels: 1.1024 1.0761 1.0538 (4H chart)
-638003341999352795.png)
AUDUSD
AUD/USD added to Thursday’s pullback and dropped to 2-day lows in the 0.6390 region in response to the marked recovery in the US dollar on Friday.
Furthermore, the Aussie dollar closed the third consecutive week with losses, retreating at the same time for the second month in a row.
Indeed, spot ended Friday’s session in the lowest level amidst the resumption of the bullish bias in the greenback, while the mixed performance in the commodity space also added to the sour mood around AUD. On this, copper prices gave away some of its recent gains, while the tonne of iron ore advanced modestly above the $96.00 mark.
Next on tap in the Australian calendar will be Monday’s release of the final S&P Global Manufacturing PMI and the Ii Group Manufacturing Index.
AUD/USD remains under pressure and further decline is expected to revisit the 2022 low at 0.6363 (September 28). The loss of this region could open the door to the weekly low at 0.6253 (April 21 2020) prior to the April 2020 low at 0.5980 (April 3). In the opposite direction, there is a minor hurdle at the weekly peak at 0.6747 (September 20) before the interim 55-day SMA at 0.6836. Extra advance could target the 100-day SMA at 0.6901, which underpins the September high at 0.6916 (September 13). If the pair clears the latter, it could then challenge the psychological 0.7000 level ahead of the weekly top at 0.7008 (August 26). The daily RSI grinded lower and entered the oversold territory near 29.
Resistance levels: 0.6530 0.6550 0.6670 (4H chart)
Support levels: 0.6390 0.6363 0.6337 (4H chart)
-638003342903963849.png)
GOLD
Gold prices advanced to fresh multi-session peaks around $1,675, although the bullish attempt lacked follow through and the yellow metal ended the session only with marginal gains around $1,660.
The improvement in the mood around the dollar in combination with further rebound in US yields all undermined the initial upbeat sentiment in the precious metal, which managed to reverse to weeks with losses, nonetheless.
In the meantime, bullion remains under the mercy of dollar dynamics, as markets continue to reprice the Fed’s next steps regarding its tightening stance amidst the constant battle to tame the elevated inflation.
The weekly peak at $1,675 (September 30) now emerges as the initial up barrier seconded by another weekly high at $1,688 (September 21) and the September top at $1,735 (September 12). North from here appears the $1,765 level (August 25), which still looks propped up by the 100-day SMA ahead of the key $1,800 barrier. Immediately to the downside, bears should meet the next support at the 2022 low at $1,614 (September 28) prior to the round level at $1,600 and the April 2020 low at $1,572 (April 1).
Resistance levels: $1,675 $1,688 $1,707 (4H chart)
Support levels: $1,641 $1,621 $1,606 (4H chart)
-638003343300191634.png)
CRUDE WTI
WTI prices added to Thursday’s losses and revisited the sub-$80.00 area on Friday, maintaining the pessimism witnessed in the second half of the week.
Friday’s pullback in prices of the American reference for the sweet light crude oil also came in response to the resumption of the bid bias around the US dollar and omnipresent recession concerns among traders.
Despite the drop in the last couple of sessions, WTI clinched the first weekly gain after four consecutive losses, although the negative streak extended for the fourth consecutive month.
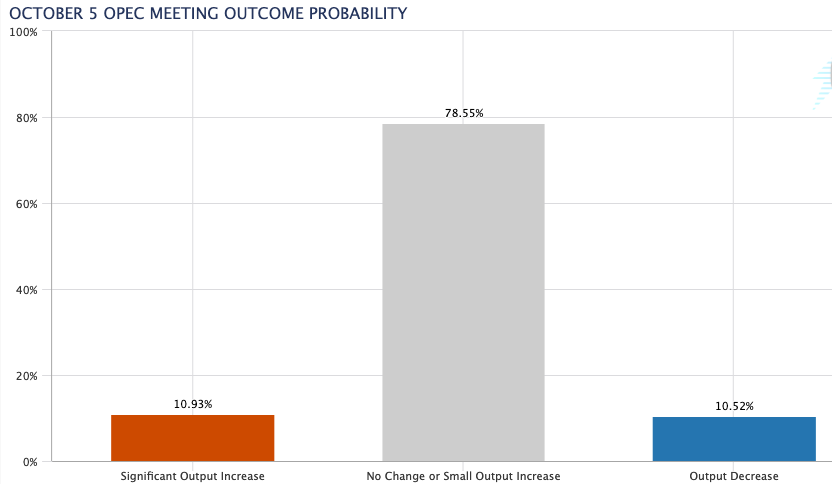
Bullish attempts around crude oil during the past week were mainly supported by speculation that the OPEC+ could cut its production quotas at its October 5 meeting. So far, the probability of this scenario hovers around 78% according to CME Group’s OPEC Watch Tool.
In the calendar, driller Baker Hughes reported US oil rig count went up by 2 rigs in the week to September 30, taking the total US active oil rigs to 604.
There is a minor up barrier at the weekly high at $82.92 (September 29). If WTI breaks above this level it could then visit the weekly tops at $86.66 (September 21) and $90.17 (September 14), just ahead of the September peak at $90.37 (September 5). North from here emerges the 200-day SMA at $97.57 before the weekly high at $97.65 (August 30) and the psychological $100.00 mark. On the contrary, the September low at $76.28 (September 26) appears as the immediate support for bears ahead of the 2022 low at $74.30 (January 3). Extra weakness could prompt the weekly low at $66.15 (December 20 2021) to re-emerge on the horizon prior to the December 2021 low at $62.46 (December 2).
Resistance levels: $82.92 $85.98 $86.66 (4H chart)
Support levels: $79.12 $76.54 $74.26 (4H chart)
-638003344145475585.png)
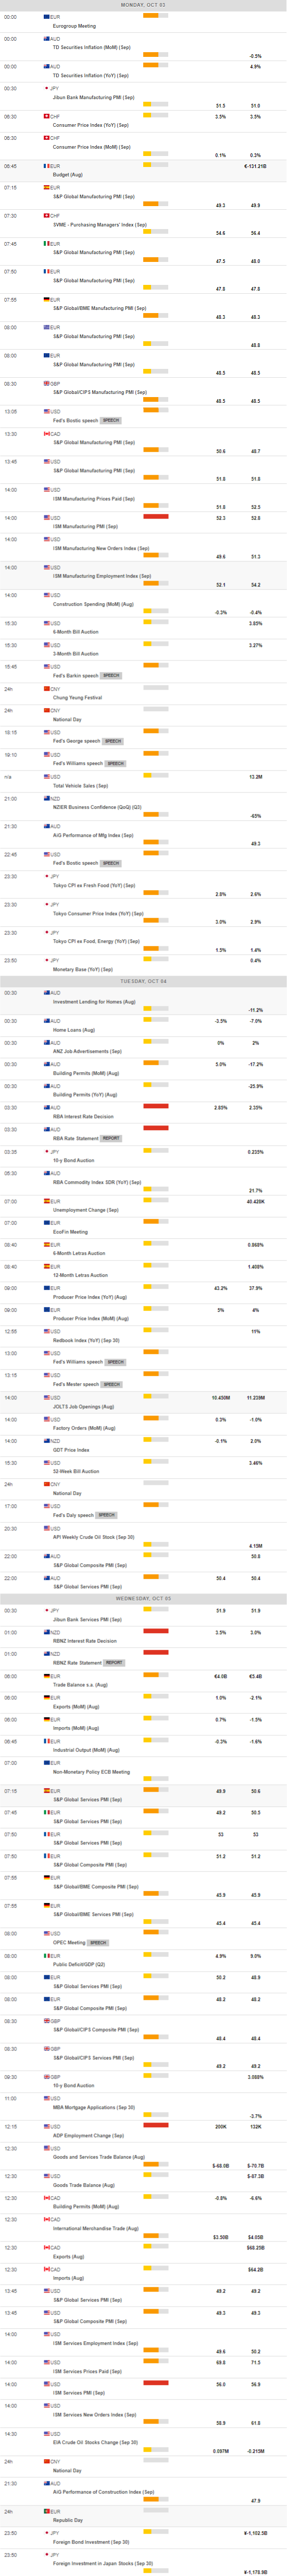
MACROECONOMIC EVENTS
All Information & Updates provided by:

All information relating to the financial markets available on this page has been prepared and issued by FXStreet (Forexstreet SL, Spain, Reg: B62498233) on the basis of publicly available information and all information believed to be reliable and does not conflict with Kuwaiti local laws, and all necessary care has been taken to before the company to ensure that the facts mentioned are correct from the source.
NCM Investment nor any of its directors or employees shall in any way be held responsible for the contents of this news, and the information contained on this page is intended only to provide clients with publicly available information and should not be construed as investment advice, report or analysis and/or constitute an offer or invitation to buy or sell financial instruments of any kind.
RISK WARNING: Forex and CFDs are highly risky leveraged products, as losses can exceed deposits. Please ensure you understand all the risks and take independent advice if necessary. NCM will segregate the clients based on the criteria of the regulator and its bylaws. NCM does not provide any advisory service; the material published does not constitute advice or a recommendation for a transaction in any financial instrument. NCM accepts no responsibility for any use of the content presented and any consequences of that use. Anyone acting on the information provided does so at their own risk.