
- Contact Us:
-

-

-

-


Daily Market Updates
04 Oct 2022
EURUSD
EUR/USD managed well to stick to the positive territory around the 0.9800 neighbourhood, reversing an initial drop to the mid-0.9700s on Monday.
The persistent sell-off in the greenback was behind the daily uptick in the pair and saw the USD Index (DXY) break below the 112.00 barrier once again.
The move higher in spot came in tandem with a marked decline in US and German yields, where the 10-year benchmark notes eased to 3.55% and 1.88%, respectively.
Nothing new in the more macro scenario, where the narrative among market participants continues to favour a 75 bps rate hike by the Federal Reserve at the November 2 meeting and a similar move by the ECB at its gathering on October 27.
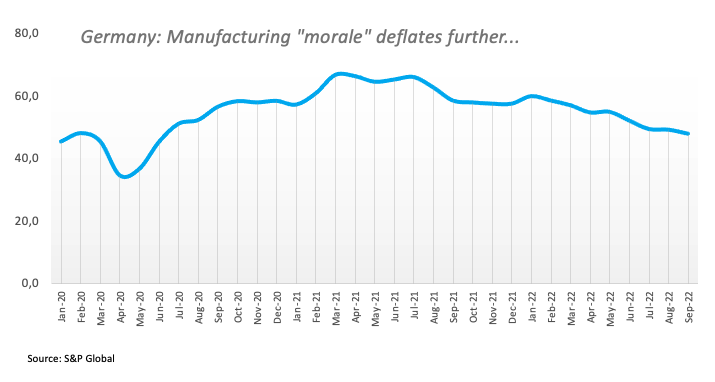
In the euro docket, final figures saw the S&P Global Manufacturing PMI advance to 47.8 in Germany for the month of September, and 48.4 in the broader Euroland.
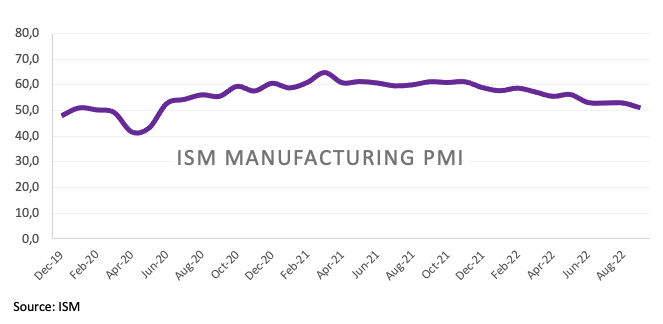
In the US, the S&P Global Manufacturing PMI came at 52.0 for the last month and the more relevant ISM Manufacturing PMI declined a tad to 50.9 in September. In addition, Construction Spending contracted 0.7% in August vs. the previous month.
If sellers continue to dominate the sentiment, EUR/USD is expected to face the next contention at the 2022 low at 0.9535 (September 28) prior to the round level at 0.9500 and ahead of the weekly low at 0.9411 (June 17 2002). On the flip side, the weekly high at 0.9853 (September 30) emerges as the immediate up barrier followed by the interim 55-day SMA at 1.0037 and the weekly top at 1.0050 (September 20). Further up turns up the 7-month resistance line near 1.0080, which if breached it should alleviate the pair’s selling pressure and open the door to a probable visit to the September peak at 1.0197 (September 12) before the 100-day SMA at 1.0236 and the August high at 1.0368 (August 10). The daily RSI remained consolidative above 43.
Resistance levels: 0.9853 0.9907 0.9936 (4H chart)
Support levels: 0.9734 0.9635 0.9535 (4H chart)
-638004220853568263.png)
USDJPY
USD/JPY faded Friday’s uptick and gave away part of that advance, although it kept well in place the prevailing multi-session consolidative mood above the 144.00 yardstick.
Fresh weakness in spot came in response to another volatile day in the greenback, which broke below the 112.00 support with certain conviction when gauged by the USD Index (DXY). Also adding to the downbeat mood in the pair, US yields reversed two consecutive daily pullbacks and dropped to multi-day lows across the curve.
The BoJ Summary of Opinions fell somewhat on the dovish side after they suggested the central bank should maintain the ongoing accommodative stance as long as the output gap remains negative. In addition, the current ultra-loose monetary conditions look preferable amidst the unpredictable impact of the pandemic and prospects for declining inflation in the coming fiscal year and beyond.
In Japan, final figures saw the Jibun Bank Manufacturing PMI at 50.8 in September. Of more relevance were the results of the Tankan survey for the July-September period, where the Large All Industry Capex improved to 21.5%, the Large Manufacturers Index eased to 8, the Large Manufacturing Outlook receded to 9 and the Large Non-Manufacturing Index ticked higher to14.
No changes to the topside in USD/JPY, as the 2022 top at 145.90 (September 7) emerges as the initial hurdle seconded by the August 1998 peak at 147.67 (August 11 1998) and the August 1990 high at 151.65. In the opposite direction, the post-intervention low at 140.34 (September 22) is expected to hold the initial test prior to the 55-day SMA at 138.81 and the 100-day SMA at 136.32. A deeper retracement could revisit the weekly low at 135.80 (August 23) ahead of the weekly low at 131.73 (August 11) and the August low at 130.39 (August 2). The daily RSI lost the grip somewhat and breached 63.
Resistance levels: 144.90 145.90 146.97 (4H chart)
Support levels: 143.90 143.50 141.76 (4H chart)
-638004228345475009.png)
GBPUSD
GBP/USD rose to fresh 2-week highs well north of 1.1300 the figure on the back of the resumption of the selling bias in the greenback on Monday, while Chancellor Kwarteng’s decision to scrap a major part of his tax-cut plans also lend further legs to the sterling and collaborated with the upside.
However, further effervescence re-emerged on the UK political scenario following Kwarteng’s decision, as PM L.Truss suggested the Chancellor did not discuss it with the Cabinet, opening another crack in the already fragile context surrounding Number 10.
In the UK, final S&P Global Manufacturing PMI improved a little to 48.4 in September (from 47.3).
GBP/USD now faces the next up barrier at the weekly top at 1.1460 (September 20) prior to the 55-day SMA at 1.1712 and the September peak at 1.1738 (September 13). North from here comes the weekly high at 1.1900 (August 26) ahead of the 100-day SMA at 1.1964 and just before the psychological 1.2000 mark. On the downside, a minor support aligns at 1.0538 (September 28) seconded by the all-time low at 1.0356 (September 26). The daily RSI bounced sharply and navigated close to 47.
Resistance levels: 1.1292 1.1364 1.1440 (4H chart)
Support levels: 1.1024 1.0761 1.0538 (4H chart)
-638004227910150705.png)
AUDUSD
AUD/USD rose sharply and managed to reclaim the area well north of the 0.6500 mark and poke at the same time with Friday’s tops.
The strong move higher in the pair came exclusively on the back of renewed dollar weakness, while the commodity space posted mixed results, where prices of the iron ore charted a positive session in contrast to the daily decline in copper prices.
Data wise Down Under, the final S&P Global Manufacturing PMI remained in the expansion territory in September at 53.5. In the meantime, all the attention is predicted to be on the RBA event early on Tuesday, where the central bank is seen raising the OCR by ¼ percentage point.
If sellers push harder, AUD/USD should revisit the 2022 low at 0.6363 (September 28) sooner rather than later. South from here turns up the weekly low at 0.6253 (April 21 2020) ahead of the April 2020 low at 0.5980 (April 3). In case of further recovery, a test of the weekly high at 0.6747 (September 20) should start emerging on the horizon ahead of the interim 55-day SMA at 0.6831 and the 100-day SMA at 0.6896. The latter also props up the September high at 0.6916 (September 13) prior to the psychological 0.7000 mark before the weekly peak at 0.7008 (August 26). The daily RSI leapt to the proximity of 40.
Resistance levels: 0.6517 0.6530 0.6550 (4H chart)
Support levels: 0.6390 0.6363 0.6337 (4H chart)
-638004228663818363.png)
GOLD
Fresh downside pressure hitting the dollar motivated the yellow metal to trade at shouting distance from the key $1,700 mark per ounce troy on Monday, adding to the intense rebound from last week’s YTD lows around $1,615.
In addition, a marked decline in US yields across the curve – particularly in the 10-year note - lent extra wings to the precious metal, taking it to new 3-week peaks and above the key 200-week SMA ($1,683) at the same time.
Furthermore, bullion started the new month with gains, quite an auspicious – albeit premature - way to reverse a 6-month negative streak.
Bullion printed a new weekly top at $1,694 (October 3). The surpass of this level could put a visit to the September peak at $1,735 (September 12) back on the traders’ radar ahead of the $1,765 level (August 25), which appears bolstered by the 100-day SMA. North from here emerges the critical $1,800 zone, closely followed by the August high at $1,807 (August 10). On the downside, there are no support levels of note until the 2022 low at $1,614 (September 28) ahead of the round level at $1,600 and seconded by the April 2020 low at $1,572 (April 1).
Resistance levels: $1,694 $1,701 $1,731 (4H chart)
Support levels: $1,654 $1,641 $1,614 (4H chart)
-638004228954369350.png)
CRUDE WTI
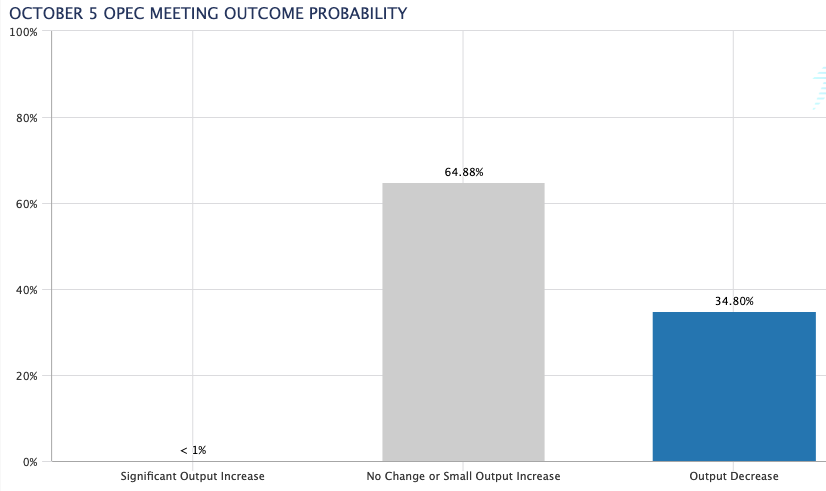
Prices of the barrel of the WTI rose to multi-day highs past the $84.00 mark in response to the combination of a weaker dollar and speculation of a larger-than-expected oil output cut by the OPEC+, to be announced at the cartel’s meeting on October 5.
Indeed, traders seem to have welcomed the idea of a probable 1 million bpd cut by the OPEC+ vs. expectations of around 50 kbpd.
On this, CME Group OPEC Watch Tool sees the possibility of a reduction of the oil output at nearly 35%.
Later in the week, the API and the EIA will report on the weekly variation of US crude oil inventories in the week to September 30 on Tuesday and Wednesday, respectively.
Immediately to the upside for WTI now comes the weekly peaks at $86.66 (September 21) and $90.17 (September 14), closely followed by the September high at $90.37 (September 5). The surpass of this level could prompt the key 200-day SMA at $97.62 to re-emerge on the horizon ahead of the weekly top at $97.65 (August 30) and the psychological $100.00 yardstick. Inversely, there is initial support at the September low at $76.28 (September 26) prior to the 2022 low at $74.30 (January 3). If cleared, then the WTI could challenge the weekly low at $66.15 (December 20 2021) before the December 2021 low at $62.46 (December 2).
Resistance levels: $84.52 $85.98 $86.66 (4H chart)
Support levels: $81.13 $79.12 $76.54 (4H chart)
-638004229590137779.png)
DOW JONES
Equities tracked by the three major US stock indices started the quarter on a strong foot and rose to 2-day highs on Monday.
In fact, the soft start of the week for the US dollar along with declining yields sustained the appetite for the risk complex.
Additionally, the lower-than-estimated print from the key ISM Manufacturing in September added to the speculation that the Fed might step on the brakes when it comes to its current aggressive normalization process, all collaborating with the renewed (and much-needed) optimism among market participants.
That said, the Dow Jones advanced 2.69% to 29,496, the S&P500 gained 2.60% to 3,679 and the tech-heavy Nasdaq Composite rose 2.02% to 10,788.
If the recovery gathers extra steam, the Dow Jones could face the next hurdle at the weekly top at 29,811 (September 28) prior to another weekly peak at 31,026 (September 19). Once cleared, a probable move to the September high at 32,504 (September 12) could return to the investors’ radar followed by the 200-day SMA at 33,175 and the 33,364 level (August 26). Looking south, there is initial contention at the 2022 low at 28,715 (September 30) seconded by the October 2020 low at 26,143 (October 30). The daily RSI jumped past the 38 level.
Top Performers: Chevron, Caterpillar, Intel
Worst Performers: J&J, Merck&Co, Coca-Cola
Resistance levels: 29,811 31,020 31,751 (4H chart)
Support levels: 28,715 26,143 26,013 (4H chart)
-638004230071067131.png)
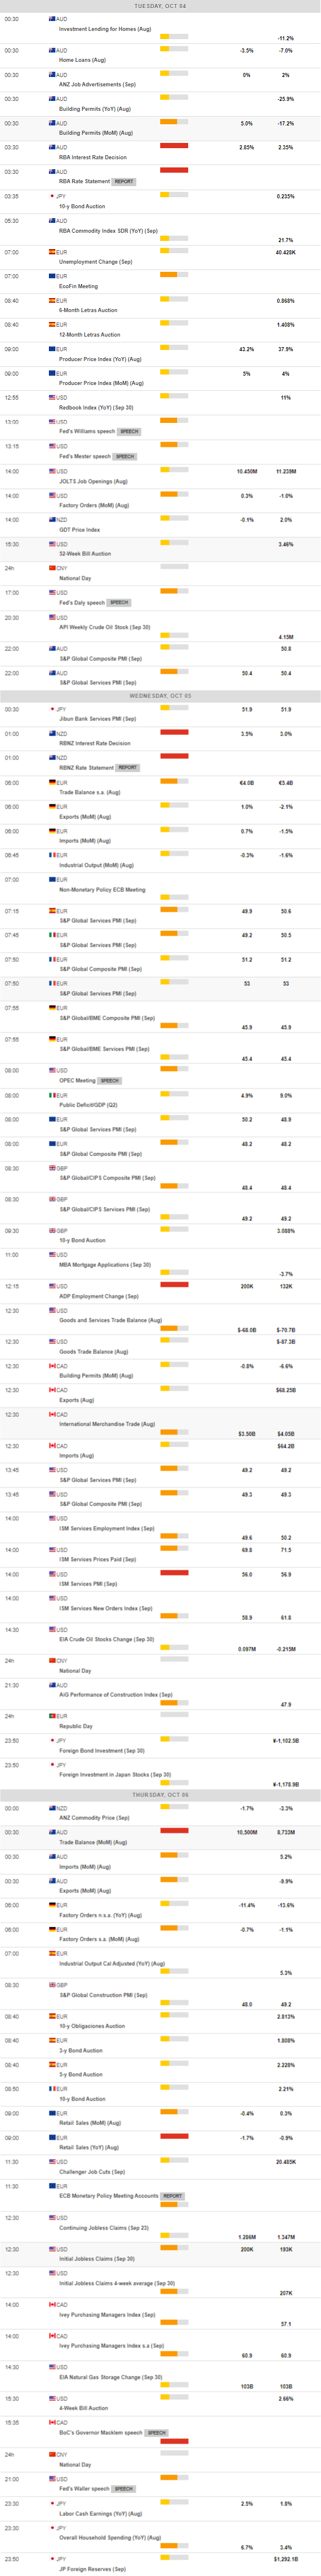
MACROECONOMIC EVENTS
All Information & Updates provided by:

All information relating to the financial markets available on this page has been prepared and issued by FXStreet (Forexstreet SL, Spain, Reg: B62498233) on the basis of publicly available information and all information believed to be reliable and does not conflict with Kuwaiti local laws, and all necessary care has been taken to before the company to ensure that the facts mentioned are correct from the source.
NCM Investment nor any of its directors or employees shall in any way be held responsible for the contents of this news, and the information contained on this page is intended only to provide clients with publicly available information and should not be construed as investment advice, report or analysis and/or constitute an offer or invitation to buy or sell financial instruments of any kind.
RISK WARNING: Forex and CFDs are highly risky leveraged products, as losses can exceed deposits. Please ensure you understand all the risks and take independent advice if necessary. NCM will segregate the clients based on the criteria of the regulator and its bylaws. NCM does not provide any advisory service; the material published does not constitute advice or a recommendation for a transaction in any financial instrument. NCM accepts no responsibility for any use of the content presented and any consequences of that use. Anyone acting on the information provided does so at their own risk.